
|
|
1.IntroductionA fiber-scanning endomicroscope is one of the powerful tools used for visualizing gastrointestinal and colonic images in vivo at a cellular level. Endomicroscopes were originally developed using a fiber bundle and a gradient-index lens objective.1,2 One of the main advantages of the fiber bundle type is that its beam scanning unit is located outside of the endoscopic probe, so the size of the probe can be easily reduced. However, its image quality is quite degraded by the pixelation resulting from gaps between individual optical fibers within the fiber bundles, even if a frequency filter eliminates the honeycomb pattern of the fiber bundle.3 Beam scanning can also be conducted using a microelectromechanical systems (MEMS) mirror inside the endoscopic probe4–6 instead of a fiber bundle/outer scanning unit. Endoscopic probes that use a MEMS mirror were mainly developed for the side-view type. Due to the bulky volume of the MEMS mirror including electronic parts, it is also hard to assemble into a diameter smaller than about 5 mm. Fiber-scanning endomicroscopes have been studied in several ways to reduce outer size. Some miniature microscopes have been developed using different light guides between illumination and detection parts.7–9 On the other hand, a double-clad fiber has also been used to guide illumination/detection light with the fiber and to develop a compact fiber-optic two-photon endomicroscope.10–15 In respect to the beam scanning method using a piezoelectric (PZT) actuator, it can be classified into two types: those using a tubular PZT actuator,9,10,12,14–19 and those using a bimorph (or trimorph) PZT actuator.7,11,13,20,21 Most of the studies with the tubular PZT actuator have used spiral12,14–17 or lissajous18 pattern scanning methods, around the fiber’s resonant modes. These scanning methods have significant nonuniformity between the inner and outer parts of the scanning area. Also, the actuation range of the tubular PZT actuator is too short (tens of micrometers) to provide a suitable field-of-view within a specimen. To obtain a scanning range of hundreds of micrometers, scanning of the fiber near the resonant mode of the fiber is essential. A bimorph PZT actuator can utilize a raster type scanning method.13 However, one direction of that scanning should be conducted in a nonresonant mode, and this increases the rigid length of the endoscopic probe, because it requires the bimorph PZT to have quite a long length. Also, Li and Fu’s group has studied a resonant fiber-optic PZT scanner to achieve a raster scanning pattern.11,21 These are scanned at a resonant mode so the scanning speed cannot be freely changed. Sawinski and Denk’s group has developed a nonresonant raster scanning endomicroscope using a piezolever fiber scanner composed of four trimorph PZT actuators.20,22 These studies have advantages to control imaging field–of-view and speed easily, but its outer diameter still could not become smaller than 5 mm due to the size of the four trimorph PZT actuators. In this paper, a fiber-optic raster scanning endomicroscope was developed using a tubular PZT actuator. By using a nonresonant fiber scanning type, its scanning speed and scanning area can be easily controlled by adjusting the applied voltages of the quarter tubular PZT actuator. Controlling the scanning speed and area is a necessity. Some commercial scanning microscopes have utilized a set of two galvano mirrors or a set of resonant/galvano mirrors for this purpose.23,24 In particular, the scanning speed, pixel dwell time, and scanning area should be adjusted when the detection period is quite long. This is the case, for example, with a fluorescence lifetime imaging microscope, or when partial scanning is needed, such as fluorescence recovery after photobleaching25,26 and fluorescence loss in photobleaching.27 2.MethodsThe system configuration of the experimental device is shown in Fig. 1. A collimated beam from a femto-second pulse laser with a center wavelength of 780 nm (FemtoFiber pro NIR, Toptica, Munich, Germany) was chirped negatively by a customized prism pair and focused into a core of double-clad fiber (SMM900, Fibercore, Southampton, United Kingdom) with 50 cm of length. To compensate for the pulse dispersion caused by propagation of the fiber core, the pulse width was measured by an intensity autocorrelator (Mini, APE, Berlin, Germany) after the laser traveled inside the core. The auto correlation function was measured to be 2115 fs, which corresponds to a pulse width of 1058 fs as shown in Fig. 2(a). Therefore, the entire group delay dispersion of our system was calculated to be since the initial pulse width was 100 fs. Negative chirp was applied with a customized prism pair which has a short length and high light efficiency. Chirping with one or more gratings was excluded in this study to maximize light efficiency. The prism had an apex angle of 54.85 deg and S-NPH3 (Ohara, Branchburg, New Jersey) was chosen as the glass material due to its superior high refractive index and dispersion characteristics (, ). The distance between the two prisms was selected to be 51.5 cm using an equation derived from the optical path.28 The light efficiency of the negative chirping unit was measured to be 79.2%. Fig. 2Auto correlation function (blue, solid line) and its Lorentz fitting (red, dot line) are shown: (a) without a prism pair and (b) after negative chirping with a prism pair. 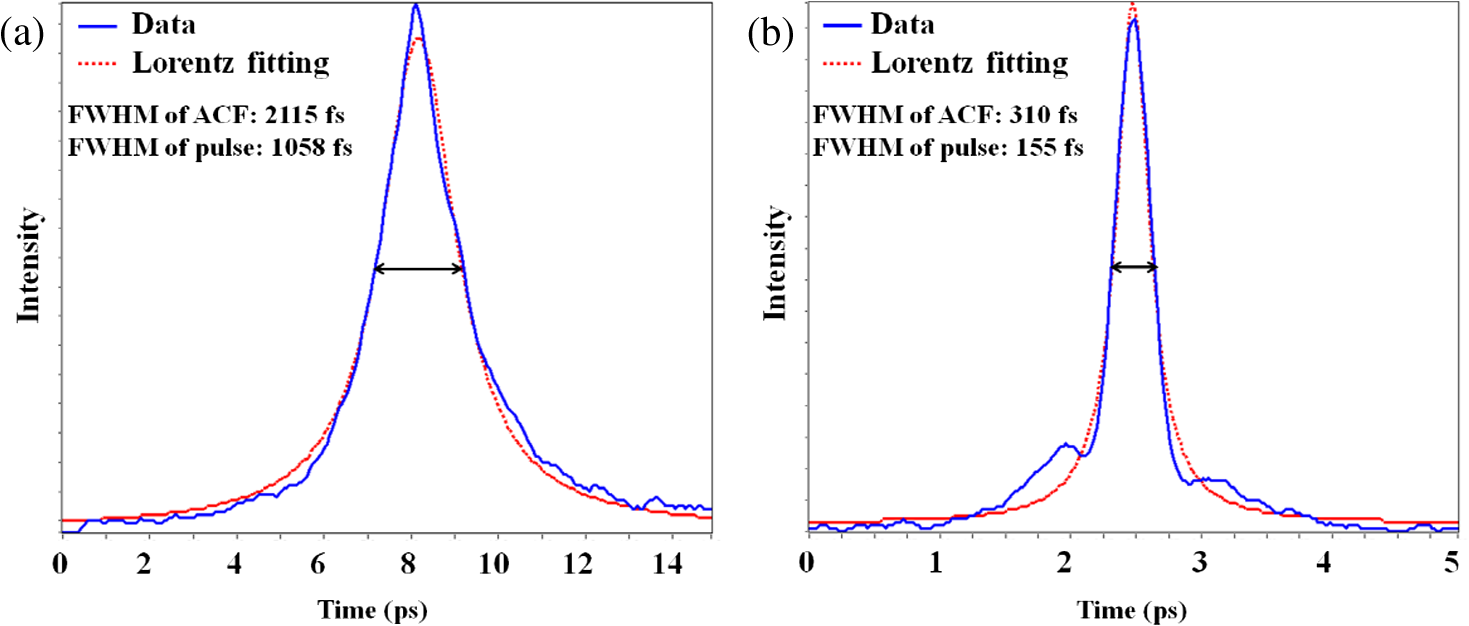 Inside the endoscopic probe, one side of a tubular PZT (Customized, PI, Lederhose, Germany) was attached to a PZT holder located inside the probe housing. A hinge made from stainless film was attached to the other side of the tubular PZT. The fiber penetrates through a hole in the hinge. The small actuation range of the tubular PZT ( at ) was amplified with a lever mechanism. A commercial gradient-index (GRIN) objective lens (GT-M0-080-018-810, GRINTECH, Jena, Germany) with 0.8 NA was used to get high efficiency from the two-photon effect on a focal spot. Also, the thickness of the hinge affected the deflection range. In our simulation results, when the hinge was thickened, the deflection range was dramatically reduced. Therefore, a stainless film having 10 μm of thickness was chosen as the hinge material to provide sufficient range and be robust against tearing. All other mentioned dimensions, and , were decided after finite element method (FEM) simulation of the probe model. 3.Results3.1.Simulation ResultsThe results of FEM simulation are shown in Fig. 3. Figure 3(a) shows a model of the simulation. The fiber length, , was fixed at 21 mm, as limited by the length of the tubular PZT (20 mm). Depending on , the lateral displacement of the distal end of the fiber varied from to as shown in Fig. 3(b). Also, contact conditions between the fiber and the hinge affect the results. However, adjusting the tolerance between the fiber and the hole of the hinge was practically very difficult. Instead of making a sliding joint, the minute space inside the hole was filled and fixed by elastic epoxy (EP001, Cemedine, Tokyo, Japan) to permit a relative and flexible movement. To verify the strength of the hinge, maximum stresses were also calculated by FEM simulation as shown in Fig. 3(c). Maximum stresses (Max. principal stress) applied on the fiber varied from 81.0 to 140.4 MPa, which was much lower than the rupture stress of the fiber (2350 MPa29). Maximum stresses (Max. von Mises stress) applied on the hinge varied from 92.5 to 110.5 MPa, which was lower than the yield strength of the hinge material (Stainless steel, ). The first-resonant frequency of the fiber according to is shown in Fig. 3(d). The simulation result indicates that the length of is almost unaffected by the resonant frequency of the fiber, which ranges from 157.5 to 158.6 Hz. After considering all of these factors, was determined to be 1.2 mm, to achieve the maximum lateral displacement. After fixing the as 1.2 mm, we considered the effect caused by the thickness of the epoxy bonded between the hole of the hinge and the fiber. FEM simulation was conducted and is shown in Fig. 3(e). The larger the thickness of the epoxy, the smaller the lateral displacement of the fiber tip becomes. This is reasonable since the change of epoxy thickness is equivalent to the change of . Also, the overall stiffness of the lever structure will increase as thicker epoxy bonding is used. The endoscopic probe was assembled into an aluminum housing produced by a wire cutting process with an outer diameter of 3.5 mm and a wall thickness of 0.35 mm. Soldering of the tubular PZT with an outer diameter of 2.2 mm was achieved using silver paste. A gap between an electric wire and the PZT surface was filled with silver paste (P-100, Elcoat, Tokyo, Japan) and pressed thin. To reduce the overall size of the probe, most of the components were assembled using a high strength epoxy (KEIN 60 min), except for the gap between the hole of the hinge and the fiber (where an elastic epoxy was used). To align the center of the fiber, three-axis manual stages were utilized for precise assembly procedures. The fiber scanning range of the slow axis was about 518 μm. The final scanning range at the focal plane of the GRIN lens was measured to be 107.9 μm, due to the magnification of the GRIN lens (). Fig. 3Finite element method simulation results: (a) the location of , (21 mm, fixed); (b) lateral displacement according to ; (c) maximum stresses on fiber and hinge according to ; (d) the first-resonant frequency of fiber according to ; and (e) lateral displacement according to the thickness of the epoxy bonded between the fiber and the hinge.  3.2.Experimental Results3.2.1.Performance evaluationsAfter assembling the endoscopic probe, the characteristic of the fiber tip depending on driving frequencies was measured. Sinusoidal input voltages with an amplitude of were driven to the fast axis of the PZT actuator. Although the driving frequency changes from 32 to 160 Hz, the displacements of the fiber tip were measured by a charge-coupled device (WAT-202D, WATEC, Kawasaki, Japan). As the driving frequency of the fast axis increased, the displacement of the fiber tip gradually increased as shown in Fig. 4. The first-resonant frequency of the system can be predicted above 160 Hz from Fig. 4, which is somewhat greater than the simulation results presumably due to assembly error. It was not measured until the exact first-resonant frequency due to the worry about the collision between the fiber tip and the interior of the tubular PZT actuator (inner diameter of 1 mm). The results can be utilized to adjust the field of view of the system when the imaging speed has to be changed. Fig. 4Frequency response of the assembled endomicroscope is described. Sinusoidal voltage with the amplitude of was driven to the fast axis piezoelectric actuators. The frequency was varied from 32 to 160 Hz.  A beam splitter (BSN11, Thorlabs, Newton, New Jersey), a doublet lens (W49-356, Edmund Optics, Barrington, New Jersey), a 30-μm diameter pinhole, and a photomultiplier tube (H6779, Hamamatsu Photonics, Hamamatsu, Japan) were additionally inserted within the detection light path to obtain reflection confocal images for evaluating the scanning performances as shown in Fig. 5. The reflection image of a distortion grid target (R1L3S5P, Thorlabs) was obtained while the raster scanning pattern was achieved. As a result of the nonlinearity of the sinusoidal input signal and inherent characteristics of the PZT actuator, image distortion exists and it becomes larger at the periphery of the scanning area as shown in Fig. 5(a). Image reconstruction was conducted to compensate the image distortion by reorganizing the image data using MATLAB software (MathWorks, Natick, Massachusetts) as shown in Fig. 5(b). The same algorithm was applied to the image of a Siemens star target (R1L3S5P, Thorlabs) to show the repeatability and usefulness of the applied algorithm using the circular-symmetric target as shown in Fig. 5(c). Fig. 5Reflection images of test targets (R1L3S5P, Thorlabs): (a) image of a distortion grid with the period of 5 μm; (b) reconstructed image of (a); and (c) reconstructed image of a Siemens star target with 100-μm diameter center circle. Scale bar is 20 μm. 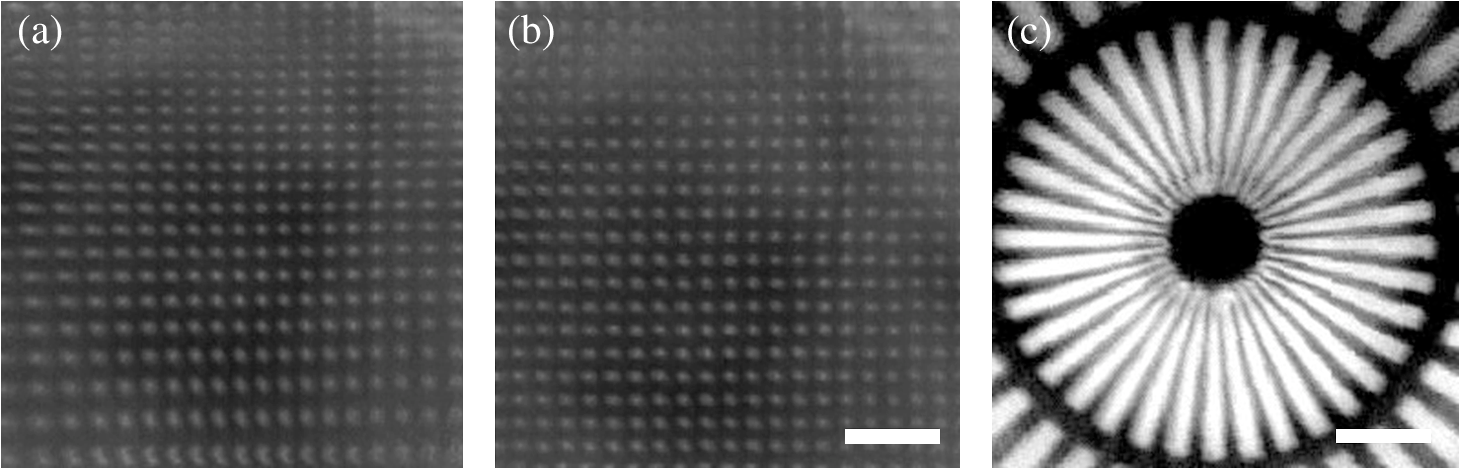 To evaluate the spatial resolution, lateral and axial full-width at half-maximum (FWHM) were measured using 170-nm diameter fluorescent beads as shown in Fig. 6. Images of the fluorescent beads of 170-nm diameter were obtained using the raster beam scanning method to measure the lateral FWHM. A PZT stage was also combined with the sample stage and the axial section image of the beads was obtained to measure the axial FWHM. The acquired images were plotted in Figs. 6(a) and 6(b) and a Gaussian fitting was applied. The lateral and axial FWHM were measured as 0.6733 and 3.095 μm, respectively. 3.2.2.ImagesWe acquired images of a test target and a biological specimen, as shown in Fig. 7. The slow axis scanned with a saw-tooth pattern instead of the sinusoidal pattern. The image acquisition time was 1.6 s with a pixel size of . A reflection image of a 1951 USAF target (R1L1S1P, Thorlabs) was obtained using the fiber raster scanning method in Fig. 7(a). The smallest pattern of the target (group 7, elements 5 and 6) was magnified two times by the partial scanning of the fiber in Fig. 7(b). The amplitudes of applied voltages to the PZT actuator were (fast axis) and (slow axis) in the case of Fig. 7(a), and (fast axis) and (slow axis) in the case of Fig. 7(b), respectively. The amplitude does not scale down linearly due to the characteristic of the PZT actuator, but the relationship between the displacement and the amplitude is sufficiently repeatable to obtain different sized images by making a look-up table. Fig. 7(a) The image of 1951 USAF test target (group 7, element 4, 5, and 6); (b) two times magnified image of (a) obtained by partial scanning; (c) the image of mouse kidney section; and (d) two times magnified image of (c) obtained by partial scanning. The lumen of the convoluted tubule is marked with yellow arrows. Scale bar is 20 μm.  To obtain two-photon fluorescence images of the biological specimen, we utilized a mouse kidney section stained with Alexa Fluor 488 wheat germ agglutinin (F-24630, Invitrogen, Carlsbad, California), a green-fluorescent lectin which binds to convoluted tubules. The fluorescence signal from the specimen was reflected at a dichroic mirror and acquired by a photomultiplier tube (H7422P-40, Hamamatsu). As a result, the convoluted tubules of the kidney are well differentiated in the image [Figs. 7(c) and 7(d)]. The lumen of the convoluted tubule was marked by a yellow arrow. An optically zoomed image [Fig. 7(d)] shows the flexible control of the field-of-view. 4.ConclusionsIn summary, we developed a nonresonant fiber-scanning endomicroscope with a tubular PZT, and demonstrated two-photon imaging of a mouse kidney. To optimize the design parameters of the endoscopic probe, we performed FEM simulations. The fiber scanning pattern was observed and demonstrated to verify a flexible field of view with orthogonal and uniform shape. Finally, we obtained reflection and two-photon images using the developed endomicroscope using a raster beam scanning of the fiber instead of a spiral or lissajous scan. For further work, a customized double clad fiber and a customized miniature lens will increase the device performance by increasing its scanning speed and light efficiency.30,31 This miniaturized endomicroscope with highly flexible control of the scanning field-of-view and speed, will allow various preclinical studies for investigating gastrointestinal diseases. AcknowledgmentsThis research was supported by a National Research Foundation of Korea (NRF) grant funded by the Korean government (NRF-2012R1A1A2041363, NRF-2013M3A6B1078883, and NRF-2009-0092825). ReferencesA. F. GmitroD. Aziz,
“Confocal microscopy through a fiber-optic imaging bundle,”
Opt. Lett., 18
(8), 565
–567
(1993). http://dx.doi.org/10.1364/OL.18.000565 OPLEDP 0146-9592 Google Scholar
W. Göbelet al.,
“Miniaturized two-photon microscope based on a flexible coherent fiber bundle and a gradient-index lens objective,”
Opt. Lett., 29
(21), 2521
–2523
(2004). http://dx.doi.org/10.1364/OL.29.002521 OPLEDP 0146-9592 Google Scholar
V. Dubajet al.,
“Optic fibre bundle contact imaging probe employing a laser scanning confocal microscope,”
J. Microsc., 207
(2), 108
–117
(2002). http://dx.doi.org/10.1046/j.1365-2818.2002.01052.x JMICAR 0022-2720 Google Scholar
Y. PanH. XieG. K. Fedder,
“Endoscopic optical coherence tomography based on a microelectromechanical mirror,”
Opt. Lett., 26
(24), 1966
–1968
(2001). http://dx.doi.org/10.1364/OL.26.001966 OPLEDP 0146-9592 Google Scholar
A. D. Aguirreet al.,
“Two-axis MEMS scanning catheter for ultrahigh resolution three-dimensional and en face imaging,”
Opt. Express, 15
(5), 2445
–2453
(2007). http://dx.doi.org/10.1364/OE.15.002445 OPEXFF 1094-4087 Google Scholar
D. T. McCormicket al.,
“A three dimensional real-time MEMS based optical biopsy system for in-vivo clinical imaging,”
in Proc. Int. Solid-State Sensors, Actuators and Microsystems Conf., 2007, TRANSDUCERS 2007,
203
–208
(2007). Google Scholar
F. Helmchenet al.,
“A miniature head-mounted two-photon microscope: high-resolution brain imaging in freely moving animals,”
Neuron, 31
(6), 903
–912
(2001). http://dx.doi.org/10.1016/S0896-6273(01)00421-4 NERNET 0896-6273 Google Scholar
J. Sawinskiet al.,
“Visually evoked activity in cortical cells imaged in freely moving animals,”
Proc. Natl. Acad. Sci. U. S. A., 106
(46), 19557
–19562
(2009). http://dx.doi.org/10.1073/pnas.0903680106 PNASA6 0027-8424 Google Scholar
C. J. Engelbrechtet al.,
“Ultra-compact fiber-optic two-photon microscope for functional fluorescence imaging in vivo,”
Opt. Express, 16
(8), 5556
–5564
(2008). http://dx.doi.org/10.1364/OE.16.005556 OPEXFF 1094-4087 Google Scholar
Y. Zhanget al.,
“A compact fiber-optic SHG scanning endomicroscope and its application to visualize cervical remodeling during pregnancy,”
Proc. Natl. Acad. Sci. U. S. A., 109
(32), 12878
–12883
(2012). http://dx.doi.org/10.1073/pnas.1121495109 PNASA6 0027-8424 Google Scholar
Z. LiZ. YangL. Fu,
“Scanning properties of a resonant fiber-optic piezoelectric scanner,”
Rev. Sci. Instrum., 82
(12), 123707
(2011). http://dx.doi.org/10.1063/1.3671290 RSINAK 0034-6748 Google Scholar
Y. Wuet al.,
“Scanning all-fiber-optic endomicroscopy system for 3D nonlinear optical imaging of biological tissues,”
Opt. Express, 17
(10), 7907
–7915
(2009). http://dx.doi.org/10.1364/OE.17.007907 OPEXFF 1094-4087 Google Scholar
D. R. Riveraet al.,
“Compact and flexible raster scanning multiphoton endoscope capable of imaging unstained tissue,”
Proc. Natl. Acad. Sci. U. S. A., 108
(43), 17598
–17603
(2011). http://dx.doi.org/10.1073/pnas.1114746108 PNASA6 0027-8424 Google Scholar
Y. ZhaoH. NakamuraR. J. Gordon,
“Development of a versatile two-photon endoscope for biological imaging,”
Biomed. Opt. Express, 1
(4), 1159
–1172
(2010). http://dx.doi.org/10.1364/BOE.1.001159 BOEICL 2156-7085 Google Scholar
M. T. MyaingD. J. MacDonaldX. Li,
“Fiber-optic scanning two-photon fluorescence endoscope,”
Opt. Lett., 31
(8), 1076
–1078
(2006). http://dx.doi.org/10.1364/OL.31.001076 OPLEDP 0146-9592 Google Scholar
J. SeibelR. S. JohnstonC. D. Melville,
“A full-color scanning fiber endoscope,”
Proc. SPIE, 6083 608303
(2006). http://dx.doi.org/10.1117/12.648030 Google Scholar
N. Zhanget al.,
“Compact piezoelectric transducer fiber scanning probe for optical coherence tomography,”
Opt. Lett., 39
(2), 186
–188
(2014). http://dx.doi.org/10.1364/OL.39.000186 OPLEDP 0146-9592 Google Scholar
K. Murariet al.,
“Lissajous scanning fiber-optic nonlinear endomicroscope with precise position calibration,”
in Proc. Biomedical Optics,
(2012). Google Scholar
C. M. Leeet al.,
“Scanning fiber endoscopy with highly flexible, 1 mm catheterscopes for wide-field, full-color imaging,”
J. Biophotonics, 3
(5–6), 385
–407
(2010). http://dx.doi.org/10.1002/jbio.v3:5/6 JBOIBX 1864-063X Google Scholar
J. SawinskiW. Denk,
“Miniature random-access fiber scanner for in vivo multiphoton imaging,”
J. Appl. Phys., 102
(3), 034701
(2007). http://dx.doi.org/10.1063/1.2763945 JAPIAU 0021-8979 Google Scholar
Z. LiL. Fu,
“Note: a resonant fiber-optic piezoelectric scanner achieves a raster pattern by combining two distinct resonances,”
Rev. Sci. Instrum., 83
(8), 086102
(2012). http://dx.doi.org/10.1063/1.4739770 RSINAK 0034-6748 Google Scholar
A. D. Aguirreet al.,
“High speed optical coherence microscopy with autofocus adjustment and a miniaturized endoscopic imaging probe,”
Opt. Express, 18
(5), 4222
–4239
(2010). http://dx.doi.org/10.1364/OE.18.004222 OPEXFF 1094-4087 Google Scholar
V. Lurquin,
“Leica solution: CARS microscopy at video rates,”
Proc. SPIE, 6860 68600O
(2008). http://dx.doi.org/10.1117/12.763083 Google Scholar
S. SeiffertW. Oppermann,
“Systematic evaluation of FRAP experiments performed in a confocal laser scanning microscope,”
J. Microsc., 220
(1), 20
–30
(2005). http://dx.doi.org/10.1111/jmi.2005.220.issue-1 JMICAR 0022-2720 Google Scholar
K. Braeckmanset al.,
“Three-dimensional fluorescence recovery after photobleaching with the confocal scanning laser microscope,”
Biophys. J., 85
(4), 2240
–2252
(2003). http://dx.doi.org/10.1016/S0006-3495(03)74649-9 BIOJAU 0006-3495 Google Scholar
M. KösterT. FrahmH. Hauser,
“Nucleocytoplasmic shuttling revealed by FRAP and FLIP technologies,”
Curr. Opin. Biotechnol., 16
(1), 28
–34
(2005). http://dx.doi.org/10.1016/j.copbio.2004.11.002 CUOBE3 0958-1669 Google Scholar
R. ForkO. MartinezJ. Gordon,
“Negative dispersion using pairs of prisms,”
Opt. Lett., 9
(5), 150
–152
(1984). http://dx.doi.org/10.1364/OL.9.000150 OPLEDP 0146-9592 Google Scholar
Y.-S. ShiueM. J. Matthewson,
“Mechanical reliability of silica optical fiber: a case study for a biomedical application,”
Proc. SPIE, 3848 115
–123
(1999). http://dx.doi.org/10.1117/12.372762 Google Scholar
J. Xiet al.,
“Integrated multimodal endomicroscopy platform for simultaneous en face optical coherence and two-photon fluorescence imaging,”
Opt. Lett., 37
(3), 362
–364
(2012). http://dx.doi.org/10.1364/OL.37.000362 OPLEDP 0146-9592 Google Scholar
Y. Zhanget al.,
“Scanning nonlinear endomicroscopy technology for intrinsic imaging of biological tissues,”
in Proc. CLEO: Applications and Technology,
(2012). Google Scholar
BiographyDukho Do received his master’s degree in mechanical engineering from Korea Advanced Institute of Science and Technology (KAIST), South Korea, in 2011. He is currently in the doctor’s course in the same institute and preparing a dissertation about design and development of multimodal endomicroscope including fluorescence lifetime imaging microscope. Hongki Yoo received his PhD degree in mechanical engineering from KAIST in 2007. Before joining the Hanyang faculty in 2012, he worked in the field of biomedical optics in Wellman Center for Photomedicine at Harvard Medical School and Massachusetts General Hospital. He is currently an assistant professor of biomedical engineering at Hanyang University. His research focuses on developing novel optical methods including confocal microscopy, OCT, fluorescence molecular imaging, and endoscopic probes to solve challenging medical problems. Dae-Gab Gweon received his PhD degree in mechanical engineering from University Stuttgart, Germany, in 1987. He is a professor in KAIST, and he is also a member of the Korea Academy of Science and Technology. His research interests include design and control of precision positioning systems, multimodal microscope systems and high-speed, high-resolution optical microscopes. He has over 185 scientific publications, 68 patents, and 78 research project results. |


