
|
|
1.IntroductionThe study of the biomechanics of tissue is an active area of research.1,2 Collagen fibers are the primary component providing structural support for most soft tissues, so observation of collagen alignment can provide insight into how tissues will behave under load and can yield clues to the overall health of the tissue.3,4 Such observations lead to a greater understanding of how tissues function in normal loading regimes and throughout damage/failure, knowledge that can be used to help speed recovery and may even be used to guide the development of engineered replacement tissues. Further, measuring the microstructural arrangement of tissues during periods of loading and rest will lead to a better understanding of the structure–function relationships of a variety of tissue types across many different organisms. A common method for evaluating collagen fiber alignment in soft tissues observes the change and direction of birefringence under different loading conditions. By illuminating thin, semi-translucent tissue sections between two rotating crossed polarizers, sets of images can be captured and analyzed to produce maps of the direction (i.e., orientation angle) and strength (i.e., relative birefringence) of collagen orientation in these tissue sections.5–7 Alternatively, the input light through the tissue may be circularly polarized, with observation through a rotating polarizer providing similar alignment and strain information.8–10 Although both techniques create high-resolution strain maps, they are unable to capture the dynamics of tissue alignment with high temporal resolution. Higher speed rotation of the filters increases the speed of image capture; however, the tissue must remain static during each rotation period to negate any misregistration error. Further, rotating analyzer polarized light techniques require careful alignment of the rotating filters, which can be a time-consuming process. In addition, current techniques are unable to perform real-time assessment of collagen alignment, as they require post hoc analysis of image sets in order to generate maps of collagen fiber orientation and corresponding angle distributions. We propose here a new method for measuring the microstructural organization in tissues, which does not suffer from these shortcomings. Our method requires only circularly polarized input light, and we use a 1-Mp division of focal plane polarimeter to make our observations in real-time, i.e., at 30 frames per second. We show that this type of sensor allows real-time capture of collagen alignment dynamics at high spatial resolutions, which will be an extremely useful tool for further studies of tissue biomechanics. Our method is quick, simple, and requires no moving optics, and thus does not require a static field-of-view during measurement. 2.Birefringence of Soft TissueThin sections of collagen tissue show greater alignment when placed under strain. Since tissue is birefringent along the direction of strain, it can be approximated as a linear retarder whose fast axis is aligned in the direction of strain. The retardation of the tissue is also proportional to the amount of strain. A simple way to measure the birefringence is to observe the tissue through crossed linear polarizers.6 Any birefringent part of the tissue introduces a phase delay between the and electric field components. This introduces an ellipticity in the polarization state, and thus illumination will appear through the set of crossed linear polarizers. This illumination through crossed polarizers disappears when the polarizers are aligned with the major or minor axis of the birefringent portions of the tissue. Thus, to find the true direction of alignment requires a rotation through 180 deg to solve the ambiguity of which rotation angle corresponds to the major and the minor axes. Using circularly polarized light as input requires rotation of only one linear polarizer (called the analyzer) and is sometimes used as an alternative.8 Mathematically, we can describe this phenomenon using the Mueller calculus shown in Eq. (1), where is the Mueller matrix for a rotation of with respect to the analyzer, and is the Mueller matrix for a retarder with retardance when aligned with the analyzer. In this equation, the optical properties of the tissue retardance are captured by the matrix. The rotation of the tissue with respect to the fast transmission axis is encapsulated by the two rotation matrices, which are used to transform the coordinate system of the retarder with respect to the observer’s coordinate system. A polarization-sensitive imaging sensor will capture the Stokes vector that emerges from this tissue (or a waveplate with retardance ) and the goal is thus to solve for this rotation angle, , and for the retardance, . Solving for these two parameters, namely and , requires multiple measurements of the Stokes parameters or , which is typically accomplished by rotating an analyzer.If both and are known, then this leads to computation of the angle of polarization (AoP), which describes the major axis of rotation of the polarized light. Equation (2) presents the necessary mathematical equations exploring the relationship between the measured AoP and the angle of alignment, . The alignment of the tissue’s fast axis is exactly 45 deg off of the measured AoP angle. Further, Eq. (3) shows that the degree of linear polarization (DoLP) is the sine of the retardance. This is because circularly polarized light has a DoLP of zero, so when the retardance is zero, the DoLP will be zero. Conversely, if the retardance is exactly 90 deg of phase, then since the input phase difference between the and components of the electric field are 90 deg apart (the definition of circular polarization), the output phase difference will be 0 deg (or 180), which makes the output light completely linearly polarized. Figure 1 provides an illustration of the optics used for light generation and analysis. Fig. 1Description of optics used for measuring the alignment of soft tissue. Input circularly polarized generated by a linear polarizer at 45 deg to the fast axis of a quarter wave plate light shines through collagen fibers. Any fiber birefringence transforms the input circularly polarized light to elliptically or linearly polarized light on the output.  Since the inverse sine of the DoLP is the retardance, the change in DoLP is proportionally related to the changes in alignment placed on the tendon, as shown in Eq. (4). As the tendon is stretched, the organization of the fibers becomes more uniformly aligned in the direction of the stretching. This causes a change in both the refractive indices () and the thickness () of the tissue sample. The increased organization will also manifest itself as a decrease in the angular standard deviation.3.Sensor Architecture and Experimental SetupUsing circularly polarized input light, a sensor that can instantaneously capture the DoLP and AoP can therefore instantaneously capture the direction and strength of collagen fiber alignment in a tissue. Since this requires capturing the first three Stokes parameters at every frame simultaneously, this necessitates at least three measurements using three different orientations of linear polarizers. A division-of-focal-plane (DoFP) polarimeter accomplishes this using pixelated linear polarization filters monolithically integrated with an array of CCD imaging elements.11 The sensor has a two by two neighborhood of pixel-matched aluminum nanowire polarizers at 0-, 45-, 90-, and 135-deg orientations. The polarizers are fabricated using interference lithography and reactive ion etching, and the nanostructures in the filter have a width of 70 nm, a pitch of 140 nm, and a thickness of 200 nm. Each of the filters is matched to the sensor pixel size of pixels and has extinction ratios on the order of 50 to 60.11 Because of this architecture, the sensor captures all the necessary information to measure the DoLP [Eq. (3)] and AoP [Eq. (2)] in a single frame. This is due to the Stokes equation [Eq. (5)], which relates the intensity , measured by an analyzer that has a linear polarizer at rotation degrees and retardance . Thus for the 0-, 45-, 90-, and 135-deg filters in the DoFP sensor used in this design, the first three Stokes parameters are computed as , , and . Once the first three Stokes parameters are computed, the DoLP and AoP are calculated, according to Eqs. (2) and (3), and thus tissue alignment is quantified within each two-by-two neighborhood of filters, called a superpixel. Our sensor is composed of a symmetric grid of 500 by 500 of these superpixels. To improve polarization accuracy, we use a per-superpixel calibration Mueller matrix.12 Since each superpixel is composed of four different pixelated polarization filters, interpolation methods are employed to regain the lost spatial resolution and improve polarization accuracy.13,14 Bicubic methods measurably improve the modulation transfer function to detect spatial features up to 75% of the full sensor resolution, while maintaining a low DoLP and AoP error when compared with an unpixelated image.15To experimentally measure fiber orientation, we used the DoFP imager with a 16-mm, fixed-focus lens (Fujinon HF16HA-1B) to view a bovine flexor tendon mounted on a computer-controlled actuator and six-degrees-of-freedom sensor stage in the setup shown in Fig. 2. We input circularly polarized light using a linear polarizer aligned at 45 deg (Gray Polarizing Film 38-491, Edmund Optics, Barrington, New Jersey) with the fast axis of an achromatic quarter wave plate (AWQP3, Bolder Vision Optik, Boulder, Colorado). We imaged a thin () section of bovine flexor tendon aligned with the camera, at to the camera, and orthogonal to the camera. Figure 3 shows the DoLP on top (a–c) and the alignment (AoP) on the bottom (d–f). The images illustrate that with a single capture, the sensor is easily capable of accurately measuring the direction and strength of alignment in the tendon specimen. Fig. 2Experimental setup to capture dynamic tissue loading, using circularly polarized input and viewing the bovine flexor tendon under measured strain with a division-of-focal-plane (DoFP) polarimeter. 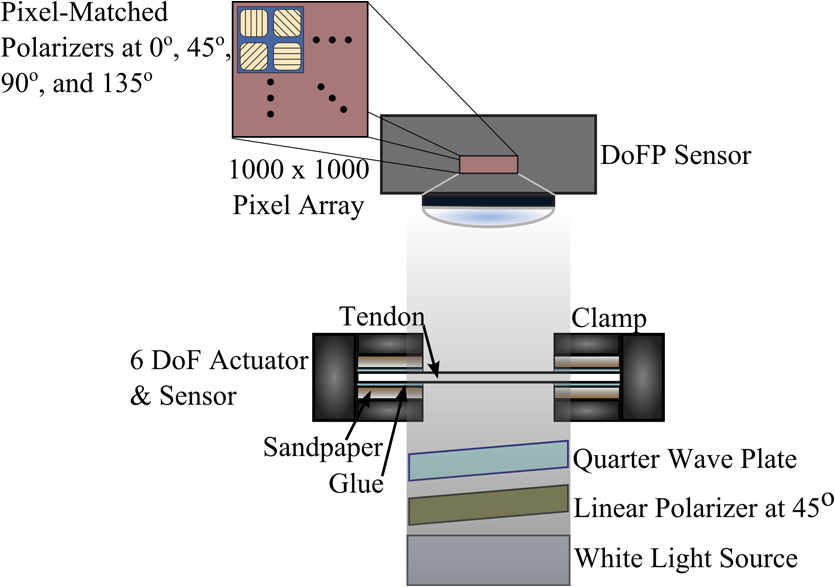 Fig. 3Tendon under load at different orientations to the sensor, degree of linear polarization (DoLP) (top, a–c), AoP (bottom, d–f). The DoLP color bars indicate linear polarization on a scale from 0 (blue) to red (0.5), while the AoP uses a cyclic color scheme to indicate the alignment angle with respect to the sensor. 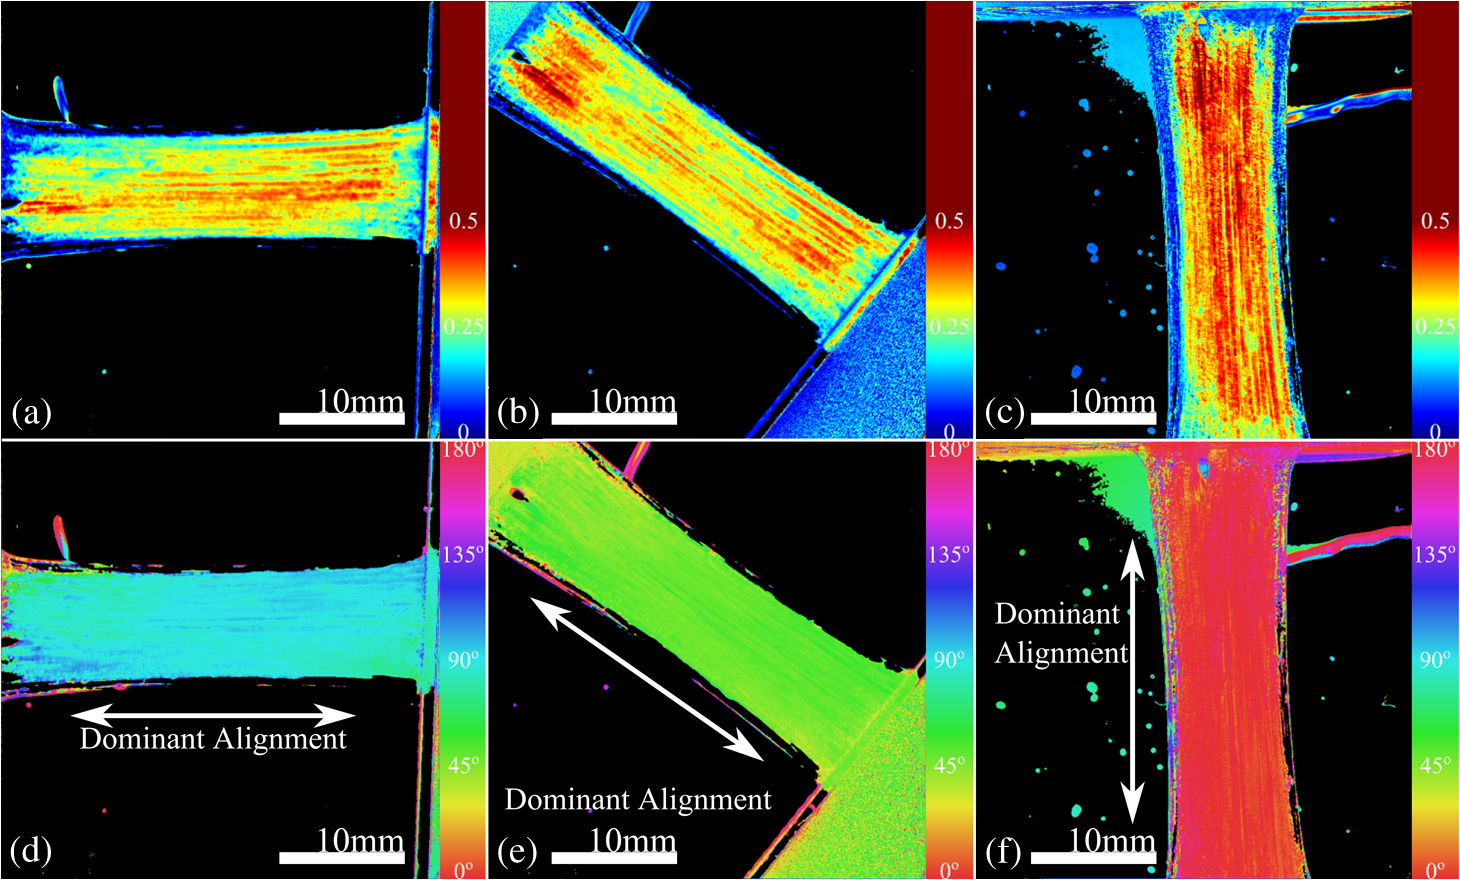 To validate the new method, we conducted a second experiment comparing our sensor to the standard method of a rotating polarization filter (i.e., n analyzer) in front of a CCD camera with the same pixel pitch as the polarization CCD camera. (Newport, Irvine, California, 20LP-VIS-B mounted on a Thorlabs (Newton, New Jersey) NR360 stage, imaged with an Imperx (Boca Raton, Florida) IGV-B1920W image sensor). Starting with a bovine flexor tendon sample subjected to a nominal preload, a step strain of 2.5% was applied and held for the duration of the measurements, where the displacement magnitude was computed relative to the gauge length of the sample (measured via digital calipers). We first imaged the tendon using the rotating polarizer in 15-deg increments and computed the DoLP and AoP (top row, Fig. 4). While applying the same strain, we then repeated the measurement using our DoFP polarization sensor (bottom row, Fig. 4). Both image sensors have the same pixel size (7.4 by 7.4 μm), and we used the same lens. The results are very similar, except for the DoLP, which is lower for the rotating polarizer. This is due to the error in using a rotating element to measure a nonstatic scene. Because of significant stress-relaxation of tendon under step-strains, the force is never constant, even over small time periods. Figure 5 shows an example, where the measured force (shown in black) is not constant in the tissue over time. Using the DoFP sensor, complete measurements of the first three Stokes parameters take place at each green time point, whereas the rotating polarizer only samples an individual angle at each red time point. At a minimum, this requires three separate rotation angles; however, significant changes in the force take place during the time of polarizer rotation. The constant downward drift results in differences which are contributed by changes in force and not by the optical properties of the tissue. Our sensor, with its fixed optics and simultaneous capture of four polarization orientations, does not suffer from this error. This also gives our sensor the ability to sample the dynamics of sudden changes in tissue strain, as in the rapid ramping of the force at the start of the test. Fig. 4Measured DoLP (a,d), AoP (b,e), and spread in alignment (c,f) using (top row) a rotating polarizer, (bottom row) DoFP polarimeter. The rotating polarizer measured a dominant alignment of 118.9 deg, with a spread of 7.05 deg, with the DoFP sensor measuring a dominant alignment of 122.9 deg and spread of 6.78 deg. 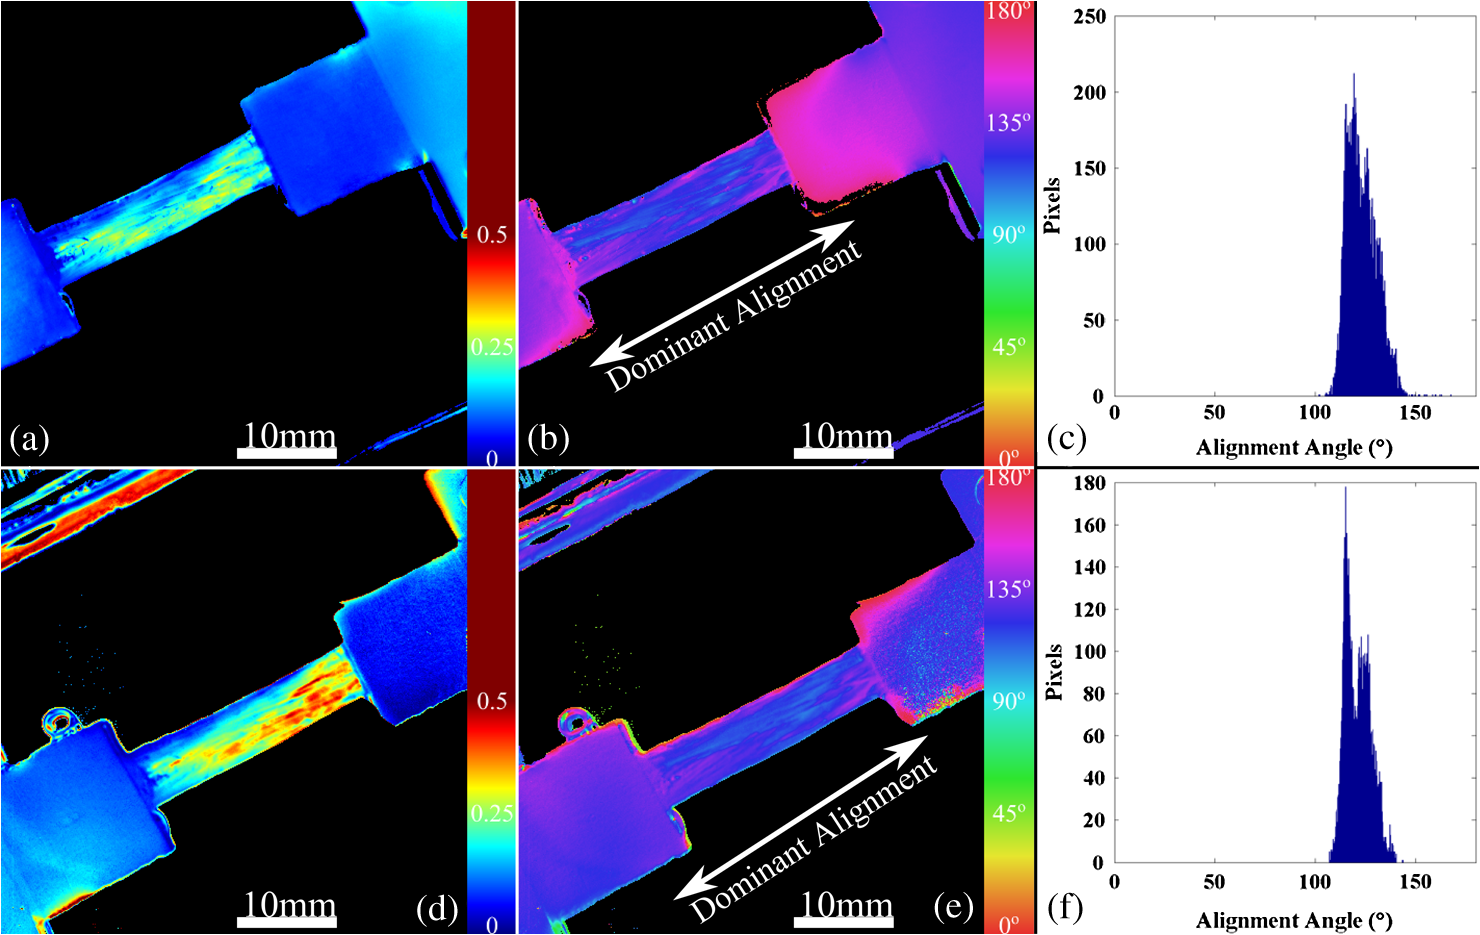 Fig. 5Time-stamped sampling of measured force sampled by the DoFP sensor (green) and rotating polarizer (red). The DoFP sensor can compute the first three Stokes parameters at every green sample point, while the rotating polarizer method requires at a minimum three red sample points. The tissue load is not static during the time taken for these samples, introducing error in measurements using a rotating polarizer.  Using the same tendon, we then used the DoFP sensor to further investigate measurement of these rapid dynamics, placing the tissue under cyclic loading conditions. We conducted three experiments, cyclically loading the tendon to between 2% and 3% strain at rates of 0.5, 1, and 2 Hz. We computed the average DoLP and spatial angular deviation of the AoP over the area of the tendon. The results show that our sensor does very well at picking up the dynamics during loading and relaxation. Figure 6(a) compares the retardance and force at 0.5 Hz, and Fig. 6(b) shows how the spread in the AoP changes during the cyclic load. Under conditions of high strain, the retardance is at the maximum, while the spread of the AoP cycles to the minimum, with the converse happening during periods of low strain. This behavior is expected, as the fibers are more aligned when pulled. Figure 7 shows the same experiment at 2 Hz, demonstrating that our sensor also captures the fiber alignment dynamics at higher loading speeds. In Video 1, we have included a sample of our system capturing the cyclic load at 2 Hz. The measurement speed is constrained only by the frame rate of the sensor (maximum frame rate of 30 frames per second), which places an upper bound on the frequency dynamics that the sensor can capture. The real-time nature of the sensor allows for a more thorough frequency analysis of the loading signals. Figure 8 shows the frequency spectrum of the force (a) and measured DoLP (b) at 2 Hz and illustrates that our sensor captures the same frequencies as the reference up to the noise floor. In this case of cyclic loading, the frequency dynamics are fairly simple, but this illustrates the ability of our sensor to enable frequency analysis of more complex loading protocols which have not been possible with the utilization of division of time polarimeters. These could be protocols with more time variance, like higher speed step forces, rapid ramps to failure, and higher rates of cyclic loading, or different directions of loading, such as biaxial tension, compression, and shear. Fig. 6Measurement of cyclic loading at 0.5 Hz showing the change in retardance (a) and alignment spread (b) measured by our sensor for the tendon compared with the reference force measurement. The retardance is maximal when the strain is maximal, while the spread in the alignment is minimal at the maximum applied strain, due to higher alignment of the fibers under strain.  Fig. 7Measurement of cyclic loading at 2 Hz showing the change in retardance (a) and alignment spread (b) measured by our sensor for the tendon compared to the reference force measurement.  Video 1Real-time measurement of retardance and alignment (MPEG 6.9 MB) [URL: http://dx.doi.org/10.1117/1.JBO.19.6.066011.1].  4.ConclusionWe have presented an imaging modality that measures the direction and strength of fiber alignment in soft tissues with both high spatial and temporal resolution. Our system uses a new type of polarimeter designed with stationary optics, which, combined with circularly polarized input, measures the retardance and alignment of tissue on a frame-by-frame, pixel-by-pixel basis. We successfully demonstrated our method on thin sections of bovine flexor tendon and showed that our sensor compares favorably with the current methodology, while providing significant additional capabilities and metrics for future analysis. AcknowledgmentsThis work is sponsored in part by grants from the by Air Force Office of Scientific Research (FA9550-10-1-0121 and FA9550-12-1-0321) and National Science Foundation (OCE 1130793) ReferencesD. L. ButlerS. A. GoldsteinF. Guilak,
“Functional tissue engineering: the role of biomechanics,”
J. Biomech. Eng., 122
(6), 570
–575
(2000). http://dx.doi.org/10.1115/1.1318906 JBENDY 0148-0731 Google Scholar
D. L. Butleret al.,
“The impact of biomechanics in tissue engineering and regenerative medicine,”
Tissue Eng. Part B Rev., 15
(4), 477
–484
(2009). http://dx.doi.org/10.1089/ten.teb.2009.0340 1937-3368 Google Scholar
Y. Fung, Biomechanics: Mechanical Properties of Living Tissues, 2nd ed.Springer-Verlag, New York
(1993). Google Scholar
J. D. Humphrey,
“Review paper: continuum biomechanics of soft biological tissues,”
Proc. R. Soc. Lond. Ser. Math. Phys. Eng. Sci., 459
(2029), 3
–46
(2003). http://dx.doi.org/10.1098/rspa.2002.1060 PRLAAZ 1364-5021 Google Scholar
J. P. Dickeyet al.,
“Measuring collagen fiber orientation: a two-dimensional quantitative macroscopic technique,”
J. Biomech. Eng., 120
(4), 537
–540
(1998). http://dx.doi.org/10.1115/1.2798026 JBENDY 0148-0731 Google Scholar
S. Thomopouloset al.,
“Variation of biomechanical, structural, and compositional properties along the tendon to bone insertion site,”
J. Orthop. Res., 21
(3), 413
–419
(2003). http://dx.doi.org/10.1016/S0736-0266(03)0057-3 JOREDR 0736-0266 Google Scholar
S. P. Lakeet al.,
“Effect of fiber distribution and realignment on the nonlinear and inhomogeneous mechanical properties of human supraspinatus tendon under longitudinal tensile loading,”
J. Orthop. Res., 27
(12), 1596
–1602
(2009). http://dx.doi.org/10.1002/jor.20938 JOREDR 0736-0266 Google Scholar
T. TowerM. NeidertR. Tranquillo,
“Fiber alignment imaging during mechanical testing of soft tissues,”
Ann. Biomed. Eng., 30
(10), 1221
–1233
(2002). http://dx.doi.org/10.1114/1.1527047 ABMECF 0090-6964 Google Scholar
K. P. QuinnB. A. Winkelstein,
“Altered collagen fiber kinematics define the onset of localized ligament damage during loading,”
J. Appl. Physiol., 105
(6), 1881
–1888
(2008). http://dx.doi.org/10.1152/japplphysiol.90792.2008 JAPYAA 0021-8987 Google Scholar
S. LakeV. Barocas,
“Mechanical and structural contribution of non-Fibrillar matrix in uniaxial tension: a collagen-agarose co-gel model,”
Ann. Biomed. Eng., 39
(7), 1891
–1903
(2011). http://dx.doi.org/10.1007/s10439-011-0298-1 ABMECF 0090-6964 Google Scholar
V. GruevR. PerkinsT. York,
“CCD polarization imaging sensor with aluminum nanowire optical filters,”
Opt. Express, 18
(18), 19087
–19094
(2010). http://dx.doi.org/10.1364/OE.18.019087 OPEXFF 1094-4087 Google Scholar
S. B. PowellV. Gruev,
“Calibration methods for division-of-focal-plane polarimeters,”
Opt. Express, 21
(18), 21039
–21055.
(2013). http://dx.doi.org/10.1364/OE.21.021039 OPEXFF 1094-4087 Google Scholar
X. Xuet al.,
“A correlation-based interpolation algorithm for division-of-focal-plane polarization sensors,”
Proc. SPIE, 8364 83640L
(2012). http://dx.doi.org/10.1117/12.919196 PSISDG 0277-786X Google Scholar
S. GaoV. Gruev,
“Gradient-based interpolation method for division-of-focal-plane polarimeters,”
Opt. Express, 21
(1), 1137
–1151
(2013). http://dx.doi.org/10.1364/OE.21.001137 OPEXFF 1094-4087 Google Scholar
S. GaoV. Gruev,
“Bilinear and bicubic interpolation methods for division of focal plane polarimeters,”
Opt. Express, 19
(27), 26161
–26173
(2011). http://dx.doi.org/10.1364/OE.19.026161 OPEXFF 1094-4087 Google Scholar
BiographyTimothy York is a PhD candidate in computer engineering at Washington University in St. Louis. He received his BSEE and MSEE from Southern Illinois University Edwardsville in 2002 and 2007, respectively. He worked as a computer engineer for the United States Air Force from 2006 to 2009. His current work focuses on polarization image sensors and their applications, especially in the field of biomedical imaging. He is a member of SPIE and IEEE. Lindsey Kahan is an undergraduate at Washington University in St. Louis studying mechanical engineering and materials science. Spencer P. Lake is an assistant professor in mechanical engineering and materials science, biomedical engineering and orthopaedic surgery at Washington University in St. Louis. He has a PhD in bioengineering from the University of Pennsylvania and directs the Musculoskeletal Soft Tissue Laboratory. His research focuses on biomechanics of soft tissues, with particular interest in the structure-function relationships of orthopaedic connective tissues. Viktor Gruev received his MS and PhD degrees in electrical and computer engineering from Johns Hopkins University, Baltimore, in May of 2000 and in September of 2004, respectively. After finishing his doctoral studies, he was a postdoctoral researcher at the University of Pennsylvania. Currently, he is an associate professor in the Department of Computer Science and Engineering at Washington University in St. Louis. His research interests include imaging sensors, polarization imaging, and micro/nano fabrication. |


