|
|
1.IntroductionBecause of its sensitivity and specificity, molecular imaging has been extensively studied in biomedical research and applications.1,2 In molecular imaging, either endogenous molecules or exogenous probes can be used to visualize and quantify biological states and processes in living systems. In this context, nanoparticles are very attractive as exogenous probes, as they are being developed with various desirable properties.2–5 When specific ligands are conjugated to nanoparticles, a binding capability is acquired for corresponding biomarkers. These nanocarriers can penetrate through microvessels and are taken up by cells, offering highly selective payload accumulation at a specific region of interest (ROI).6 Different types of nanoparticles have been synthesized and evaluated for medical imaging and drug delivery. Nanophosphors of high-density luminescent materials provide high contrast and absorption for x-rays. The nanophosphors can be doped with a variety of ions (rare earth and transition metal) to emit near-infrared (NIR) or visible light upon x-ray excitation and can be functionalized using methods similar to those used with traditional reporters (e.g., organic dyes) to create molecular imaging agents.7,8 Using nanophosphors, x-ray luminescence computed tomography (XLCT) was reported based on the first generation computed tomography scanning mode.9 The combination of x-ray excitation and optical detection enables better localization of luminescence emitters than a traditional optical scheme (e.g., bioluminescence and fluorescence imaging). The relatively straight propagation of x-rays in a biological object means a deep penetrating capability and an improved tomographic resolution. However, due to mechanical limitations of a pin-hole collimator and the diffraction effect of x-rays, this imaging method cannot achieve micron-scale resolution. To address this problem, we recently developed an x-ray micromodulated luminescence tomography (XMLT) approach.10 Although XLCT manipulates x-rays by collimating x-ray photons, XMLT modulates x-rays by focusing x-ray waves. In an initial simulation study on XMLT, a zone plate was used as a focusing element. However, the efficiency of the zone plate is low, making the imaging time rather long. In this article, we propose to use dual-cone geometry for microfocused x-ray excitation of a three-dimensional (3-D) distribution of nanophosphors in a biological sample or a small animal. Using a polycapillary lens, divergent x-rays can be redirected onto a focal spot of a few micrometers in size, maximizing the intensity of x-ray energy at the vertex point of a double-cone beam. Measurement of the photon fluence on the object surface mainly reflects the optical emission at the vertex point, which is determined by the concentration distribution of nanophosphors. This imaging mode can resolve nanophosphors targeting to specific cellular features of a few microns in size and overcome the imaging depth limit of existing microscopic imaging methods. In Sec. 2, we describe a system design, an imaging model, and an image reconstruction algorithm. In Sec. 3, we report realistic numerical simulation results. In Sec. 4, we discuss relevant issues and conclude the article. 2.Methodology2.1.Dual-Cone X-ray ExcitationOur proposed imaging system consists of a microfocus x-ray source, a polycapillary lens, and an electron multiplying charge coupled device (EMCCD) camera. All the components are integrated on an optical table in a light-proof box made of aluminum posts and blackened panels. The x-ray source is mounted on a horizontally motorized linear stage for adjustment of a focal plane. The EMCCD camera is mounted to acquire optical signals on the surface of the object. The polycapillary lens bends an incoming x-ray beam onto a focal spot to form double-x-ray cone beams with the focal spot as the common vertex. When the focused x-ray cone irradiates a biological sample or a small animal that contains a nanophosphor distribution, the nanophosphors are excited to emit NIR or visible light. The resultant optical signals are captured by the EMCCD camera. The object is fixed on a stage attached to a combination of linear stages to perform point-by-point scanning in 3-D. From the measured optical data on the object surface, the image reconstruction is performed to localize and quantify the distribution of nanophosphors. A lens element is required to focus an x-ray beam and form the requisite double-cone geometry. A Fresnel zone plate is one such focusing element, but it is of low efficiency and restricted to work with nearly monochromatic beams such as that produced by a synchrotron source.11 Most of the readily available sources generate x-rays by accelerating electrons into high- metal targets. X-rays are produced which have a broad spectrum due to bremsstrahlung and characteristic emission. To use these x-rays efficiently, an achromatic lens element, such as the polycapillary optics shown in Fig. 1, is preferred to form double cones of x-rays for excitation of nanophosphors. The polycapillary lens is composed of a large number of hollow glass fibers bound in a lenticular shape. Although not a true imaging optics as the output spot size is independent of the source size, it does capture photons from an x-ray source within a fixed solid angle and send them to a small focal spot. Thus, this arrangement defines a vertex in focus extended into two cones in opposite directions along a principal imaging axis. Several design options are possible with the main trade-offs among beam energy, working distance, and focal spot size. For example, for a 17.4-keV x-ray source () a focal distance of 20 mm from the lens yields a 45-μm spot in an object. A dual-cone beam with a half angle of nearly 10 deg can be achieved at a focal distance of 9 mm with a 25-μm spot size in the object. If necessary, increasing the beam energy will further extend the focal distance, as the critical angle shifts with x-ray energy. Table 1 summarizes the operating options. Table 1Options for commercial polycapillary optics.
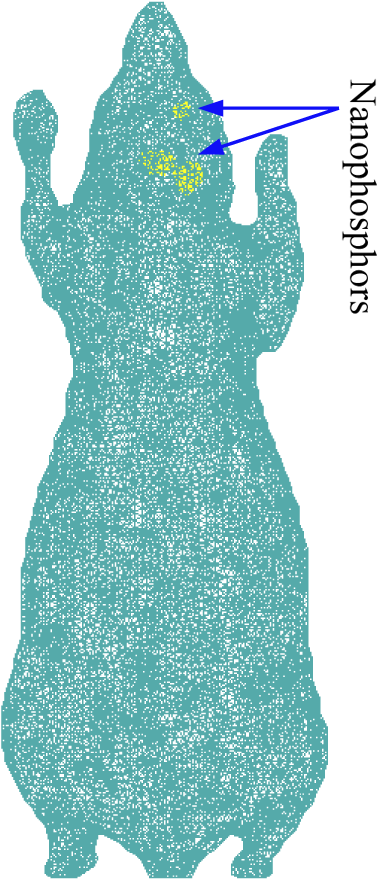
2.2.Imaging ModelThe propagation of light through biological tissues is a complex process, which involves both absorption and scattering simultaneously. A light propagation model describes the interaction of photons with scattering and absorbing media and is essential for optical tomographic imaging. The diffusion approximation (DA) works well in weakly absorbing and highly scattering media, but would break down with strong absorbers, near sources, and across boundaries. Hence, DA only fits really well for large biological samples (). Without such limitations, the radiative transfer equation (RTE) is an accurate model for photon propagation and can be solved in Monte Carlo simulation or with a numerical solution at a higher computational cost. Based on DA or RTE model, we can express photon fluence rates on an object surface in terms of a Green function:12,13 where is a region of interest (ROI), is a positional vector, is a photon fluence rate at a location (), and is the intensity of a NIR light source () in an object. The intensity of NIR light emitted from nanophosphors is related to the nanophosphor concentration to be reconstructed, the x-ray intensity distribution in the object, and the NIR light yields of the nanophosphors which can be defined as the quantum yield per unit nanophosphor concentration:9For nanophosphor imaging, a polycapillary lens is placed in front of an x-ray source to focus x-rays to a focal spot, forming double cones with their shared vertex inside the object, as shown in Fig. 1. Several options for x-ray focusing have already been presented in Sec. 2.1. The focus spot size is the key to define the intrinsic spatial resolution of this nanophosphor imaging scheme. The polycapillary lens mostly puts x-ray energy around the focal point. For biological soft tissues, an x-ray intensity distribution in the double cones can be calculated with inverse distance weighting, , where is the common vertex of the double cones, is the intensity of the x-ray source, and is the corresponding aperture function of the double cones with the vertex . The acquired data by the EMCCD camera at each exposure time mainly reflects the NIR emission around the focal point. All the NIR photons on the surface of the object measured by the EMCCD camera can be summed up to give a single reading: The left hand side of Eq. (3) is the total photon fluence rate at each exposure time, and the right hand side of Eq. (3) is the convolution of the nanophosphor concentration distribution and the x-ray intensity distribution. To perform reconstruction of a nanophosphor distribution, the focal point of the x-ray double cones is scanned over all grid points in an ROI. In this way, we obtain a sufficient amount of information for ROI-based image reconstruction. Specifically, the measured photon fluence rates yield a system of linear integral equations based on Eq. (3) that can be solved for image reconstruction. Outperforming the fluorescence/bioluminescence tomography models, the tomographic imaging model Eq. (3) is well posed and allows an accurate and stable image reconstruction. 3.Numerical SimulationIn this section, we used a digital mouse model to evaluate the reconstruction quality of a nanophosphor distribution. The mouse model was discretized into 203,690 tetrahedral elements with 58,244 nodes, as shown in Fig. 2. The DA model can be employed to describe the NIR light transport process. where is a positional vector, a NIR photon fluence rate, is an NIR source, is the absorption coefficient, is the diffusion coefficient defined by , is the reduced scattering coefficient, and is an object support. If no photon travels across the boundary into the tissue domain , the DA is constrained by the Robin boundary condition14 where is an outward unit normal vector on , and a boundary mismatch factor. The boundary mismatch factor between the tissue with a refractive index and air can be approximated by with (Ref. 14). Thus, the measurable exiting photon flux on the surface of the animal can be expressed asEquations (4) and (5) can be discretized into a matrix equation linking the nanophosphor distribution and the NIR photon fluence rate at every node via finite element analysis:15,16 where the components of the matrix are and the components of the matrix are where are the element shape functions. Since the matrix in Eq. (7) is positive definite, we haveIn our simulation, we assumed that the polycapillary lens generated double cones of a 19.2-deg angle. Upon x-ray irradiation through nanophosphors (spinel structure), an intense photoluminescence signal was induced, peaking at 716 nm ( R-line emission; spin forbidden emission transition). The nanophosphors were mainly distributed in the mouse brain, where three subregions, centered on (17.5, 12.5, 12.0), (19.0, 18.0 12.0), and (16.0, 19.0, 12.0) mm, contained nanophosphor concentrations of 1, 4, and respectively, as shown in Fig. 2. The nanophosphor concentrations differed up to ten times in terms of concentrations to test contrast resolution. Two subregions had a 50-μm separation to test the spatial resolution. The intensity of the NIR light on the body surface was simulated according to the DA model. Poisson noise was added to the synthetic data to simulate an experimental environment. In a real in vivo experiment, although the body surface of a mouse is rather arbitrary, a triangular mesh can be constructed to accurately represent the complex geometry. The measured intensity of the NIR light can be mapped via interpolation onto the corresponding triangular elements on the body surface. Based on Eqs. (3) and (10), we have where is the index for measured surface nodes. The x-ray double-cone excitation was implemented to cover all the nodes in the in the animal. Based on Eqs. (5), (6), and (11), a linear equation system was established with simulated NIR intensity data on the body surface: where is the vector of the photon fluence rates from a series of double-cone x-ray excitations, and is a weighting matrix from Eq. (3). The NIR light yield of the nanophosphors was assumed to be for 17.4-kev x-rays. The proposed reconstruction method was applied to estimate the nanophosphor distribution from the simulated dataset.The results show that the reconstructed nanophosphor concentrations were in excellent agreement with the true counterparts, and the average relative error of the reconstructed nanophosphor concentration was less than 5%, which was defined as , where represents the total number of the elements in the set , is a noise level, and and are the true and reconstructed concentrations of each nanophosphor cluster, respectively. Figure 3 compares the true and reconstructed nanophosphor clusters, showing the quantification accuracy of the reconstruction method. The numerical simulation also indicates that the minimal detectable concentration of nanophosphors is about , whereas the maximum nanophosphor concentration is . Fig. 3X-ray micro-modulated luminescence tomography in dual-cone geometry. (a–c) The true nanophosphor distributions at , 12, and 12.7 mm, respectively, in the mouse model, (d–f) the reconstructed nanophosphor distributions at the corresponding slides. With a minimal seperation of 50 μm among the three subregions, the reconstructed images suggest that the nanophosphor-labeled features can be accurately imaged.  4.Discussions and ConclusionThe major challenge in optical molecular tomography is improving the accuracy and stability of image reconstruction that has been severely limited by strong diffusion of light photons in biological tissue. Fluorescence/bioluminescence tomography cannot yield an image reconstruction with sufficiently high resolution and contrast. The fundamental reason lies in the data acquisition process, i.e., the acquired dataset from the mouse body surface depicts a two-dimensional (2-D) view characteristic of light diffusion, whereas the molecular probe distribution to be reconstructed is in a 3-D space. This inherent gap leads to nonunique solutions and substantial reconstruction errors which are made worse by measurement noise and optical parameter mismatch. The use of an x-ray beam to excite the optical signal provides a well-defined excitation region which informs the 3-D reconstruction of a probe distribution from collected 2-D data. Furthermore, by using a polycapillary lens, x-rays can be focused within the biological specimen, reducing the excitation volume, and greatly improving spatial resolution. The proposed imaging modality uses an x-ray dual-cone excitation in a point-wise scanning mode. The photon fluence rate on the object surface mainly reflects the light emission and nanophosphor concentration at the current vertex, and the image reconstruction algorithm can get rid of the ill-posedness of popular optical tomographic problems. Different from the pinhole-based x-ray excitation mode adopted for XLCT, which suffers from mechanical limits of a pin-hole collimator and the diffraction effect of x-rays, the proposed method promises significantly higher resolution than that of XLCT, aided by an x-ray focusing element such as a polycapillary lens. However, due to the use of the point-wise scanning mode, the imaging time would be much longer than that of fluorescence/bioluminescence tomographic imaging. For example, to reconstruct a nanophosphors distribution over a small ROI such as a mesh with a resolution of 50 μm, the imaging time would take hours per image. Nevertheless, this problem can be addressed in different ways. For example, we could use 2-D x-ray gratings to form a 2-D array of focal spots and accelerate the data acquisition process dramatically. We are exploring along this direction, which is beyond the scope of this article. In conclusion, we have proposed a new imaging method to localize and quantify a nanophosphor distribution in a biological sample or a small animal by coupling microfocused x-rays and nanophosphors. Using a polycapillary lens, novel dual-cone excitation geometry has been introduced and evaluated. By point-by-point scanning, the acquired photon intensity information on the object surface sufficiently reflects an underlying nanophosphor distribution, allowing a microscale spatial resolution and much-improved imaging depth. This imaging modality may find multiple preclinical applications and beyond. AcknowledgmentsThis work was partially supported by the National Institutes of Health Grant NIH/NHLBI HL098912, and the National Science Foundation (NSF) under Grants CMMI-1229405, DMS-1301646, and DMR-0955908. ReferencesC. J. Sunderlandet al.,
“Targeted nanoparticles for detecting and treating cancer,”
Drug Dev. Res., 67
(1), 70
–93
(2006). http://dx.doi.org/10.1002/(ISSN)1098-2299 DDREDK 1098-2299 Google Scholar
X. H. Gaoet al.,
“In vivo cancer targeting and imaging with semiconductor quantum dots,”
Nat. Biotechnol., 22
(8), 969
–976
(2004). http://dx.doi.org/10.1038/nbt994 NABIF9 1087-0156 Google Scholar
V. Ntziachristoset al.,
“Looking and listening to light: the evolution of whole-body photonic imaging,”
Nat. Biotechnol., 23
(3), 313
–320
(2005). http://dx.doi.org/10.1038/nbt1074 NABIF9 1087-0156 Google Scholar
X. M. Qianet al.,
“In vivo tumor targeting and spectroscopic detection with surface-enhanced Raman nanoparticle tags,”
Nat. Biotechnol., 26
(1), 83
–90
(2008). http://dx.doi.org/10.1038/nbt1377 NABIF9 1087-0156 Google Scholar
R. WeisslederV. Ntziachristos,
“Shedding light onto live molecular targets,”
Nat. Med., 9
(1), 123
–128
(2003). http://dx.doi.org/10.1038/nm0103-123 1078-8956 Google Scholar
L. Fass,
“Imaging and cancer: a review,”
Mol. Oncol., 2
(2), 115
–52
(2008). http://dx.doi.org/10.1016/j.molonc.2008.04.001 2052-9635 Google Scholar
F. Liuet al.,
“Photostimulated near-infrared persistent luminescence as a new optical read-out from Cr(3)(+)-doped LiGa(5)O(8),”
Sci. Rep., 3 1554
(2013). http://dx.doi.org/10.1038/srep01554 SRCEC3 2045-2322 Google Scholar
Z. PanY. Y. LuF. Liu,
“Sunlight-activated long-persistent luminescence in the near-infrared from Cr(3+)-doped zinc gallogermanates,”
Nat. Mater., 11
(1), 58
–63
(2012). http://dx.doi.org/10.1038/nmat3173 NMAACR 1476-1122 Google Scholar
G. Pratxet al.,
“X-ray luminescence computed tomography via selective excitation: a feasibility study,”
IEEE Trans. Med. Imaging, 29
(12), 1992
–1999
(2010). http://dx.doi.org/10.1109/TMI.2010.2055883 ITMID4 0278-0062 Google Scholar
W. Conget al.,
“X-ray micro-modulated luminescence tomography (XMLT),”
Opt. Express, 22
(5), 5572
–5580
(2014). http://dx.doi.org/10.1364/OE.22.005572 OPEXFF 1094-4087 Google Scholar
P. J. Withers,
“X-ray nanotomography,”
Mater. Today, 10
(12), 26
–34
(2007). http://dx.doi.org/10.1016/S1369-7021(07)70305-X MATOBY 0096-4867 Google Scholar
J. ChenQ. FangX. Intes,
“Mesh-based Monte Carlo method in time-domain widefield fluorescence molecular tomography,”
J. Biomed. Opt., 17
(10), 106009
(2012). http://dx.doi.org/10.1117/1.JBO.17.10.106009 JBOPFO 1083-3668 Google Scholar
G. Wanget al.,
“In vivo mouse studies with bioluminescence tomography,”
Opt. Express, 14
(17), 7801
–7809
(2006). http://dx.doi.org/10.1364/OE.14.007801 OPEXFF 1094-4087 Google Scholar
M. Schweigeret al.,
“The finite-element method for the propagation of light in scattering media—boundary and source conditions,”
Med. Phys., 22
(11), 1779
–1792
(1995). http://dx.doi.org/10.1118/1.597634 MPHYA6 0094-2405 Google Scholar
W. Conget al.,
“Practical reconstruction method for bioluminescence tomography,”
Opt. Express, 13
(18), 6756
–6771
(2005). http://dx.doi.org/10.1364/OPEX.13.006756 OPEXFF 1094-4087 Google Scholar
W. CongH. ShenG. Wang,
“Spectrally resolving and scattering-compensated x-ray luminescence/fluorescence computed tomography,”
J. Biomed. Opt., 16
(6), 066014
(2011). http://dx.doi.org/10.1117/1.3592499 JBOPFO 1083-3668 Google Scholar
BiographyGe Wang, PhD in ECE, is Clark & Crossan endowed chair professor and director of Biomedical Imaging Center, Rensselaer Polytechnic Institute, Troy, New York, USA. His expertise includes x-ray computed tomography (CT), optical molecular tomography, and omni-tomography. He wrote the first paper on spiral/helical multi-slice/cone-beam CT, which is now a main mode of CT scanners with 100-million multi-slice/cone-beam scans annually performed worldwide. He is fellow of IEEE, SPIE, OSA, AIMBE, and AAPM. |