
|
|
1.IntroductionElastography is an imaging technique that maps variations in tissue stiffness into images, known as elastograms.1 As tissue stiffness is often closely linked with pathology,2 elastography has been developed to aid in the diagnosis of disease.3 Optical coherence tomography (OCT)-based elastography, known as optical coherence elastography (OCE), is an emerging technique that provides higher spatial resolution than more established techniques based on ultrasound and magnetic resonance imaging (MRI).4,5 Over the last decade, advances in OCT technology, particularly the emergence of spectral-domain OCT, have provided opportunities to make significant improvements in OCE elastogram quality5 over earlier time-domain OCT systems.4,6–10 Proposed OCE techniques have been based on a variety of loading methods, including compression,11–17 surface acoustic wave and shear wave generation,18–21 internal loading using magnetic nanoparticles,22,23 and acoustic radiation force.24–27 The use of OCE is being explored in a range of potential clinical applications, particularly in breast cancer,16,28,29 dermatology,30–33 ophthalmology,20,21,34,35 and cardiology.6–8,25,36,37 Recently, several groups have extended OCE to three-dimensional (3-D) imaging.16,24,25,33 Assessment of tissue volumes is likely to be a key feature in clinical applications of OCE, as is proving to be the case in OCT,38 and emulates 3-D medical imaging techniques such as MRI39 and computed tomography (CT).40 An additional feature, of particular importance in compression OCE, is that 3-D imaging allows elastograms to be visualized in the en face plane, with resolution matched to that of the underlying OCT image.5 Previously reported 3-D-OCE methods have been limited to long acquisition times. In the first demonstration, in vivo 3-D elastograms of human skin were acquired in 5 min.33 More recently, 3-D OCE was demonstrated on excised human coronary artery,25 with a B-scan acquisition time of 0.1 s, implying a 3-D-OCE scan consisting of 500 B-scans was acquired in 50 s. Such long acquisition times are likely to restrict the application of 3-D OCE in many clinical and in vivo applications. Here, we demonstrate a new acquisition method for compression 3-D OCE, which allows volumes (-dimensions, ) to be acquired in 5 s, at least 10 times faster than that reported using existing 3-D-OCE methods. Although previous methods determine the phase difference between A-scans41 or B-scans,12,13,16 our method is based on phase-sensitive detection between volumes (C-scans). A compressive load is imparted between consecutive C-scan acquisitions and the phase difference is calculated between the volumes. We show that the displacement and strain sensitivity of our C-scan method are comparable to the existing B-scan method5,13,16 and present sub-100-microstrain sensitivity, high-contrast, single-acquisition elastograms generated by compression 3-D OCE of structured phantoms and rat skeletal muscle. 2.MethodsThe OCE system is based on an optical fiber-based, spectral-domain OCT system with maximum A-scan rate of 100 kHz and a measured sensitivity of 98 dB for an exposure time of 5 μs used in all measurements reported here. The system employs a superluminescent diode with a central wavelength, , of 835 nm and a 3-dB bandwidth of 50 nm. The measured axial and lateral resolutions in air (full-width at half-maximum of irradiance) are 8.5 and 11 μm, respectively. The sample arm comprises an imaging window fixed to a ring actuator, as described previously,13,31,42 enabling mechanical loading and imaging from the same side of the sample. An upper brass plate with a surface area of was used to apply a preload to ensure that the sample surface was evenly loaded before 3-D-OCE scanning. A square-wave electrical signal was used to drive the ring actuator motion and was synchronized with either the B-scan or C-scan acquisition, as illustrated in Fig. 1. Using this setup, a maximum displacement of 2 μm could be applied to the sample surface. The depth-resolved axial displacement was determined at each lateral position by calculating the phase difference, , at each point between loaded, , and unloaded, , B-scan or C-scan pairs, as shown in Fig. 1, and by performing phase unwrapping to remove the phase ambiguity.16 The local strain was calculated as the slope of axial displacement, , over a finite axial range depth using a weighted-least squares fitting algorithm described previously.13 In the elastograms presented here, the axial fitting range, which we define as the strain axial resolution, is 100 μm, and the strain lateral resolution matches that of the underlying OCT system, i.e., 11 μm. Fig. 1Schematic diagram illustrating phase-sensitive detection using (a) the B-scan method16 and (b) the C-scan method; (c) and (d) illustrations of the synchronization between lateral (- and -) scanning and mechanical loading for each method.  In the B-scan 3-D-OCE method,16 oversampling was performed: an OCT B-scan comprising 1000 A-scans was acquired for every 1 μm scanned in the lateral (-) direction. Although this sampling results in additional phase noise, it is a convenient means of ensuring sufficiently small -direction offsets between scans to enable effective phase-sensitive detection.43 The B-scan acquisition (indicated by “-scanning” in Fig. 1) was synchronized with the mechanical loading [Figs. 1(a) and 1(c)], ensuring that consecutive B-scans were acquired in alternate loading states. To scan a volume, 5000 B-scans (2500 unloaded and 2500 loaded) were acquired. The A-scan acquisition time was 100 μs (B-scan acquisition time, 0.1 s) and the loading frequency was 5 Hz, resulting in a total acquisition time of 500 s. In this method, the dependency of B-scan acquisition frequency on mechanical loading frequency [Fig. 1(c)] and the requirement of quasistatic loading, fundamentally limit the 3-D-OCE acquisition speed to this relatively long acquisition time. The condition of quasistatic loading requires that the loading frequency is low enough () that inertial components in the governing equations of motion can be ignored.1 Quasistatic loading is a requirement in compression OCE, as it removes the need to consider mechanical wave propagation in the sample, allowing local strain to be used as a contrast mechanism.1,5 In the C-scan method, the acquisition was synchronized with the mechanical loading [Figs. 1(b) and 1(d)], ensuring that consecutive C-scans were acquired in alternate loading states [Fig. 1(b)]. As no oversampling was required, the C-scan method required less densely sampled acquisition. Each C-scan comprised 500 B-scans and, in turn, each B-scan comprised 500 A-scans. The OCT acquisition times were 10 μs for an A-scan, 5 ms for a B-scan, and 2.5 s for a C-scan, thus, the total acquisition time for 3-D OCE was 5 s. Because the B-scan acquisition is decoupled from the loading frequency, the acquisition speed is greatly increased, while quasistatic loading is maintained. To compare the strain sensitivity and elastogram quality of the two methods, two cylindrical tissue-mimicking phantoms with a diameter and thickness of 15 and 2 mm, respectively, were fabricated using silicone elastomers, as described previously.44,45 Optical scattering in the phantoms was introduced using titanium dioxide particles (refractive index , mean diameter ). The Young’s modulus of the phantoms was controlled by varying the ratio of silicone, the associated curing agent, and non-cross-linked silicone oil and was measured using compression testing.45 Phantom 1 is optically and mechanically homogeneous and was used to determine the strain sensitivity. The scatterer concentration is and the Young’s modulus is 20 kPa. Phantom 2 was used to compare the elastogram quality of the two methods. This phantom consists of a soft bulk medium (scatterer concentration , Young’s modulus 20 kPa) within which an approximately cuboid stiff inclusion (scatterer concentration , Young’s modulus 837 kPa) is embedded. 3.ResultsTo compare the performance of each method, we first define the displacement sensitivity as the standard deviation, , of 50 displacement measurements acquired from the same location on the surface of a stationary layered adhesive tape phantom. The chosen location had a corresponding OCT signal-to-noise ratio (SNR) of . In Fig. 2, histograms of the displacements measured using the B-scan [Fig. 2(a)] and C-scan [Fig. 2(b)] methods are shown. The corresponding displacement sensitivity, calculated as the standard deviation, is 0.63 and 0.86 nm, respectively (as shown in Table 1), corresponding to respective phase sensitivities of 13.3 and 18.1 mrad. The slightly lower displacement and phase sensitivities of the C-scan method are likely due to the small positioning error of the -scanning galvanometer mirror between C-scan acquisitions. In the C-scan method, phase drift in the interferometer caused by environmental conditions may also lower the displacement sensitivity, although this effect is expected to be small for the short acquisition times used here. Fig. 2Histogram of 50 displacement measurements obtained from adjacent lateral locations at the same depth near the surface of a stationary adhesive tape phantom for (a) the B-scan method and (b) the C-scan method.  Table 1Displacement sensitivity, strain sensitivity, and acquisition time of 3-D-OCE scans using the B-scan and C-scan methods.
Next, the strain sensitivity of both methods was determined using Phantom 1. The phantom was preloaded by translating the upper brass plate from the point of first contact with the phantom ( strain). Following preload, a delay of at least 1 min was allowed to ensure the effects of viscoelastic creep had subsided. An additional periodic displacement of 2 μm was then imparted with the ring actuator and the local strain was calculated as described above. We define the strain sensitivity, , as the standard deviation of local strain calculated from 50 local strain measurements at adjacent lateral positions in the central region of the phantom.13 The measured strain sensitivity of the B-scan and C-scan methods, as shown in Table 1, is 85 and 90 με, respectively. The strain sensitivity was determined from strain measurements over 100 μm, commencing at 20 μm from the phantom surface. The results in Fig. 2 and Table 1 demonstrate that, for the same voxel dwell time, the C-scan method has comparable displacement and strain sensitivity to the B-scan method, but with a 100-fold shorter acquisition time. In Fig. 3, we present 3-D-OCE results of Phantom 2 acquired with both the B-scan and C-scan methods. Figures 3(a) and 3(b) show the 3-D visualizations, Figs. 3(c) and 3(d) show the depth () sections, and Figs. 3(e) and 3(f) show the en face () images from the depth indicated by the dashed blue lines in Figs. 3(c) and 3(d). Using both methods, high contrast is observed between the stiff inclusion and the soft surrounding material. As expected, the local strain is close to zero in the inclusion, confirming its high stiffness relative to the surrounding soft material. The strain sensitivity was increased in the B-scan method by averaging five loaded/unloaded B-scan pairs, resulting in an increased contrast compared to the C-scan method, while maintaining the lateral resolution of the underlying OCT system (11 μm). B-scan spatial averaging was not performed for the C-scan method, as it would result in elastograms with significantly lower lateral resolution in this more sparsely sampled scan. In Figs. 4 and 5, we demonstrate an equivalent averaging technique for the C-scan method that improves contrast without degrading lateral resolution by averaging multiple C-scan (rather than B-scan) pairs. Fig. 33-D-OCE elastograms of Phantom 2 acquired with: (a, c, and e) the B-scan method in 500 s; and (c, d, and f) the C-scan method in 5 s. (a and b) 3-D visualizations demonstrating both methods; (c and d) B-scan images (-plane) from the center of the 3-D volumes in (a) and (b), respectively; (e and f) corresponding en face images (-plane) at the location indicated by the dashed blue line in (c) and (d). The white arrows indicate the ringing artifact. In (a) and (b), scale bars represent 200 μm.  Fig. 4En face (a) optical coherence tomography image and (b) elastogram (optical depth, 100 μm) of a 5-mm thick section of ex vivo gastrocnemius rat muscle. (c and d) Magnifications of the regions highlighted by a blue rectangle in (a) and (b). (e) Averaged magnified elastogram from five C-scan pairs.  Fig. 5Experimental characterization of strain sensitivity in the C-scan method versus number of 5-s scans averaged. Measurements taken with Phantom 1. 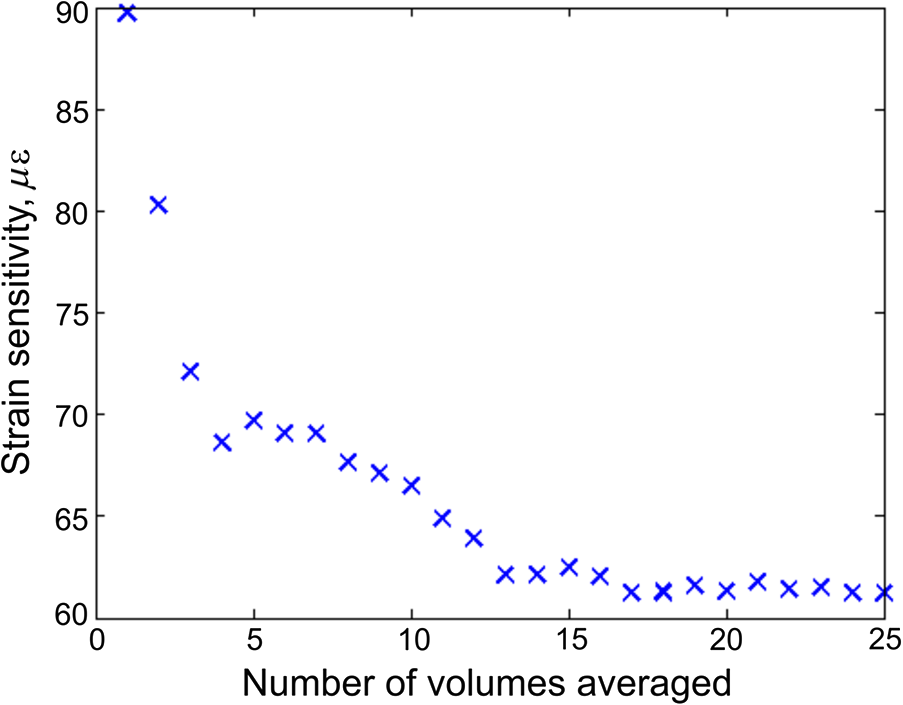 Figures 3(a), 3(c), and 3(e) demonstrate a noticeable artifact caused by the limited response time of the actuator when using the B-scan method. Following the step increment in load between B-scans [Fig. 1(c)], a damped oscillation (ringing) of the actuator, indicated by the arrows in Fig. 3, persists for and results in modulation of local strain in the sample. This ringing artifact is confined to the first B-scan in the C-scan method [Figs. 3(b), 3(d) and 3(f)], as the step increment in load is imparted only once with increased rise time between C-scan acquisitions (Fig. 1). To demonstrate the C-scan method in tissue, en face OCT images and elastograms of freshly excised gastrocnemius rat muscle tissue are presented in Fig. 4. In the OCT image [Fig. 4(a)], groups of muscle fibers are visible running from bottom left to top right of the image. Many of these muscle fibers are visible in the elastogram [Fig. 4(b)]. The elastogram also identifies the boundary of several fascicles (bundles of muscle fibers surrounded by a sheath of connective tissue) not readily visible in the OCT image. To better illustrate the complementary contrast provided by OCE, Figs. 4(c) and 4(d) show magnifications of the regions highlighted by the blue rectangle in Figs. 4(a) and 4(b), respectively. Figure 4(e) demonstrates that improved strain sensitivity can be achieved by trading off sensitivity and acquisition speed. Figure 4(e) shows the results of averaging five loaded and unloaded C-scans acquired from the same spatial location, demonstrating lower noise than in Fig. 4(d). This is analogous to the improved contrast shown in Fig. 3(e) obtained by averaging multiple loaded/unloaded B-scans. Although this increases the total 3-D-OCE acquisition time from 5 to 25 s, an improvement in strain sensitivity is gained. For example, in the bottom right of Fig. 4(e), additional fibers can be seen that are not readily visible in the original elastogram [Fig. 4(d)]. To quantify the improvement in strain sensitivity brought about by averaging in the C-scan method, we acquired 25 loaded and unloaded C-scan pairs from the same location in Phantom 1. Using the method described above, we calculated the strain sensitivity as a function of the number of scans averaged. As shown in Fig. 5, averaging led to an increase in the strain sensitivity from 90 to 60 με, while the acquisition time increased from 5 to 125 s. Under the assumption of Gaussian-distributed phase, averaging would improve displacement and strain sensitivity by , where is the number of volumes averaged. The data in Fig. 5 approximately follow this trend. However, while this assumption is valid for shot-noise limited detection,46 additional phase noise caused by phase decorrelation between loaded and unloaded volumes and scanning noise caused by the galvanometer mirrors lower the phase sensitivity in 3-D-OCE. As a result, the magnitude of the improvement shown in Fig. 5 is less than anticipated. 4.DiscussionWe have presented a new method of achieving higher speed acquisition in 3-D-OCE, based on phase-sensitive detection of consecutive C-scans, and demonstrated the acquisition of 3-D-OCE scans in 5 s. The acquisition time was limited by the maximum A-scan rate of the spectral-domain OCT system (100 kHz) and could be readily reduced by using a higher speed OCT system. OCT C-scan acquisition times of only 25 ms have been demonstrated using high-speed swept sources,47 implying 3-D-OCE scans could be acquired in as little as 50 ms using our method. In practice, the need for quasistatic loading (loading frequency ) in compression OCE limits the 3-D-OCE acquisition time to 0.2 s, a further factor of 25 improvement over what has been demonstrated here. Phase-sensitive detection between volumes overcomes a fundamental limitation of the B-scan method by coupling the loading frequency with the C-scan acquisition frequency. Thus, the need to operate in the quasistatic regime sets the volume scan rate, rather than the B-scan frame rate, to 5 Hz. The strain sensitivity we report for both B-scan and C-scan methods, 60 to 90 με, is lower than that previously reported for two-dimensional compression OCE ( to 26 με).12,16,42 As our group has previously described in detail,13 a key factor limiting strain sensitivity is OCT SNR, as it determines the achievable displacement sensitivity. Wang et al. reported a strain sensitivity of 26 με based on an OCT SNR of 50 dB (reported as a strain rate of at 0.1 s acquisition time).12 Although such SNRs can certainly be achieved at the surface of turbid tissue, dark speckles and attenuation limit the feasibility of achieving such high SNR at each pixel over the depth range (50 to 200 μm) required to calculate local strain. To improve the strain sensitivity in the presence of the lower OCT SNR in turbid tissue, our group has previously performed averaging of 50 loaded and unloaded B-scan pairs to achieve strain sensitivity of .16,42 This level of averaging could be achieved in 3-D OCE using the technique described above (Fig. 5), but would result in a long acquisition time of . The application of 3-D OCE to clinical and in vivo applications will require not only rapid acquisition of 3-D elastograms, as provided by our method, but also rapid processing to enable “live” visualization of the data acquired. This could be achieved by employing graphics processing units, as demonstrated for OCT48 and Doppler OCT.49 5.ConclusionWe have demonstrated for the first time 3-D-OCE performed by calculating the phase difference between consecutive OCT C-scans, acquired before and after imparting a compressive load to a silicone phantom or freshly excised rat muscle. We demonstrated a 3-D-OCE acquisition time of 5 s, an order of magnitude shorter than with our existing B-scan method,13,16 with displacement and strain sensitivity, 0.86 nm and 90 με, respectively, which are comparable to the B-scan method. We demonstrated that averaging improves the strain sensitivity to 60 με, at the expense of longer acquisition time. We expect that the increase in acquisition speed provided by this method will aid in the translation of OCE to clinical and in vivo applications. AcknowledgmentsWe thank Gavin Pinniger and Jeremy Costin for providing access to muscle tissue and performing the dissection procedures. We also thank Kelsey Kennedy and Shaghayegh Es’haghian for useful discussions and the provision of phantoms. L. Chin is supported by a Robert and Maude Gledden Postgraduate Research Scholarship from The University of Western Australia. ReferencesK. J. Parkeret al.,
“A unified view of imaging the elastic properties of tissue,”
J. Acoust. Soc. Am., 117
(5), 2705
–2712
(2005). http://dx.doi.org/10.1121/1.1880772 JASMAN 0001-4966 Google Scholar
Y. C. Fung, Biomechanics: Mechanical Properties of Living Tissues, Springer-Verlag, New York
(1981). Google Scholar
M. M. DoyleyK. J. Parker,
“Elastography: general principles and clinical applications,”
Ultrasound Clin., 9
(1), 1
–11
(2014). http://dx.doi.org/10.1016/j.cult.2013.09.006 1556858X Google Scholar
J. Schmitt,
“OCT elastography: imaging microscopic deformation and strain of tissue,”
Opt. Express, 3
(6), 199
–211
(1998). http://dx.doi.org/10.1364/OE.3.000199 OPEXFF 1094-4087 Google Scholar
B. F. KennedyK. M. KennedyD. D. Sampson,
“A review of optical coherence elastography: fundamentals, techniques and prospects,”
IEEE J. Sel. Top. Quantum, 20
(2), 7101217
(2014). http://dx.doi.org/10.1109/JSTQE.2013.2291445 IJSQEN 1077-260X Google Scholar
R. Chanet al.,
“OCT-based arterial elastography: robust estimation exploiting tissue biomechanics,”
Opt. Express, 12
(19), 4558
–4572
(2004). http://dx.doi.org/10.1364/OPEX.12.004558 OPEXFF 1094-4087 Google Scholar
A. Chauet al.,
“Mechanical analysis of atherosclerotic plaques based on optical coherence tomography,”
Ann. Biomed. Eng., 32
(11), 1494
–1503
(2004). http://dx.doi.org/10.1114/B:ABME.0000049034.75368.4a ABMECF 0090-6964 Google Scholar
J. Rogowskaet al.,
“Optical coherence tomographic elastography technique for measuring deformation and strain of atherosclerotic tissues,”
Heart, 90
(5), 556
–562
(2004). http://dx.doi.org/10.1136/hrt.2003.016956 1355-6037 Google Scholar
H. J. Koet al.,
“Optical coherence elastography of engineered and developing tissue,”
Tissue Eng., 12
(1), 63
–73
(2006). http://dx.doi.org/10.1089/ten.2006.12.63 1937-3341 Google Scholar
S. G. Adieet al.,
“Audio frequency in vivo optical coherence elastography,”
Phys. Med. Biol., 54
(10), 3129
–3139
(2009). http://dx.doi.org/10.1088/0031-9155/54/10/011 PHMBA7 0031-9155 Google Scholar
S. J. Kirkpatricket al.,
“Imaging the mechanical stiffness of skin lesions by in vivo acousto-optical elastography,”
Opt. Express, 14
(21), 9770
–9779
(2006). http://dx.doi.org/10.1364/OE.14.009770 OPEXFF 1094-4087 Google Scholar
R. K. WangS. KirkpatrickM. Hinds,
“Phase-sensitive optical coherence elastography for mapping tissue microstrains in real time,”
Appl. Phys. Lett., 90
(16), 164105
(2007). http://dx.doi.org/10.1063/1.2724920 APPLAB 0003-6951 Google Scholar
B. F. Kennedyet al.,
“Strain estimation in phase-sensitive optical coherence elastography,”
Biomed. Opt. Express, 3
(8), 1865
–1879
(2012). http://dx.doi.org/10.1364/BOE.3.001865 BOEICL 2156-7085 Google Scholar
A. Nahaset al.,
“3D static elastography at the micrometer scale using full field OCT,”
Biomed. Opt. Express, 4
(10), 2138
–2149
(2013). http://dx.doi.org/10.1364/BOE.4.002138 BOEICL 2156-7085 Google Scholar
V. Y. Zaitsevet al.,
“A correlation-stability approach to elasticity mapping in optical coherence tomography,”
Laser Phys. Lett., 10
(6), 065601
(2013). http://dx.doi.org/10.1088/1612-2011/10/6/065601 1612-2011 Google Scholar
B. F. Kennedyet al.,
“Optical coherence micro-elastography: mechanical contrast imaging of tissue microstructure,”
Biomed. Opt. Express, 5
(7), 2113
–2124
(2014). http://dx.doi.org/10.1364/BOE.5.002113 BOEICL 2156-7085 Google Scholar
S. G. Adieet al.,
“Spectroscopic optical coherence elastography,”
Opt. Express, 18
(25), 25519
–25534
(2010). http://dx.doi.org/10.1364/OE.18.025519 OPEXFF 1094-4087 Google Scholar
C. Liet al.,
“Quantitative elastography provided by surface acoustic waves measured by phase-sensitive optical coherence tomography,”
Opt. Lett., 37
(4), 722
–724
(2012). http://dx.doi.org/10.1364/OL.37.000722 OPLEDP 0146-9592 Google Scholar
K. D. MohanA. L. Oldenburg,
“Elastography of soft materials and tissues by holographic imaging of surface acoustic waves,”
Opt. Express, 20
(17), 18887
–18897
(2012). http://dx.doi.org/10.1364/OE.20.018887 OPEXFF 1094-4087 Google Scholar
S. Wanget al.,
“Noncontact measurement of elasticity for the detection of soft-tissue tumors using phase-sensitive optical coherence tomography combined with a focused air-puff system,”
Opt. Lett., 37
(24), 5184
–5186
(2012). http://dx.doi.org/10.1364/OL.37.005184 OPLEDP 0146-9592 Google Scholar
S. Wanget al.,
“A focused air-pulse system for optical-coherence-tomography-based measurements of tissue elasticity,”
Laser Phys. Lett., 10
(7), 075605
(2013). http://dx.doi.org/10.1088/1612-2011/10/7/075605 1612-2011 Google Scholar
V. Creceaet al.,
“Magnetomotive nanoparticle transducers for optical rheology of viscoelastic materials,”
Opt. Express, 17
(25), 23114
–23122
(2009). http://dx.doi.org/10.1364/OE.17.023114 OPEXFF 1094-4087 Google Scholar
V. CreceaA. AhmadS. A. Boppart,
“Magnetomotive optical coherence elastography for microrheology of biological tissues,”
J. Biomed. Opt., 18
(12), 121504
(2013). http://dx.doi.org/10.1117/1.JBO.18.12.121504 JBOPFO 1083-3668 Google Scholar
W. Qiet al.,
“Resonant acoustic radiation force optical coherence elastography,”
Appl. Phys. Lett., 103
(10), 103704
(2013). http://dx.doi.org/10.1063/1.4820252 APPLAB 0003-6951 Google Scholar
W. Qiet al.,
“Phase-resolved acoustic radiation force optical coherence elastography,”
J. Biomed. Opt., 17
(11), 110505
(2012). http://dx.doi.org/10.1117/1.JBO.17.11.110505 JBOPFO 1083-3668 Google Scholar
A. Nahaset al.,
“From supersonic shear wave imaging to full-field optical coherence shear wave elastography,”
J. Biomed. Opt., 18
(12), 121514
(2013). http://dx.doi.org/10.1117/1.JBO.18.12.121514 JBOPFO 1083-3668 Google Scholar
M. Razaniet al.,
“Feasibility of optical coherence elastography measurements of shear wave propagation in homogeneous tissue equivalent phantoms,”
Biomed. Opt. Express, 3
(5), 972
–980
(2012). http://dx.doi.org/10.1364/BOE.3.000972 BOEICL 2156-7085 Google Scholar
A. Srivastavaet al.,
“Determination of elastic properties of resected human breast tissue samples using optical coherence tomographic elastography,”
Strain, 47
(1), 75
–87
(2011). http://dx.doi.org/10.1111/str.2010.47.issue-1 0039-2103 Google Scholar
K. M. Kennedyet al.,
“Needle optical coherence elastography for the measurement of microscale mechanical contrast deep within human breast tissues,”
J. Biomed. Opt., 18
(12), 121510
(2013). http://dx.doi.org/10.1117/1.JBO.18.12.121510 JBOPFO 1083-3668 Google Scholar
F. M. Hendrikset al.,
“The relative contributions of different skin layers to the mechanical behavior of human skin in vivo using suction experiments,”
Med. Eng. Phys., 28
(3), 259
–266
(2006). http://dx.doi.org/10.1016/j.medengphy.2005.07.001 MEPHEO 1350-4533 Google Scholar
B. F. Kennedyet al.,
“In vivo dynamic optical coherence elastography using a ring actuator,”
Opt. Express, 17
(24), 21762
–21772
(2009). http://dx.doi.org/10.1364/OE.17.021762 OPEXFF 1094-4087 Google Scholar
X. LiangS. A. Boppart,
“Biomechanical properties of in vivo human skin from dynamic optical coherence elastography,”
IEEE Trans. Biomed. Eng., 57
(4), 953
–959
(2010). http://dx.doi.org/10.1109/TBME.2009.2033464 IEBEAX 0018-9294 Google Scholar
B. F. Kennedyet al.,
“In vivo three-dimensional optical coherence elastography,”
Opt. Express, 19
(7), 6623
–6634
(2011). http://dx.doi.org/10.1364/OE.19.006623 OPEXFF 1094-4087 Google Scholar
M. R. Fordet al.,
“Method for optical coherence elastography of the cornea,”
J. Biomed. Opt., 16
(1), 016005
(2011). http://dx.doi.org/10.1117/1.3526701 JBOPFO 1083-3668 Google Scholar
C. Liet al.,
“Noncontact all-optical measurement of corneal elasticity,”
Opt. Lett., 37
(10), 1625
–1627
(2012). http://dx.doi.org/10.1364/OL.37.001625 OPLEDP 0146-9592 Google Scholar
A. S. Khalilet al.,
“Tissue elasticity estimation with optical coherence elastography: toward mechanical characterization of in vivo soft tissue,”
Ann. Biomed. Eng., 33
(11), 1631
–1639
(2005). http://dx.doi.org/10.1007/s10439-005-6766-3 ABMECF 0090-6964 Google Scholar
G. van Soestet al.,
“Robust intravascular optical coherence elastography by line correlations,”
Phys. Med. Biol., 52
(9), 2445
–2458
(2007). http://dx.doi.org/10.1088/0031-9155/52/9/008 PHMBA7 0031-9155 Google Scholar
M. Wojtkowskiet al.,
“Three-dimensional retinal imaging with high-speed ultrahigh-resolution optical coherence tomography,”
Ophthalmology, 112
(10), 1734
–1746
(2005). http://dx.doi.org/10.1016/j.ophtha.2005.05.023 OPANEW 0743-751X Google Scholar
J. L. Whitwellet al.,
“3D maps from multiple MRI illustrate changing atrophy patterns as subjects progress from mild cognitive impairment to Alzheimer’s disease,”
Brain, 130
(7), 1777
–1786
(2007). http://dx.doi.org/10.1093/brain/awm112 BRAIAK 0006-8950 Google Scholar
O. Peterset al.,
“Three-dimensional analysis of root canal geometry by high-resolution computed tomography,”
J. Dent. Res., 79
(6), 1405
–1409
(2000). http://dx.doi.org/10.1177/00220345000790060901 JDREAF 0022-0345 Google Scholar
R. K. WangZ. MaS. J. Kirkpatrick,
“Tissue Doppler optical coherence elastography for real time strain rate and strain mapping of soft tissue,”
Appl. Phys. Lett., 89
(14), 144103
(2006). http://dx.doi.org/10.1063/1.2357854 APPLAB 0003-6951 Google Scholar
K. M. Kennedyet al.,
“Analysis of mechanical contrast in optical coherence elastography,”
J. Biomed. Opt., 18
(12), 121508
(2013). http://dx.doi.org/10.1117/1.JBO.18.12.121508 JBOPFO 1083-3668 Google Scholar
B. Parket al.,
“Real-time fiber-based multi-functional spectral-domain optical coherence tomography at 1.3 μm,”
Opt. Express, 13
(11), 3931
–3944
(2005). http://dx.doi.org/10.1364/OPEX.13.003931 OPEXFF 1094-4087 Google Scholar
A. CuratoloB. F. KennedyD. D. Sampson,
“Structured three-dimensional optical phantom for optical coherence tomography,”
Opt. Express, 19
(20), 19480
–19485
(2011). http://dx.doi.org/10.1364/OE.19.019480 OPEXFF 1094-4087 Google Scholar
G. Lamoucheet al.,
“Review of tissue simulating phantoms with controllable optical, mechanical and structural properties for use in optical coherence tomography,”
Biomed. Opt. Express, 3
(6), 1381
–1398
(2012). http://dx.doi.org/10.1364/BOE.3.001381 BOEICL 2156-7085 Google Scholar
J. W. Goodman, Statistical Optics, Wiley-Interscience, New York
(1985). Google Scholar
W. Wieseret al.,
“Multi-megahertz OCT: high quality 3D imaging at 20 million A-scans and 4.5 GVoxels per second,”
Opt. Express, 18
(14), 14685
–14704
(2010). http://dx.doi.org/10.1364/OE.18.014685 OPEXFF 1094-4087 Google Scholar
Y. WatanabeT. Itagaki,
“Real-time display on Fourier domain optical coherence tomography system using a graphics processing unit,”
J. Biomed. Opt., 14
(6), 060506
(2009). http://dx.doi.org/10.1117/1.3275463 JBOPFO 1083-3668 Google Scholar
M. Sylwestrzaket al.,
“Four-dimensional structural and Doppler optical coherence tomography imaging on graphics processing units,”
J. Biomed. Opt., 17
(10), 100502
(2012). http://dx.doi.org/10.1117/1.JBO.17.10.100502 JBOPFO 1083-3668 Google Scholar
BiographyBrendan F. Kennedy is research assistant professor in the Optical+Biomedical Engineering Laboratory at The University of Western Australia. He received his PhD from Dublin City University, Ireland, in 2006. From 2006 to 2007, he was employed as lecturer in the Electrical Engineering Department, Universidad de Santiago de Chile. Since 2008, he has worked at The University of Western Australia. His principle research interests are optical elastography and the measurement of tissue mechanics. Francisco Gomes Malheiro received the BS degree in biomedical engineering and biophysics from the Faculty of Sciences, University of Lisbon, Portugal, in 2012. He is currently finishing his Master’s degree in the same field, after completing a final year project during a 6-month internship in the Optical+Biomedical Engineering Laboratory, The University of Western Australia. His research interests include optical elastography and proton radiotherapy. Lixin Chin is a PhD student in the Optical+Biomedical Engineering Laboratory within the School of Electrical, Electronic & Computer Engineering at The University of Western Australia. He is working in the areas of polarization-sensitive optical coherence tomography, compression optical coherence elastography, and their applications towards pre-clinical and clinical assessment of pathology. David D. Sampson is director of the Centre for Microscopy, Characterisation & Analysis, a core facility of The University of Western Australia, and heads the Optical+Biomedical Engineering Laboratory (OBEL) in the School of Electrical, Electronic & Computer Engineering. He directs the Western Australian nodes of the Australian Microscopy & Microanalysis Research Facility and Australia’s National Imaging Facility. He is a Fellow of the OSA and the SPIE and a senior member of the IEEE. |


