|
|
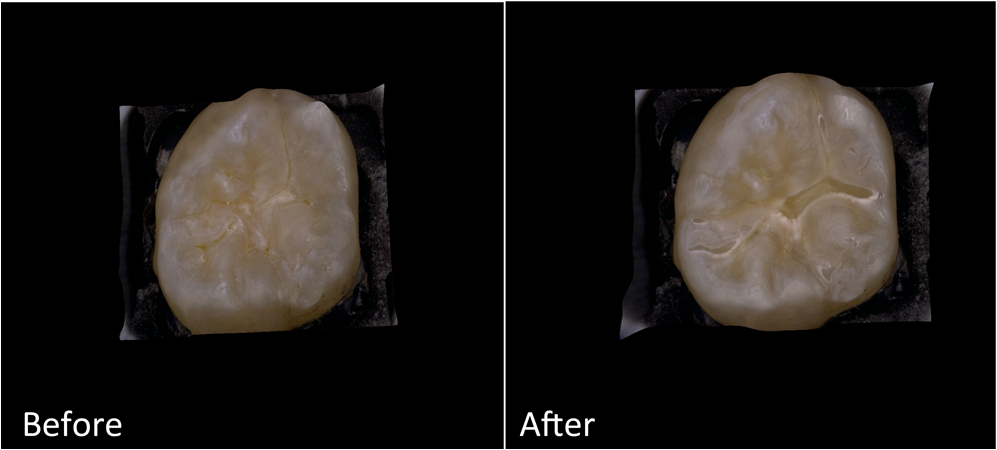
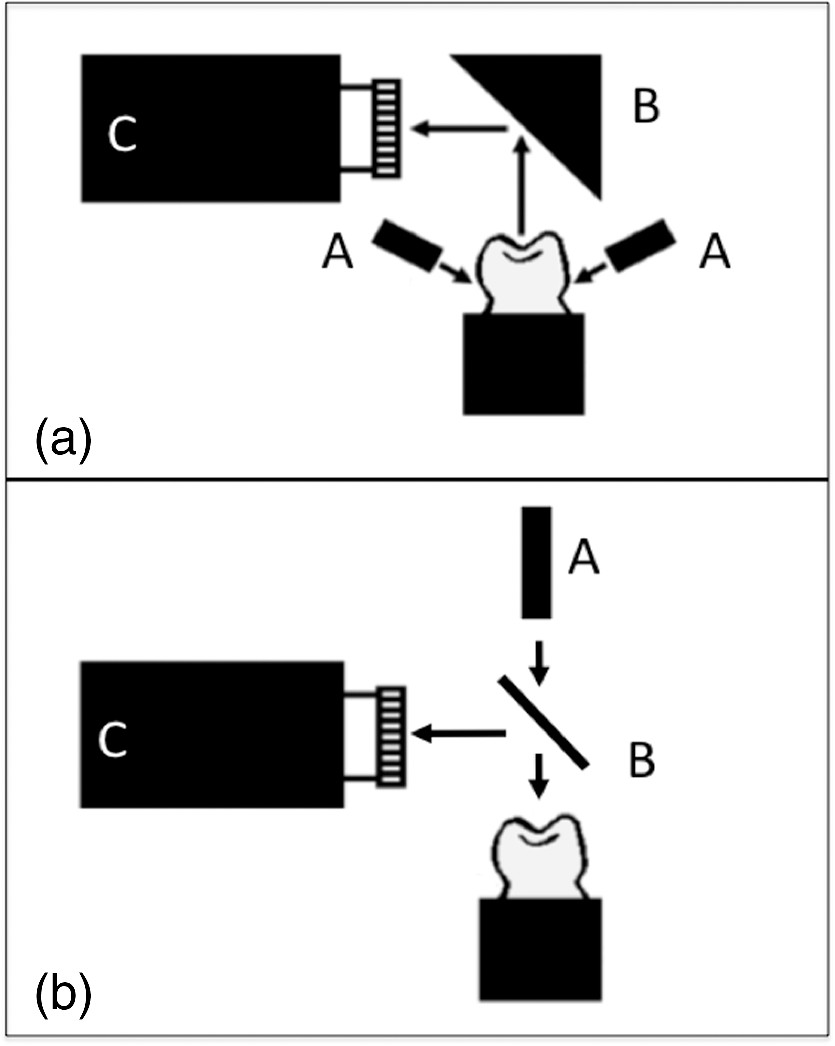
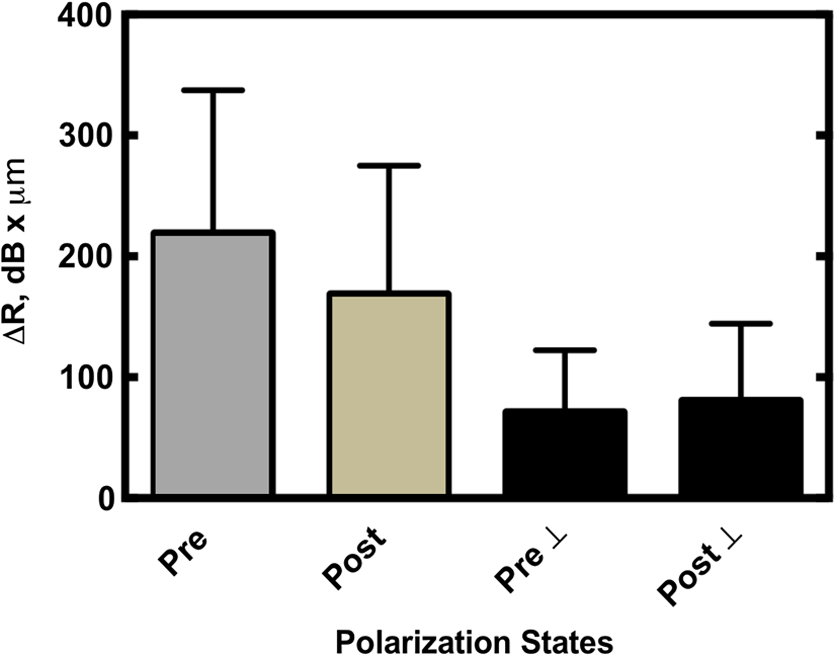
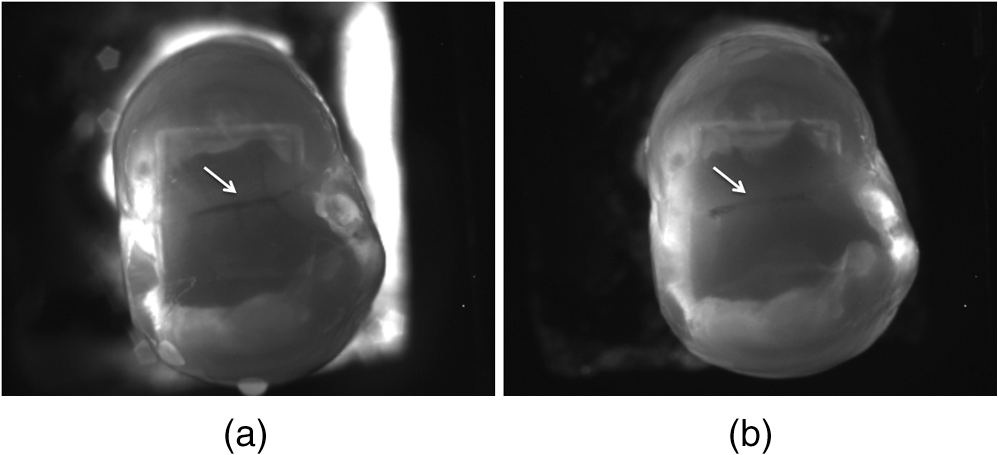
1.IntroductionNear-infrared (NIR) reflectance, NIR transillumination, and optical coherence tomography (OCT) are new imaging techniques that are capable of imaging caries lesions with high contrast in the wavelength region from 1300 to 1700 nm.1–7 We have found that 1300 nm yields the highest contrast for transillumination while wavelengths with higher water absorption, 1450 nm and 1500 to 1700 nm, yield the highest contrast for NIR reflectance. Higher lesion contrast is important for improved diagnostic performance and earlier detection of caries lesions. Several studies have demonstrated the utility of OCT for measuring defects in composite restorations and sealants, the marginal adaptation of sealants, and the presence of secondary or residual caries.8–14 Dentists spend more time replacing existing restorations than placing new ones. Composite restorations are color-matched to the teeth and are often difficult to discriminate from sound tooth structure in the visible range. Recent studies have shown that NIR reflectance and transillumination can be used to enhance the contrast of composite restorations compared with visual detection.15,16 The contrast of the composite is enhanced since it contains less water than enamel and dentin. The purpose of this paper was to determine the influence of a clear sealant on the contrast of small natural caries lesions in the pits and the fissures of tooth occlusal surfaces measured using NIR reflectance and transillumination. Polarization sensitive optical coherence tomography (PS-OCT) was employed to confirm the severity of the occlusal lesions before application of the sealant and to evaluate the severity of demineralization. Several studies both in vitro and in vivo have shown that PS-OCT can be used to quantify the severity of early demineralization on tooth occlusal surfaces.17–19 The cross-polarization OCT (CP-OCT) image is advantageous for removing the strong surface reflection and the contrast of for the lesion area is higher, i.e., the ratio of the reflectivity of the demineralized area/sound area is higher in the cross-polarization image versus the copolarization image. The reflectivity in the CP-OCT image can be integrated over the lesion depth to provide a measure of the lesion severity. Detailed comparison with microradiography measurements, the gold standard for demineralization, has established that the integrated reflectivity () correlates with the integrated mineral loss.17–19 It is recommended that preventive resin sealants be placed on the occlusal surfaces of posterior teeth on patients with deep fissures or a history of caries. Resin sealants prevent decay by acting as a physical barrier to acidogenic bacteria. However, the sealants are not always successful in preventing the development of lesions. Sealants are typically sold with opaque or clear shades. The opaque shades contain an optical opacifier, titanium dioxide, which strongly attenuates NIR light. The opaque sealant is preferred by many clinicians since it is more visible on the tooth. Jones et al.9 demonstrated that the decay under sealants can be quantified with PS-OCT and there have been other subsequent studies showing the utility of OCT for imaging caries lesions under sealants.8,12 In the previous study of Jones et al.,9 it was discovered that the composites/sealants did not scramble (depolarize) the incident polarized light nor were they birefringent. Therefore, it appeared most advantageous to analyze the lesion severity under sealants using cross-polarization images. This was a significant advantage of using the CP-OCT image in addition to the reduction of strong reflections at the air/tooth and the air/sealant interfaces. The copolarization images can also be used to detect the lesions under the sealant, but there are distinct disadvantages. However, there have been studies utilizing conventional OCT systems to image sealants.8 Holtzman et al.12 used a conventional OCT system to detect sealants placed over natural lesions. In this study, we also placed sealants over existing natural lesions. The NIR reflectance measurements yield high contrast for both artificial and natural caries lesions without interference from stains and color variations since none of the known chromophores absorb light in the NIR beyond 1300 nm. More recent NIR imaging studies suggest that the NIR wavelengths coincident with increased water absorption are well suited for the detection of early demineralization on tooth surfaces. We hypothesize that the higher water absorption in the underlying dentin and enamel reduces the reflectivity in sound areas and this, in turn, results in higher contrast between sound and demineralized enamel. Hyperspectral reflectance measurements by Zakian et al. show that the tooth appears darker with increasing wavelength.7 Recent studies by Chung et al.15 and Fried et al.20 on natural and simulated occlusal lesions indicated that other NIR wavelengths coincident with higher water absorption provide significantly higher contrast than at 1300 nm or at visible wavelengths. 2.Materials and Methods2.1.Sample PreparationFifteen human teeth with suspected lesions on the occlusal surface were collected with the approval of the Committee of Human Research and sterilized with gamma radiation. Teeth were visually examined and those that scored ICDAS 1 or 2 were selected. Teeth were mounted in black orthodontic acrylic blocks. Samples were stored in a moist environment of 0.1% thymol to maintain tissue hydration and prevent bacterial growth. The outlines of windows deep were cut on the occlusal surface of each tooth using a laser (Impact 2500, GSI Lumonics, Rugby, United Kingdom) around the suspected lesion area. The channels cut by the laser serve as reference points for imaging and serial sectioning and are sufficiently narrow that they do not interfere with calculations of the image contrast. A clear sealant (without an optical opacifier), DELTON® FS+ pit and fissure sealant (Dentsply, York, Pennsylvania) was applied to the suspect fissure area according to the manufacturer’s instructions. NIR and PS-OCT images of the occlusal surface were acquired before and after the sealant was applied. A diamond suspension (3000 mesh, 6 μm) from CrystaLite Inc. (Lewis Center, Ohio) was sprayed onto the tooth surface to show the surface of the sealant for PS-OCT imaging in order to determine the sealant thickness. 2.2.Composite Attenuation MeasurementsDelton clear sealant was cast into rods using clear straws and light cured for the recommended duration. Discs were cut using an IsoMet 2000 wet saw from Buehler (Lakebluff, Illinois) to produce samples 1.0, 1.5, 2.0, 2.5, and 3.0 mm in thickness ( for each thickness). Sample disks were serially polished on both sides with 12, 9, 5, 3, and 0.3 μm Buehler fibermet aluminum oxide polishing discs and measured with a digital caliper 500 series from Mitutoyo (Aurora, Illinois). Light from an Ocean Optics (Dunedin, Florida) fiber-coupled tungsten-halogen lamp, Model HL-2000-FHSA, with a filter wheel with bandpass filters, FB series [full-width half-maximum (FWHM) 12-nm] from Thorlabs (Newton, New Jersey) centered at 50-nm intervals from 1300 to 1650 nm was used to illuminate specific areas of the sample with a spot size of . The spot size was confirmed through knife-edge beam profiling techniques. Phase sensitive detection was employed using a lock-in amplifier (Model SR 850) and an optical chopper from Stanford Research Systems (Stanford, California). A large-area Ge photoreceiver Model 2033 from New Focus (Santa Clara, California) equipped with a variable aperture was used for detection. This procedure ensured that the position of the incident collimated light beam was fixed while cycling through the filters. Three measurements of collimated transmission were recorded at various sections within each sample and averaged. The collimated signal () at the detector was compared with the initial intensity of the beam (). Using this ratio and the thickness of the samples (), the attenuation coefficient () was calculated using Beer–Lambert plots: The aperture in the front of the detector was sufficiently small to ensure that light scattered at small angles did not contribute significantly to the collimated transmission. 2.3.Visible-Light Depth Composition Tooth ImagesImages of the tooth occlusal surfaces were examined using a digital microscopy system, the VHX-1000 from Keyence (Elmwood, New Jersey) with the VH-Z25 lens with a magnification from 25 to . Images were acquired by scanning the image plane of the microscope and reconstructing a depth composition image with all points at optimum focus displayed in a two-dimensional image. Figure 1 shows depth composition images of a tooth before and after placement of the transparent sealant. The sealant does change the appearance of the occlusal surface, increasing the contrast of the edges of the pits and the fissures. The sealant itself is not visible and one cannot estimate the sealant thickness and coverage by visual examination alone. 2.4.Near-IR Cross Polarization Reflectance ImagesIn order to acquire reflected light images, NIR light was directed toward the occlusal surface through a broadband-fused silica beam splitter (1200 to 1600 nm) Model BSW12 (Thorlabs, Newton, New Jersey), and the reflected light from the tooth was transmitted by the beam splitter to the imaging camera (Fig. 2). Crossed polarizers were placed after the light source and before the detector and used to remove specular reflection (glare) that interferes with measurements of the lesion contrast. The NIR reflectance images were captured using a element InGaAs area camera Model SU320-KTSX from Sensors Unlimited (Princeton, New Jersey) with a 25-μm pixel pitch. Reflectance measurements were taken for three spectral bands using two bandpass filters and a longpass filter. The bandpass filters were Model #'s BP1300-90 and BP1460-85 from Spectrogon (Parsippany, New Jersey). The 1500-nm-longpass filter Model # the FEL 1500 from Thorlabs (Newton, New Jersey), which resulted in a spectral range of 1500 to 1700 nm due to the sensitivity of the InGaAs camera. 2.5.Near-IR Transillumination ImagesA 150-W fiber-optic illuminator, Model FOI-1 from the E Licht Company (Denver, Colorado) with a low profile fiber optic with dual-line lights, Model P39-987 (Edmund Scientific, Barrington, New Jersey), was used with each light line directed at the cement-to-enamel junction beneath the crown on the buccal and lingual sides of each tooth (Fig. 2). Light leaving the occlusal surface was directed by a right angle prism to the SU320 InGaAs camera equipped with a Navitar (Rochester, New York) SWIR-35 lens, a 75-mm plano-convex lens LA1608-C Thorlabs (Newton, New Jersey) and a 90-nm-wide bandpass filter centered at 1300 nm, BP1300-90 Spectrogon, (Parsippany, New Jersey). 2.6.Polarization Sensitive—Optical Coherence TomographyAn all-fiber-based optical coherence domain reflectometry system (time-domain) with polarization maintaining optical fiber, high-speed piezoelectric fiber-stretchers, and two balanced InGaAs receivers that was designed and fabricated by Optiphase, Inc., Van Nuys, California, was used. This two-channel system was integrated with a broadband superluminescent diode Denselight (Jessup, Maryland) and a high-speed -scanning system (ESP 300 controller and 850G-HS stages, National Instruments, Austin, Texas) for in vitro time-domain OCT. The system had a lateral resolution of and an axial resolution of 10 μm in air. The PS-OCT system is completely controlled using Labview software (National Instruments, Austin, Texas). The system is described in detail in Refs. 21 and 22. Acquired scans are compiled into b-scan files. Image processing was carried out using Igor Pro data analysis software (Wavemetrics Inc., Lake Oswego, Oregon). The CP-OCT scans were assessed to evaluate the integrated reflectivity () over the depth of demineralization in units of (). A program written in Labview as described in Ref 23 was used to automatically calculate the lesion depth using an edge detection approach and then integrate the reflectivity over that depth. 2.7.Image Analysis and StatisticsLine profiles were extracted across the same position in the lesions within the boxes for each spectral band, and the image contrast was calculated using the equation ; where is the mean intensity of the sound enamel outside the window area, and is the mean intensity of the lesion inside the window for reflectance. Transillumination has the reverse contrast, i.e., the intensity in lesion areas is lower than the sound enamel. The image contrast varies from 0 to 1 with 1 being maximum contrast and 0 no contrast. All image analysis was carried out using Igor Pro software (Wavemetrics, Lake Oswego, Oregon). Repeated measures of one-way analysis of variance followed by the Tukey–Kramer posthoc multiple comparison test was used to compare groups for each type of lesion employing Prism software (GraphPad, San Diego, California) before and after application of the sealant. 3.Results3.1.Attenuation MeasurementsThe optical attenuation coefficients as a function of wavelength are plotted in Fig. 3 from 1300 to 1650 nm. The coefficients lie between 5 and and are consistent with the varying absorption of water with the lowest attenuation at 1300 nm and the highest attenuation at matching the water absorption band. 3.2.PS-OCT MeasurementsPS-OCT b-scans of both polarization states of the occlusal surface of one of the teeth before and after application of the sealant are shown in Fig. 4. The laser marks 5-mm apart are visible on the left and right sides of the sample near each cusp and they appear as small depressions along with very strong surface reflection; they also strongly attenuate light and there is a loss of signal intensity under them. They are marked by the stars in the copolarization image in Fig. 4(a). A small shallow lesion is located at the base of the central fissure and the dentinal-enamel junction (DEJ) is clearly visible in the initial b-scans for both polarizations [Fig. 4(a)]. The lesion is located in the center of the white circle. After application of the sealant, the underlying DEJ is no longer visible [Fig. 4(b)] in either polarization. It is also very difficult to resolve the surface of the sealant in both polarization images [Fig. 4(b)]. In addition, the reflectivity from the lesion at the base of the fissure is greatly reduced in the copolarization image, whereas it is not reduced in the cross-polarization image. Fig. 4Polarization sensitive optical coherence tomography (PS-OCT) scans of an occlusal fissure before application of the sealant (a) after application of the sealant (b) and with the diamond suspension added (c) to view the sealant surface. The upper images are the copolarization images, whereas the lower images are the cross-polarization () images. In (A) the stars mark the position of the laser incisions and the white circle marks the position of the lesion in the fissure. The images are red-white-blue false color with the intensity in decibels. 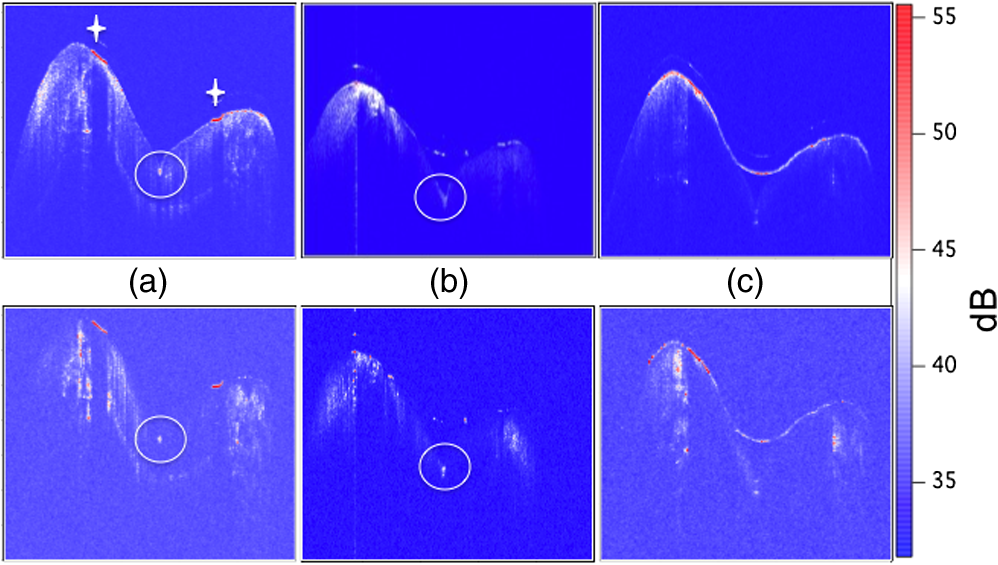 A 6-μm grit diamond powder suspension was sprayed onto the tooth surface, which rendered the surface of the sealant visible without greatly reducing the OCT imaging depth [Fig. 4(c)]. This facilitated measurement of the sealant thickness. The values were calculated from images without the diamond powder. The values were measured and calculated for the lesions before and after application of the sealant. The mean (s.d.) of for all the samples for the copolarization and cross-polarization () images, pre and postsealant, is plotted in Fig. 5. Bars of the same color are statistically similar (). Only the copolarization image manifested a significant reduction () in after application of the sealant. 3.3.Near-IR ReflectanceFigure 6 shows NIR reflectance images of a tooth before and after sealant placement for three wavelength regions 1300, 1450, and 1500 to 1700 nm. There is shallow demineralization in the central fissure, which appears whiter than the surrounding enamel, and it shows up with the highest contrast in Figs. 6(c) and 6(e). The fissure is located in the center of the reference box cut into the tooth. In Fig. 6(a) (1300 nm) it appears that either cracks or the premolar anatomy interfered with light transmission in the tooth causing segmentation of the light; one section of the tooth appears much brighter than the rest of the tooth. After application of the sealant, the reflected light is more uniform [Fig. 6(b)]. It is possible that the sealant filled in the cracks allowing better transmission of light through the tooth. It is very difficult to resolve the increased light reflectivity from the lesion in the fissure in Fig. 6(a), and it is not at all visible after application of the sealant [Fig. 6(b)]. The narrow zone of demineralization in the fissure appears with high contrast in Figs. 6(c) and 6(e) (1450 and 1500 to 1700 nm) and the surrounding sound enamel appears very dark. After application of the sealant the demineralization appears less continuous in the fissure and has lower contrast [Figs. 6(d) and 6(f)]. Fig. 6Near-IR reflectance images before application of the sealant at 1300, 1450, and 1500 to 1700-nm (a, c, e) and after application of the sealant at 1300, 1450, and 1500 to 1700-nm (b, d, f). The demineralization in the fissure is located at the position indicated by the white arrows in (c) and (e). 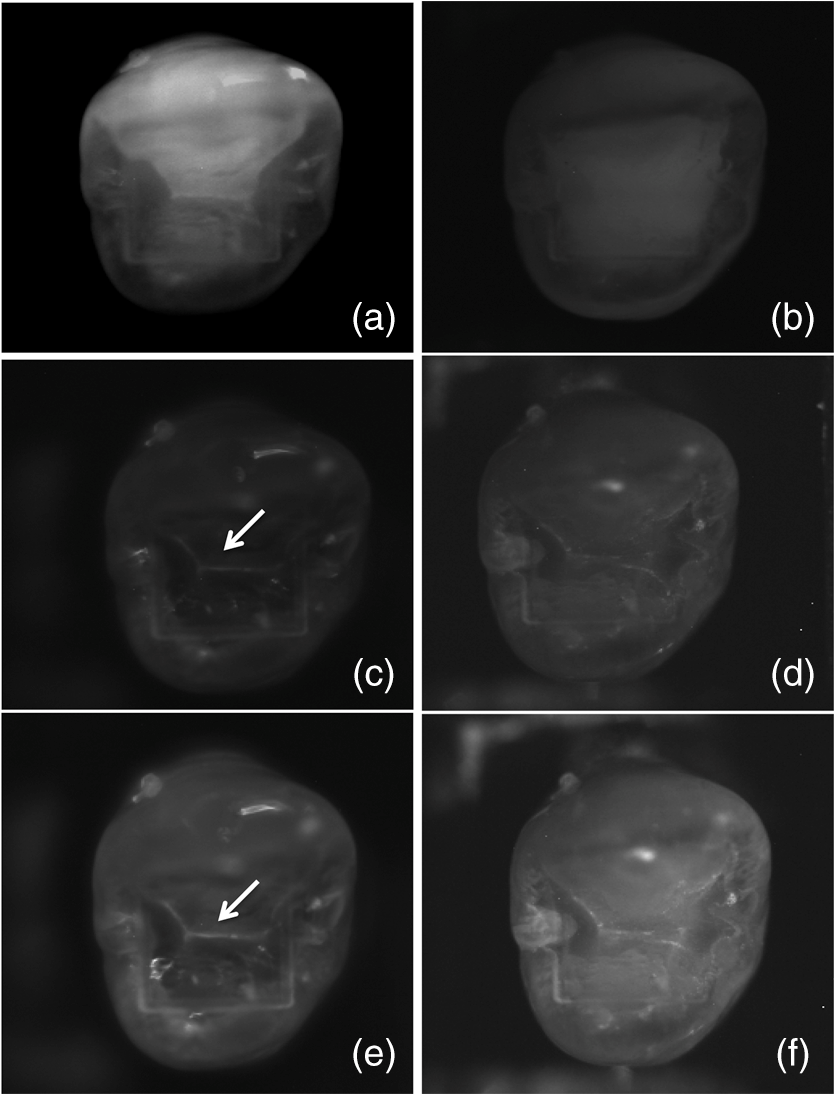 The mean (s.d.) of the lesion contrast in reflectance is plotted in Fig. 7 for the three NIR spectral regions before and after application of the sealant. The lesion contrast was significantly higher () at 1460 and 1500 to 1700 nm versus 1300 nm before application of the sealant. Application of the sealant significantly reduced () the lesion contrast at 1460 and 1500 to 1700 nm. The lowest mean contrast was at 1300 nm (0.08) and it dropped by 37% after adding the sealant. The highest contrast was at 1500 to 1700 nm (0.26) and it decreased by 49% after adding the sealant. The greatest change in contrast occurred at 1460 nm where the initial contrast (0.19) dropped by 80%. After application of the sealant, the mean lesion contrast at 1500 to 1700 nm was significantly higher than that for both 1300 and 1460 nm (). 3.4.Near-IR TransilluminationFigure 8 shows NIR transillumination images at 1300 nm of a tooth before and after placement of the sealant. Note that the contrast is inverted for transillumination and the lesion appears darker instead of whiter than the surrounding sound tissues. The previous studies have shown that 1300 nm performs best for transillumination of the occlusal surfaces. The other wavelengths, 1450 nm and 1500 to 1700 nm, failed to yield high contrast due to the high water absorption of the sealant and the underlying dentin. Moreover, NIR transillumination yields poor contrast for shallow lesions on tooth surfaces.24 4.DiscussionThe primary objective of this study was to determine the influence of clear sealants on the contrast of lesions in tooth occlusal surfaces in NIR reflectance and transillumination images. The PS-OCT images were acquired to confirm that the lesions were present. We did not anticipate the low visibility of the sealant in both the copolarization and the cross-polarization OCT (CP-OCT) images. In our previous study, using another clear sealant, Aeliteflo (Bisco, Schaumburg, Illinois), we found that the sealant was clearly visible in the copolarization image but was not visible in the cross polarization image.9 This indicated that the sealant neither scrambled the polarization (due to increased scattering) nor rotated the polarization axis (birefringence). The size and the shape of filler particles are expected to influence both the magnitude of attenuation and the interaction with polarized light.9,14 The Aeliteflo sealant was visible in the copolarization image because the scattering was sufficiently high. Therefore, light scattering by the Delton sealant is likely lower than the Aeliteflo clear sealant used in the previous study. The lower light scattering is certainly advantageous for monitoring demineralization under sealants using OCT. The low visibility of the sealant surface is even more surprising because if a drop of water is placed in the fissure, the surface of the water droplet can be clearly resolved in the OCT images. The sealant has a higher refractive index, versus 1.3, than water which is expected to increase the magnitude of the surface reflection. It is likely that the cured and the solidified surface of the sealant are irregular and not as flat and perfectly perpendicular to the incident beam as the surface of a liquid. Even though the clear sealant was not visible in the PS-OCT images, it did reduce the contrast in both NIR reflectance and NIR transillumination images. Attenuation was greater in the sealant for wavelengths with higher water absorption, namely 1450 nm and from 1500 to 1700 nm, due to the small but significant water content. The polymerized bisphenol A-glycidyl methacrylate (Bis-GMA) resin of the sealant contains 1% water by weight, which can increase to 4% due to absorption of water if stored in water for an extended period.25 Enamel and dentin are 4% and 10% water by weight, respectively. In the NIR, the scattering coefficient of dentin is more than 10 times higher than enamel.26,27 Much of the light diffusely reflected from the tooth surfaces is due to light that is backscattered from the highly scattering dentin under the transparent enamel. At wavelengths coincident with higher water absorption, e.g., 1450 nm, the tooth appears very dark because much of that light is absorbed by the water in the enamel and the dentin.7,15 Upon demineralization, the scattering coefficient of enamel increases by one to two orders of magnitude,28 so that the light incident in the lesion areas does not penetrate deeply. The areas appear very bright in reflectance and the loss of reflectivity due to water absorption is small since the photons are backscattered before they can penetrate deep into the enamel. This loss of penetration in demineralized enamel can be seen in OCT images. Normally the DEJ can be resolved through the transparent sound enamel, but the visibility is lost in areas where there is demineralization near the surface.5,19 Hence, the contrast between the sound and the demineralized enamel in reflectance is greatly enhanced at wavelengths coincident with higher water absorption, with the contrast highest at 1460 nm but almost as high at 1500 to 1700 nm. Water present in the layer of the transparent sealant reduces the reflectivity from the lesion and reduces the contrast. At 1460 nm, attenuation in the thin layer of sealant due to water is sufficient to markedly reduce the lesion contrast. At 1500 to 1700 nm there is also a reduction in lesion contrast, but it is less severe due to the lower absorption coefficient of water. Transillumination is not feasible at 1460 nm or 1500 to 1700 nm since the photons must transverse several millimeters through enamel and dentin, and the high water absorption produces greater attenuation than the scattering by the lesion. Areas of the occlusal surface with underlying dentin appear very dark due to the higher water absorption in the dentin and even severe lesions cannot be resolved.15 The influence of water absorption in the sealant on the lesion contrast in transillumination is minimal since the distance tranversed in the sealant is small compared to that in the enamel and the dentin. In conclusion, this study shows that clear sealants do attenuate NIR light, significantly reducing the contrast of demineralization in the pits and the fissures of the occlusal surfaces. The wavelength range of 1500 to 1700 nm is best suited for monitoring demineralization under sealants using NIR reflectance measurements since the lesion contrast is higher than other wavelengths both before and after application of the sealant. AcknowledgmentsThe authors acknowledge the support of NIH grants R01-DE14698 and R01-DE17869. The authors would like to thank Robert Lee and Michal Staninec for their help with this study. ReferencesC. M. BühlerP. NgaotheppitakD. Fried,
“Imaging of occlusal dental caries (decay) with near-IR light at 1310-nm,”
Opt. Express, 13
(2), 573
–582
(2005). http://dx.doi.org/10.1364/OPEX.13.000573 OPEXFF 1094-4087 Google Scholar
R. Joneset al.,
“Near-infrared transillumination at 1310-nm for the imaging of early dental decay,”
Opt. Express, 11
(18), 2259
–2265
(2003). http://dx.doi.org/10.1364/OE.11.002259 OPEXFF 1094-4087 Google Scholar
D. Friedet al.,
“Early caries imaging and monitoring with near-IR light,”
Dent. Clin. North Am., 49
(4), 771
–794
(2005). http://dx.doi.org/10.1016/j.cden.2005.05.008 DCNAAC 0011-8532 Google Scholar
D. Friedet al.,
“Near-IR imaging of interproximal lesions from occlusal surfaces and the influence of stains and plaque,”
Proc. SPIE, 6137 61370N
(2006). http://dx.doi.org/10.1117/12.661801 PSISDG 0277-786X Google Scholar
M. Staninecet al.,
“Nondestructive clinical assessment of occlusal caries lesions using near-IR imaging methods,”
Lasers Surg. Med., 43
(10), 951
–959
(2011). http://dx.doi.org/10.1002/lsm.v43.10 LSMEDI 0196-8092 Google Scholar
M. Staninecet al.,
“In vivo near-IR imaging of approximal dental decay at 1,310 nm,”
Lasers Surg. Med., 42
(4), 292
–8
(2010). http://dx.doi.org/10.1002/lsm.v42:4 LSMEDI 0196-8092 Google Scholar
C. ZakianI. PrettyR. Ellwood,
“Near-infrared hyperspectral imaging of teeth for dental caries detection,”
J. Biomed. Opt., 14
(6), 064047
(2009). http://dx.doi.org/10.1117/1.3275480 JBOPFO 1083-3668 Google Scholar
L. L. Otiset al.,
“Identification of occlusal sealants using optical coherence tomography,”
J. Clin. Dent., 14
(1), 7
–10
(2000). 0895-8831 Google Scholar
R. S. JonesM. StaninecD. Fried,
“Imaging artificial caries under composite sealants and restorations,”
J. Biomed. Opt., 9
(6), 1297
–1304
(2004). http://dx.doi.org/10.1117/1.1805562 JBOPFO 1083-3668 Google Scholar
L. S. de Meloet al.,
“Evaluation of enamel dental restoration interface by optical coherence tomography,”
J. Biomed. Opt., 10
(6), 064027
(2005). http://dx.doi.org/10.1117/1.2141617 JBOPFO 1083-3668 Google Scholar
J. StahlH. KangD. Fried,
“Imaging simulated secondary caries lesions with cross polarization OCT,”
Proc. SPIE, 7549 754905
(2010). http://dx.doi.org/10.1117/12.849332 PSISDG 0277-786X Google Scholar
J. S. Holtzmanet al.,
“Ability of optical coherence tomography to detect caries beneath commonly used dental sealants,”
Lasers Surg. Med., 42
(8), 752
–759
(2010). http://dx.doi.org/10.1002/lsm.20963 LSMEDI 0196-8092 Google Scholar
P. Makishiet al.,
“Non-destructive 3D imaging of composite restorations using optical coherence tomography: marginal adaptation of self-etch adhesives,”
J. Dentistry, 39
(4), 316
–325
(2011). http://dx.doi.org/10.1016/j.jdent.2011.01.011 JDENAB 0300-5712 Google Scholar
C. Lammeieret al.,
“Influence of dental resin material composition on cross-polarization-optical coherence tomography imaging,”
J. Biomed. Opt., 17
(10), 106002
(2012). http://dx.doi.org/10.1117/1.JBO.17.10.106002 JBOPFO 1083-3668 Google Scholar
S. Chunget al.,
“Multispectral near-IR reflectance and transillumination imaging of teeth,”
Bio Opt. Express, 2
(10), 2804
–2814
(2011). http://dx.doi.org/10.1364/BOE.2.002804 OPEXFF 1094-4087 Google Scholar
C. M. Loganet al.,
“Multispectral near-infrared imaging of composite restorations in extracted teeth,”
Proc. SPIE, 8929 89290R
(2014). http://dx.doi.org/10.1117/12.2045687 PSISDG 0277-786X Google Scholar
D. Friedet al.,
“Imaging caries lesions and lesion progression with polarization sensitive optical coherence tomography,”
J. Biomed. Opt., 7
(4), 618
–627
(2002). http://dx.doi.org/10.1117/1.1509752 JBOPFO 1083-3668 Google Scholar
T. Louieet al.,
“Clinical assessment of early tooth demineralization using polarization sensitive optical coherence tomography,”
Lasers Surg. Med., 42
(10), 738
–745
(2010). http://dx.doi.org/10.1002/lsm.21013 LSMEDI 0196-8092 Google Scholar
P. NgaotheppitakC. L. DarlingD. Fried,
“Measurement of the severity of natural smooth surface (interproximal) caries lesions with polarization sensitive optical coherence tomography,”
Lasers Surg. Med., 37
(1), 78
–88
(2005). http://dx.doi.org/10.1002/(ISSN)1096-9101 LSMEDI 0196-8092 Google Scholar
W. A. Friedet al.,
“High contrast reflectance imaging of simulated lesions on tooth occlusal surfaces at near-IR wavelengths,”
Lasers Surg. Med., 45
(8), 533
–541
(2013). LSMEDI 0196-8092 Google Scholar
J. BushP. DavisM. A. Marcus,
“All-fiber optic coherence domain interferometric techniques,”
Proc. SPIE, 4204 71
–80
(2000). http://dx.doi.org/10.1117/12.417430 PSISDG 0277-786X Google Scholar
D. Friedet al.,
“Early detection of dental caries and lesion progression with polarization sensitive optical coherence tomography,”
J. Biomed. Opt., 7
(4), 618
–627
(2002). http://dx.doi.org/10.1117/1.1509752 JBOPFO 1083-3668 Google Scholar
K. H. Chanet al.,
“Use of 2D images of depth and integrated reflectivity to represent the severity of demineralization in cross-polarization optical coherence tomography,”
J. Biophotonics,
(2013). JBOIBX 1864-063X Google Scholar
J. WuD. Fried,
“High contrast near-infrared polarized reflectance images of demineralization on tooth buccal and occlusal surfaces at ,”
Lasers Surg. Med., 41
(3), 208
–213
(2009). http://dx.doi.org/10.1002/lsm.v41:3 LSMEDI 0196-8092 Google Scholar
S. VenzB. Dickens,
“NIR-spectroscopic investigation of water sorption characteristics of dental resins and composites,”
J. Biomed. Mater. Res., 25
(10), 1231
–1248
(1991). http://dx.doi.org/10.1002/(ISSN)1097-4636 JBMRBG 0021-9304 Google Scholar
A. C. Chanet al.,
“Attenuation of near-IR light through dentin at wavelengths from 1300–1650-nm,”
Proc. SPIE, 8929 89290M
(2014). http://dx.doi.org/10.1117/12.2045629 PSISDG 0277-786X Google Scholar
R. S. JonesD. Fried,
“Attenuation of 1310-nm and 1550-nm laser light through sound dental enamel,”
Proc. SPIE, 4610 187
–190
(2002). http://dx.doi.org/10.1117/12.469324 PSISDG 0277-786X Google Scholar
C. L. DarlingG. D. HuynhD. Fried,
“Light scattering properties of natural and artificially demineralized dental enamel at 1310-nm,”
J. Biomed. Opt., 11
(3), 034023
(2006). http://dx.doi.org/10.1117/1.2204603 JBOPFO 1083-3668 Google Scholar
|