
|
|
1.IntroductionLight propagation in scattering media is often described by the radiative transfer theory and its diffusion approximation. These theories are usually based on isotropic models that assume a scattering function and a scattering coefficient that is independent of the direction of light propagation.1–3 However, many scattering media exhibit anisotropic light propagation because of their microstructure. This was found, for example, in nematic crystals,4–6 textile material,7 stretched plastics,8,9 granular porous material, like pressed powders,10 as well as biological media, like skin,11,12 dentin,13 muscles,14–16 and wood.17–20 The anisotropic diffusion theory (DT) was mostly used for the description of these scattering media,4,6,21–25 and in some cases, numerical approaches were also applied to solve the radiative transfer equation using Monte Carlo simulations.13,16,26–28 Measurements to determine the optical properties from reflectance or transmittance data solving the inverse problem were performed, for example, by Johnson and Lagendijk, who analyzed different plastic samples by fitting solutions of the anisotropic diffusion equation.9 Alerstam and Svensson examined porous materials from compacted powders with time-resolved measurements using the anisotropic DT to retrieve the reduced scattering coefficient.10 It was also shown that there is no difference in the shape of the time-resolved solutions between isotropic and anisotropic diffusion models for transmittance measurements opposite to the incident beam. Kienle et al. tested the isotropic diffusion against Monte Carlo simulations of anisotropic media and demonstrated that the absorption coefficient can be retrieved for large separations of source and detector in the time domain, but not from spatially resolved measurements.18,29 Therefore, the isotropic DT was used for time-resolved diffuse optical spectroscopy measurements on wood and tendon with a semi-infinite geometry. In a recent study, Kienle et al. compared the results of Monte Carlo simulations for three different model systems, this time with results of the isotropic as well as the anisotropic DT in forward calculations, and also checked the optical properties retrieved with both diffusion equations.30 In particular, media with aligned cylindrical and additional random scatterers were investigated in semi-infinite and slab geometries. It was shown that in Monte Carlo simulations, the shape of the time-resolved transmittance is only dependent on the reduced scattering coefficient in the direction of the incident beam. This confirms, based on solutions of the radiative transfer theory, that in the direction of illumination can even be obtained by using the isotropic DT when is measured. Furthermore, it was demonstrated that when using values for the reduced scattering coefficient obtained with , the anisotropic DT leads to useful results for the remaining optical properties of structurally anisotropic media in several cases. Recently, Alerstam postulated the need for random walk models for the description of the diffusion coefficients and the distance of the extrapolated boundary in order to obtain meaningful results with the anisotropic DT.31 In the following, this approach was not used since, as mentioned by Alerstam, the random walk model is difficult to implement without previous knowledge of the medium. However, we primarily investigated measurements of applications for which the anisotropic diffusion equation was shown to yield reasonable results for Monte Carlo simulations without these modifications.30 In this study, we present time-of-flight measurements at a single wavelength, , on spruce wood as well as bovine ligamentum nuchae. The anisotropic light diffusion in wood has previously been examined18 and it was shown that can be retrieved quite well with reflectance measurements in semi-infinite geometry for large source detector separations (SDS), even if the isotropic DT is applied. However, results for the reduced scattering coefficient, , strongly change with respect to the orientation of the measurement direction relative to the fibers in the wood. In the present study, we show that the optical parameters retrieved from experiments on both sample types show a similar behavior as described by Kienle et al. for comparisons of DT with Monte Carlo simulations.30 For transmittance measurements on slabs, the optical parameters obtained with the anisotropic DT approach the expected values for increasing SDSs both parallel and perpendicular to the fibers. In contrast, the optical properties derived with the isotropic DT have large errors and only transmittance measurements for yield good results. We confirm the possibility to retrieve from time-resolved reflectance measurements from semi-infinite media. Further, we show that it is possible to retrieve correct values of for a large SDS with the isotropic and the anisotropic DT. However, the anisotropic model already allows retrieval for smaller distances, confirming the findings of the theoretical study on Monte Carlo data.30 For a block of spruce wood, we also present reflectance measurements for orientations of the wood fibers other than parallel or perpendicular to the SDS. The obtained optical parameters are consistent with the results of the transmittance measurements and demonstrate the applicability of the anisotropic DT in the time domain. 2.Methods and Materials2.1.Measurement SetupsThe time-resolved measurements were performed with a time-correlated single photon counting setup as shown in Fig. 1(a). A supercontinuum source (SC450-6, Fianium, Southampton, United Kingdom) provided white-light pulses with a repetition rate of 50.2 MHz, which were fed into an acousto optical tunable filter to select single wavelengths. The experiments were performed at a wavelength of with a spectral bandwidth of 10 nm FWHM, avoiding autofluorescence of the samples present at lower wavelengths. A computer-controlled circular neutral density filter with an optical density between 0 and 4 was used to adjust the count rate of the single photon counting system, ensuring a count rate as high as possible but counts per second. The light was focused with an achromatic lens into a glass fiber with a core diameter of 200 μm and then injected into the sample. The average power at the sample was . Transmitted or reflected photons were collected with a second fiber (core diameter 400 μm) also in contact with the sample surface at an SDS . A hybrid photomultiplier HPM-100-50 and a single photon counting PC board SPC-130 (both Becker&Hickl, Berlin, Germany) were used for detection and recording of the time-of-flight histograms. Fig. 1Sketch of the time-correlated single photon counting setup. The output of the supercontinuum source was connected to the acousto optical tunable filter (AOTF) that selects light with a single wavelength out of the pulsed white light and couples it into a single-mode (SM) fiber with collimators on both ends. The count rate of the experiment was controlled with the circular variable neutral density (ND) filter. The light was coupled into a multimode step index fiber with a core diameter of 200 μm and injected into the sample for transmittance (a) or reflectance (b) measurements. The detection fiber with a core diameter of 400 μm guided the collected light to the hybrid photomultiplier (PMT) that was controlled by the PC via the detector control card (DCC-100). Detector and source were connected to the single photon counting board (SPC-130), which recorded and saved the time-of-flight histograms.  For transmission measurements, the bare ends of the glass fibers were inserted in opposite holders made of black PVC with positioning holes. One of the fibers could be displaced using fine screws to adjust the SDS. For reflectance measurements, the bare fibers were inserted in metal tubes placed in a holder of teflon with positioning holes every 2 mm [Fig. 1(b)]. In both cases, the fiber ends were in contact with the sample surface. Small pieces of black sealing strip around the fiber tips were used to prevent direct illumination or surface reflections. For measurements of the instrument response function (IRF), the fiber ends were placed face to face and were only separated by a 100-μm thin layer of white teflon. The IRF had an FWHM of at 740 nm. Measurements of the spatially resolved steady-state reflectance were also performed at using the optical system as described by Foschum et al.32 In this system, narrow spectral bands of a white-light xenon source are selected by a spectrograph and focused onto the sample with a spot size of . The reflectance signal is then captured by a cooled CCD camera. Additionally, the reflectance from spruce wood samples was also measured with a modified version of the setup with a spot size of and a smaller field of view. 2.2.SamplesMeasurements were performed on two different samples: soft spruce wood and bovine ligamentum nuchae. Spruce wood as a bulk material can be approximately described by a model of cylindrical fibers, representing the tracheids that are oriented in the axial growth direction of the tree or branch, combined with additional random scatterers. The applicability of this model has been verified with Monte Carlo simulations reproducing both the time-resolved and spatially resolved experimental reflectance. In the spatial domain, the simulations clearly showed reflectance patterns of an elongated shape with different orientations to the tracheids depending on the distance from the point of light incidence.18 The samples of wood were all cut from one piece of spruce with the tracheids aligned either parallel or perpendicular to the surface. In particular, three samples of in the - and -directions with the wood fibers oriented in the -direction as shown in Fig. 2(a) with thicknesses of 9.9, 14.8, and 19.8 mm were used. An additional sample of with the tracheids running parallel to the longest side, as in Fig. 2(b), as well as a block with , which represented an optically semi-infinitely extended sample for reflectance measurements, were investigated. All wood samples were air-dry and kept at room temperature. The refractive index of spruce wood was assumed as , based on the estimation for dry soft wood by Kienle et al.18 Fig. 2Sketch of the measurement setup for transmittance measurements. The source fiber is in contact with the bottom side of the spruce wood sample. The detection fiber on the top side can be translated with respect to the incident direction with an SDS of . The tracheids are aligned in the -direction (a), or in the -direction (b). Therefore, the first case is radially symmetric, whereas in (b), the SDS can be increased parallel and perpendicular to the tracheids. For reflectance measurements, both fibers are placed on the top side. In all cases, the illumination is located at .  Bovine ligamentum nuchae has to support the weight of the head and neck and also allow movement in all directions. In order to be of high tensile strength but also be flexible and elastic, it is composed mainly of a system of elastin fibers and collagen fibrils.33 Elastin is one of the most insoluble proteins34 that is, among other specific properties, durable and thermally stable, making it important as a biomaterial and in tissue engineering.35,36 The nuchal ligament of large mammals has one of the highest contents of elastin of any tissue.37 The two main fibrous constituents, elastin and collagen, are linked closely together and arranged parallel to the axis of the ligament. The elastic fibers of the adult ligament are straight cylinders with a diameter between 4 and 14 μm35,38,39 with an amorphous core.40 They are enveloped by collagen fibrils of as a sheath,41 which also fills the space between the elastin fibers.33,35 The composition of the bovine nuchal ligament was determined to be and 15 to 20% of the dry weight for elastin and collagen, respectively,37,42 which agrees with numbers from histological staining.33 The in vivo water content is assumed to be 56.5% of its original weight.37,42 The refractive index of elastin is given by Lansing et al. as 1.534, whereas for water was determined by Hale and Querry.43 Based on these two main components, we estimate a refractive index of for the nuchal ligament. The fresh samples of ligamentum nuchae were obtained from a butcher one to three days before the experiments and were kept cooled in the refrigerator in the intermediate time. The samples were carefully freed from leftover fat and connective tissue with a scalpel, making the fibrous structure clearly visible on the whole surface. The different samples of nuchal ligament were between 10 and 20 mm thick and in the - and -directions with the elastin fibers running parallel to the longest side, similar to that shown in Fig. 2(b). 2.3.Diffusion TheoryIn order to retrieve the optical properties, the solutions of the anisotropic and isotropic diffusion equations in the time domain were used. The transmittance and reflectance for an infinite slab with a thickness is given by with for and for , respectively. , , and are the -, -, and -components of the diffusion tensor that is diagonal if the fibers causing the structural anisotropy are aligned with the cartesian coordinate system, and is the absorption coefficient. The refractive index of the medium is assumed to be independent of direction and is the velocity of light in the medium, with being the speed of light in vacuum. Furthermore, and are given by with . The extrapolated boundary condition was used with , where is the fraction of photons internally reflected at the boundary.44 The computation of the infinite serial in Eq. (1) was restricted to as no difference could be found in the results of forward calculations using a higher number of terms. The solution for the isotropic case can be obtained from the above equations with .The relation of the diffusion tensor elements to the reduced scattering coefficients for different directions was assumed to be where corresponds to the -, -, or -direction. All results in Sec. 3 for the diffusion constants were converted to reduced scattering coefficients using this relation.3.ResultsAll measurements of the spatially resolved steady-state reflectance showed intensity patterns as presented for ligamentum nuchae in Fig. 3(a) and spruce wood in Figs. 3(b) and 3(c). The elongated shapes of the iso-intensity lines clearly have different orientations of the long axis depending on the distance from the point of irradiation. For spruce wood, this observation was made using a modified setup with a smaller light spot with a diameter of , see Fig. 3(c). A model with parallel cylinders and additional random oriented scatterers has been shown to cause these intensity patterns.26 The results demonstrate the applicability of this model for spruce wood as well as the ligament. Fig. 3Spatially resolved reflectance measurement of (a) ligamentum nuchae and of (b) spruce wood, in both cases with a spot diameter of 600 μm for the irradiation, and of (c) spruce wood with a spot diameter of 50 μm. From the center outward, each iso-intensity line stands for a decrease of the signal by half an order of magnitude, i.e., a factor of . The outermost line represents values at 0.01% of the maximum. The iso-intensity lines have elongated shapes because of the fibers that were aligned in the -direction. For large distances, the long axes are orientated in the direction of the elastin fibers or tracheids. As shown in (a) and (c), for small distances from the irradiation point, the long axes are orientated perpendicular to the fibers because of cylinder scattering.  In the following, the results of the time-resolved measurements are presented. On both sample types, the transmittance or reflectance was measured three times at 6 to 20 different positions for every SDS. The error bars in the following figures show the standard deviations over all measurements at different positions. For spruce wood samples with the fibers aligned with the -axis as illustrated in Fig. 2(a), the results were averaged over all the slabs of different thickness. However, the slab with the largest thickness of 19.8 mm yielded results only at because the measured signal count rate was too low at a larger SDS. Solutions of DT for the isotropic and anisotropic models were convolved with the detected IRF and fitted to the measurement data using the Levenberg-Marquardt algorithm in MATLAB®.45 The fitted optical parameters were the absorption coefficient and the reduced scattering coefficient for the isotropic case. When using the anisotropic DT, and the reduced scattering coefficient either parallel or perpendicular to the fibers, namely or , were fitted while setting the reduced scattering coefficient in the respective different direction to the value previously determined with the isotropic diffusion equation for . Additionally, a multiplicative factor was used as a free fit parameter in all cases, and thus, only the shape of each time-resolved measurement curve was considered. The fitting range was chosen from the maximum of the measured curve to 1% of the maximum value on the decreasing slope, and when possible to 0.1% as, for example, for transmittance measurements at . 3.1.WoodAs pointed out, the time-resolved transmittance at was shown to yield the correct result for the reduced scattering coefficient in the direction of the incident beam for a wood model with cylinders even when using the isotropic diffusion equation. 30 In addition, the absorption coefficient can be determined from reflectance measurements with large SDSs.18 The values obtained for these measurements with the isotropic DT are marked with an asterisk and are given in all figures for comparison. For spruce wood, these values are the reduced scattering coefficient parallel to the tracheids from transmittance measurements with (see Fig. 4) as well as in the perpendicular direction (see Fig. 5) and the absorption coefficient obtained from reflectance measurements at large SDSs [see Fig. 6(a)]. Fig. 4Absorption and reduced scattering coefficients obtained by fitting the time-resolved transmittance from slabs of wood with fibers aligned to the -direction with increasing translational distance between illumination and detection fiber. The value for the isotropic diffusion theory (DT) at in (b) is used for reference as in the following. As explained in the text, the reduced scattering coefficient with its standard deviation from transmittance perpendicular to the fibers at , as well as from reflectance measurements for large SDS are given for comparison. 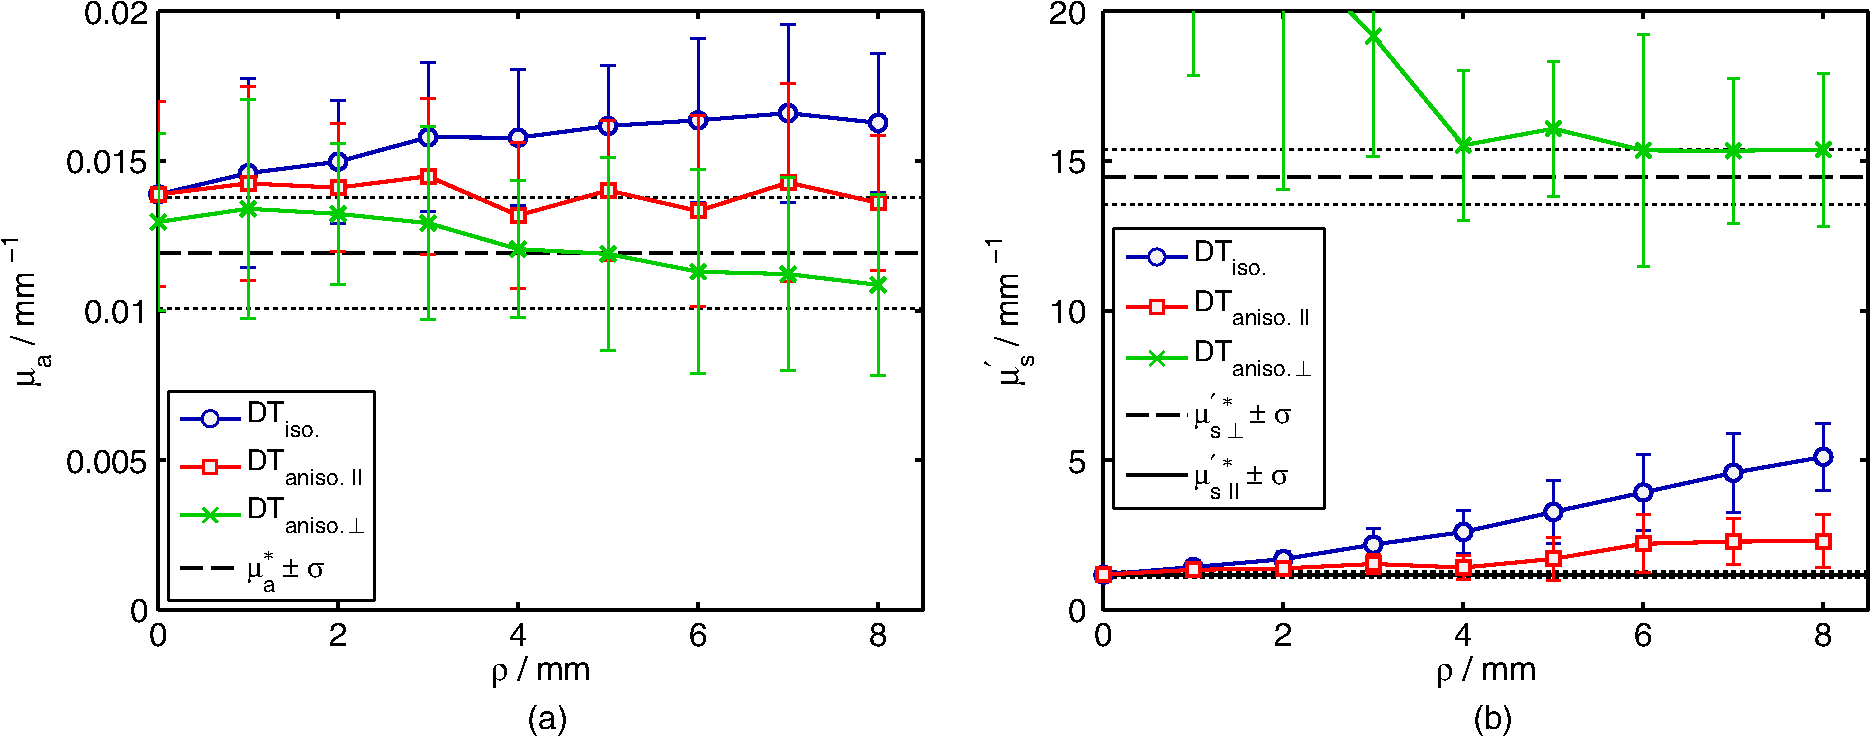 Fig. 5Absorption and reduced scattering coefficients derived from time-resolved transmittance measurements on slabs of wood with fibers aligned along the -direction for the two cases and , where the translation is increased parallel or perpendicular to the wood fibers, respectively. The value for the reduced scattering coefficient at is used as the reference value for comparison in the other figures. For the anisotropic model, the fit parameters are the absorption coefficient and the of the named direction, while the reduced scattering coefficient for the other direction is fixed to the value obtained with the isotropic solution for .  Fig. 6Absorption and reduced scattering coefficients as obtained from time-resolved reflectance measurements on a block of wood with fibers aligned in the -direction for increasing distances from the illumination fiber, and , in direction of and perpendicular to the wood fibers, respectively. In (a) the mean value for the results at an SDS of 10 to 20 mm is used as reference value .  First, the transmittance measurements from slabs of wood with the tracheids aligned along the -axis [see Fig. 2(a)] are presented. Figure 4 shows the results for increasing the translational distance between the illumination and detection fibers. The result obtained for is and is used in the following for comparison. With larger distances, increases due to the increasing influence of the higher scattering . As expected from the results for Monte Carlo data, the values obtained by the isotropic DT rise faster than that for the anisotropic solution with the value for the reduced scattering coefficient perpendicular to the fibers set to . When using the value as a fixed value, the anisotropic DT allows fitting for the reduced scattering coefficient perpendicular to the tracheids, at least for larger SDSs. The trends of the curves are in agreement with the results from Kienle et al.30 Also, the results for show agreement with from reflectance measurements. The constant results for the anisotropic DT and the rising values for the isotropic model are again consistent with the comparison of the results obtained with Monte Carlo simulations.30 Second, we present transmittance measurements with the wood fibers aligned with the -direction, as illustrated in Fig. 2(b). There are two possibilities for the translation of the detection fiber from the illumination point, parallel and perpendicular to the wood fibers, denoted as and , respectively. The results for both measurements are shown in Fig. 5. Again, the reduced scattering coefficient in the direction of the incident light can be obtained with the isotropic DT for , which in this case is . With increasing translational distance between the glass fibers, the results obtained with the isotropic DT decrease because of the increasing dependency on light propagation along the fibers, whereas the anisotropic DT yields good results with small deviations, especially for large distances. This is similar to the results shown in Figs. 16 and 18 of Ref. 30. If illumination and detection fibers are separated in the direction perpendicular to the wood fibers, the intensity drops much faster due to higher scattering, and the maximum SDS that could be measured was . The light propagation is dominated by scattering in the plane perpendicular to the cylindrical wood fibers and, therefore, in the direction of measurement. When fitting for , the isotropic DT yields the same values as the anisotropic DT, since both models reduce to the same equation. The obtained absorption values from these transmittance measurements show good agreement, except for the case where the isotropic DT was used for measurements with translation in the direction of the wood fibers as shown in Fig. 5(a). The obtained negative values indicate the inapplicability of the isotropic model. In the study on Monte Carlo data in Ref. 30, the obtained absorption coefficients also showed similar trends with increasing distance , but mostly overestimated the simulation values by 10 to 20%. For the measurements, the mean values for large SDSs have relative differences up to 6% from , but at the same time, the standard deviations for different measurement positions show differences of to 45% [see error bars in Fig. 5(a)]. Altogether, the results for and are in good agreement with earlier time-resolved reflectance measurements on soft wood,18 where and were obtained for the directions parallel and perpendicular to the tracheids, respectively. They also agree with results from time-resolved transmittance measurements on spruce by Bargigia et al., who determined the optical coefficients for wavelengths from 700 to 1200 nm.20 In a last step, experiments were performed on the block of spruce wood, which can be optically treated as a semi-infinite geometry. The results for the reflectance measurements with increasing SDS are shown in Fig. 6. The scattering in the direction of the wood fibers can be determined quite accurately with the anisotropic DT for between 8 and 14 mm with a relative difference compared to obtained from the transmittance measurements at . For a larger SDS, the obtained results of isotropic and anisotropic DT are very similar and the reduced scattering coefficient is slightly underestimated as compared to . This is similar to results of the study with Monte Carlo data,30 where the anisotropic DT also approaches the expected value but the isotropic DT did not reach it within the examined distances. In contrast to transmittance measurements, it was not possible to determine from the reflectance at an SDS , supposedly because of the small penetration depth due to high scattering (results not shown). For measurements in the perpendicular direction, the strong decrease in intensity allowed the retrieval of the optical properties only at smaller distances. The values of from these measurements are 10 to 15% smaller than the reference value from transmittance measurements. The values for the absorption coefficient shown in Fig. 6(a) have comparable mean values as obtained by the transmittance measurements with the wood fibers aligned along the -direction. However, the standard deviations are significantly smaller. Previous studies comparing the isotropic diffusion equation and Monte Carlo simulations show that the absorption coefficient can be obtained for a large SDS.18 Therefore, the absorption coefficient of the wood samples is obtained as the mean value for the measurements with an SDS between 12 and 20 mm, that is, . This value is used as the reference value in all other figures. The time-resolved reflectance from the block of wood was also measured with the tracheids oriented not only parallel or perpendicular to the measurement direction. For all orientations, the SDS was chosen to be as large as possible, but to still allow sufficient count rates and, therefore, peak levels at least two orders of magnitude higher than the background. The used SDS ranged from 14 mm for the parallel direction to for all angles . The results are shown in Fig. 7. As can be expected, the value of obtained with the isotropic diffusion equation increases with the angle between the wood fibers and the measurement direction. When the anisotropic DT is used, the value for can be determined quite accurately up to an angle of 50 deg. On the other hand, the value of can be determined quite well for angles , even though the results slightly underestimate the value from the transmission measurements . This is in agreement with the results for measurements at a large SDS shown in Fig. 6(b). The values obtained for are comparatively constant over all orientations and also show only small differences regardless of which theory is used. This confirms that time-resolved reflectance measurements allow the retrieval of the absorption coefficient for a large SDS unaffected by the fiber direction. However, these measurements yield mean values that are consistently smaller than those obtained from the reflectance measurements with increasing SDSs, see Fig. 6(b), but still within one standard deviation. Fig. 7Absorption and reduced scattering coefficients obtained from time-resolved measurements of the reflectance from a block of spruce wood with different angles for the orientation of the wood fibers with respect to the -direction. SDS was adjusted from for 0 deg to 6 mm for all angles . To determine the reduced scattering coefficients or , the anisotropic DT was computed with the fixed values for the respective other direction as previously determined by transmittance measurements on slabs for .  3.2.Ligamentum NuchaeThe time-resolved transmittance on the samples of ligamentum nuchae is measured as in Fig. 2(b) with the elastic fibers in the -direction and the translations and , where the SDS is increased parallel or perpendicular to the elastic fibers, respectively. The derived optical parameters are averaged over all measurements on the ligament at different positions with varying thickness from 11 to 16 mm because of the variations in size between the different samples. As for wood, the obtained value for the reduced scattering coefficients for is again taken as a reference value in the direction perpendicular to the elastic fibers. The results for the isotropic DT for a larger SDS decrease toward the lower value of that is reached with the anisotropic DT for a smaller SDS when using as a fixed value, see Fig. 8(b). When the mean of the results for a large SDS is set as given, the anisotropic DT allows us to obtain good results for for measurements in both directions. The isotropic diffusion again yields the same results as the anisotropic equation for measurements with translations , because in that case, both models have the same equation. The obtained values of the absorption coefficient are fairly uniform except for the results obtained with the isotropic diffusion equation for , which again yields negative values. Fig. 8Absorption and reduced scattering coefficients obtained by fitting the time-resolved transmittance from ligamentum nuchae with the elastin fibers aligned to the -direction with increasing distance between illumination and detection fiber, for the two cases and . For the anisotropic DT, is fitted together with of the named direction with the reduced scattering coefficient for the other direction fixed to the value obtained with the isotropic solution for . 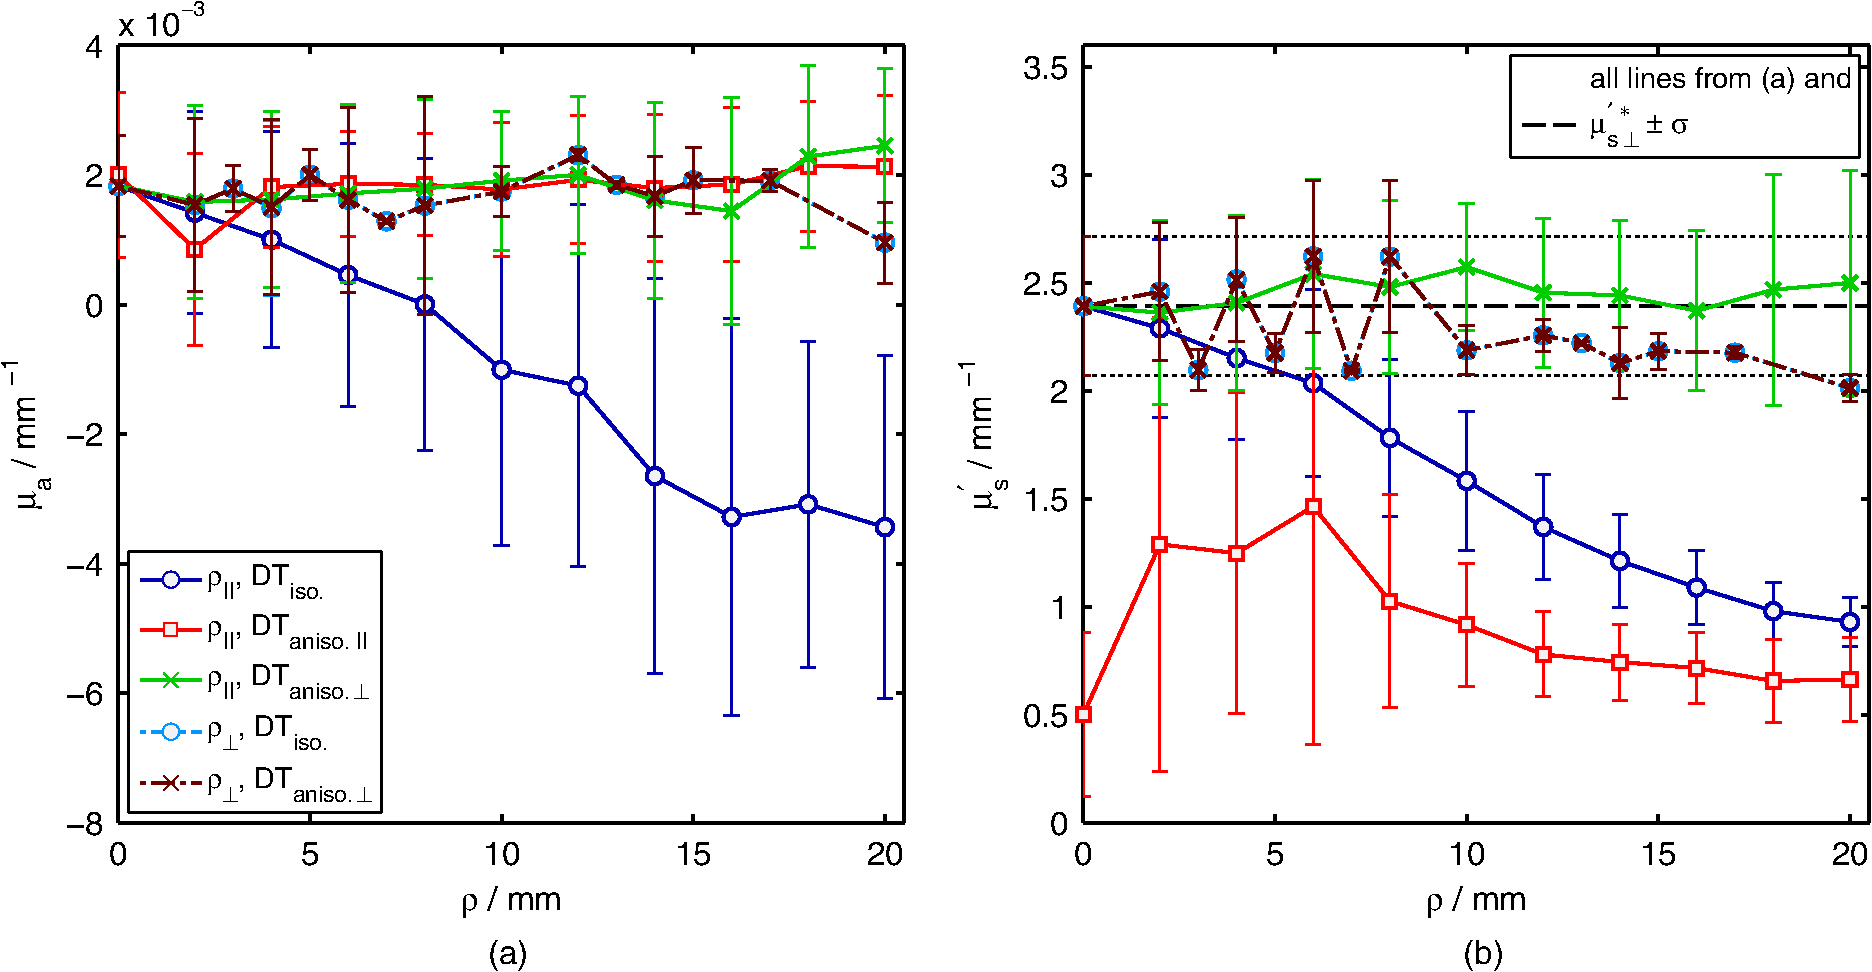 Reflectance measurements on nuchal ligament (not shown) were done for slabs instead of a semi-infinite geometry as for the spruce wood due to the finite size of the ligament samples. For measurements in the direction of the fibers, the isotropic DT results for could only be obtained for measurements with a large SDS. Nevertheless, negative absorption values were obtained, indicating the inacuraccy of the isotropic model. The values for determined with the anisotropic DT leveled off around and, thus, were smaller than for the transmittance measurements. The same behavior could be observed with the wood samples where the results from transmittance measurements at larger SDSs are 15 to 20% higher than (see Fig. 5), whereas the values obtained from the reflectance measured at a large SDS but for a semi-infinite gemoetry instead of a slab are slightly smaller. For increasing , on the other hand, the results rise to the reference value determined from the transmittance measurements. The results for show large deviations for all and yield lower values than the transmittance measurements. So for both models, the obtained optical properties have large differences compared to the expected values from transmittance measurements. With the isotropic DT, it was not even possible to yield results for any but a very large SDS and then negative values were obtained for the absorption coefficient. Overall, the results for the reduced scattering of bovine ligamentum nuchae are comparable to the values determined from measurements on bovine achilles tendon (approximately and ), see Ref. 29. However, in this study,29 the isotropic DT for a semi-infinite geometry was used, which led to deviations because of the finite size of the achilles tendon sample in addition to its composition of different tissue structures. 4.ConclusionThe presented measurements on samples of spruce wood and bovine ligamentum nuchae confirm the results of the theoretical study with Monte Carlo data,30 where the time-resolved anisotropic diffusion equation was shown to yield useful optical parameters for several applications. The anisotropic DT is especially advantageous for retrieving and both components and of the diffusion coefficient. The optical parameters obtained from the measurements presented in this study demonstrate similar behaviors for increasing the SDS as previously observed with Monte Carlo simulations. First, reflectance measurements on semi-infinite geometries yield correct values for at a large SDS as shown earlier18 and as confirmed by the study on Monte Carlo simulations.30 In the present study, we obtained absorption coefficients with both the isotropic and the anisotropic DT, which are consistent with the transmittance measurements and with reflectance measurements using fiber orientations other than parallel or perpendicular. With increasing SDSs the results for approach the same values as measurements of the transmittance that are expected to be correct. This is comparable to the findings from the Monte Carlo simulations.30 When using the anisotropic DT and knowledge of in the other direction, the expected values were reached at smaller SDS than with the isotropic DT. Therefore, in order to retrieve the absorption coefficient of semi-infinite media with structural anisotropy, reflectance measurements at a large SDS yield good values using either the anisotropic or isotropic DT. To obtain results for the scattering coefficient perpendicular to the fibers, measurements at a large SDS are capable of approaching the correct values. The value for can then be obtained using the anisotropic DT from measurements with a large SDS in the direction of the fibers and the previous knowledge of . Second, for transmittance measurements on slabs, the isotropic diffusion equation yields correct optical properties only for detection opposite to the incident beam with . However, this measurement is not possible for all samples or fiber orientations depending on the sample thickness. When using the anisotropic DT, on the other hand, the obtained absorption and reduced scattering coefficients approach the expected values for a large SDS, both parallel and perpendicular to the fibers in the medium. Hence, in the case of slab samples, a first step is given by transmittance measurements at yielding the correct value for the reduced scattering in the direction of the incident light for both models. The other reduced scattering coefficent can then be obtained only by using the anisotropic DT for measurements at a large SDS. In the case of fibers running parallel to the surface, the SDS is preferably chosen as in the direction of the fibers. The absorption coefficient can be determined using the anisotropic DT at a large SDS. When using the isotropic DT, no other SDS than should be used. Overall, for transmittance measurements at a large SDS as well as for reflectance measurements on semi-infinite geometries, it is possible to obtain the optical parameters using the anisotropic diffusion equation. If the isotropic model also approaches the expected optical properties, then the anisotropic DT reaches the correct values already at a smaller SDS. Therefore, we conclude that the anisotropic DT can be used for measurements of the optical properties of structural anisotropic materials for several applications, as was already indicated by comparisons with Monte Carlo simulations.30 AcknowledgmentsThis study received financing from the Deutsche Forschungsgemeinschaft. We gratefully thank the butchery Arthur Laible, Langenau, Germany, for kindly providing several fresh samples of nuchal ligament. The authors thank Nico Bodenschatz and Florian Foschum for helpful discussions and support with the wood samples. ReferencesM. S. PattersonB. ChanceB. C. Wilson,
“Time resolved reflectance and transmittance for the non-invasive measurement of tissue optical properties,”
Appl. Opt., 28
(12), 2331
–2336
(1989). http://dx.doi.org/10.1364/AO.28.002331 APOPAI 0003-6935 Google Scholar
F. Martelliet al., Light Propagation Through Biological Tissue and Other Diffusive Media, SPIE, Bellingham
(2009). Google Scholar
A. Ishimaru, Wave Propagation and Scattering in Random Media, Academic Press Inc., New York
(1978). Google Scholar
H. StarkT. C. Lubensky,
“Multiple light scattering in nematic liquid crystals,”
Phys. Rev. Lett., 77
(11), 2229
–2232
(1996). http://dx.doi.org/10.1103/PhysRevLett.77.2229 PRLTAO 0031-9007 Google Scholar
B. A. van TiggelenR. MaynardA. Heiderich,
“Anisotropic light diffusion in oriented nematic liquid crystals,”
Phys. Rev. Lett., 77
(4), 639
–642
(1996). http://dx.doi.org/10.1103/PhysRevLett.77.639 PRLTAO 0031-9007 Google Scholar
D. S. Wiersmaet al.,
“Time-resolved experiments on light diffusion in anisotropic random media,”
Phys. Rev. E, 62
(5), 6681
–6687
(2000). http://dx.doi.org/10.1103/PhysRevE.62.6681 PLEEE8 1063-651X Google Scholar
B. PengT. DingP. Wang,
“Propagation of polarized light through textile material,”
Appl. Opt., 51
(26), 6325
–6334
(2012). http://dx.doi.org/10.1364/AO.51.006325 APOPAI 0003-6935 Google Scholar
P. M. JohnsonS. FaezA. Lagendijk,
“Full characterization of anisotropic diffuse light,”
Opt. Express, 16
(10), 7435
–7446
(2008). http://dx.doi.org/10.1364/OE.16.007435 OPEXFF 1094-4087 Google Scholar
P. M. JohnsonA. Lagendijk,
“Optical anisotropic diffusion: new model systems and theoretical modeling,”
J. Biomed. Opt., 14
(5), 054036
(2009). http://dx.doi.org/10.1117/1.3253332 OPEXFF 1094-4087 Google Scholar
E. AlerstamT. Svensson,
“Observation of anisotropic diffusion of light in compacted granular porous materials,”
Phys. Rev. E, 85
(4), 040301
(2012). http://dx.doi.org/10.1103/PhysRevE.85.040301 PLEEE8 1063-651X Google Scholar
S. Nickellet al.,
“Anisotropy of light propagation in human skin,”
Phys. Med. Biol., 45
(10), 2873
–2886
(2000). http://dx.doi.org/10.1088/0031-9155/45/10/310 PHMBA7 0031-9155 Google Scholar
A. Russoet al.,
“Intensity profiles of linearly polarized light backscattered from skin and tissue-like phantoms,”
J. Biomed. Opt., 10
(1), 014012
(2005). http://dx.doi.org/10.1117/1.1854677 JBOPFO 1083-3668 Google Scholar
A. Kienleet al.,
“Light propagation in dentin: influence of microstructure on anisotropy,”
Phys. Med. Biol., 48
(2), N7
–N14
(2003). http://dx.doi.org/10.1088/0031-9155/48/2/401 PHMBA7 0031-9155 Google Scholar
G. Marquezet al.,
“Anisotropy in the absorption and scattering spectra of chicken breast tissue,”
Appl. Opt., 37
(4), 798
–804
(1998). http://dx.doi.org/10.1364/AO.37.000798 APOPAI 0003-6935 Google Scholar
T. Binzoniet al.,
“Anisotropic photon migration in human skeletal muscle,”
Phys. Med. Biol., 51
(5), N79
–N90
(2006). http://dx.doi.org/10.1088/0031-9155/51/5/N01 PHMBA7 0031-9155 Google Scholar
C. FanA. ShuaibG. Yao,
“Path-length resolved reflectance in tendon and muscle,”
Opt. Express, 19
(9), 8879
–8887
(2011). http://dx.doi.org/10.1364/OE.19.008879 OPEXFF 1094-4087 Google Scholar
S.-P. Simonahoet al.,
“Laser light scattering from wood samples soaked in water or in benzyl benzoate,”
Optik, 114
(10), 445
–448
(2003). http://dx.doi.org/10.1078/0030-4026-00293 OTIKAJ 0030-4026 Google Scholar
A. Kienleet al.,
“Light propagation in dry and wet softwood,”
Opt. Express, 16
(13), 9895
–9906
(2008). http://dx.doi.org/10.1364/OE.16.009895 OPEXFF 1094-4087 Google Scholar
C. D'Andreaet al.,
“Time-resolved optical spectroscopy of wood,”
Appl. Spectrosc., 62
(5), 569
–574
(2008). http://dx.doi.org/10.1366/000370208784344424 APSPA4 0003-7028 Google Scholar
I. Bargigiaet al.,
“Diffuse optical techniques applied to wood characterisation,”
J. Near Infrared Spec., 21
(4), 259
–268
(2013). http://dx.doi.org/10.1255/jnirs.1068 JNISEI 0967-0335 Google Scholar
P. M. Johnsonet al.,
“Anisotropic diffusion of light in a strongly scattering material,”
Phys. Rev. Lett., 89
(24), 243901
(2002). http://dx.doi.org/10.1103/PhysRevLett.89.243901 PRLTAO 0031-9007 Google Scholar
H. StarkT. C. Lubensky,
“Multiple light scattering in anisotropic random media,”
Phys. Rev. E, 55
(1), 514
–533
(1997). http://dx.doi.org/10.1103/PhysRevE.55.514 PLEEE8 1063-651X Google Scholar
J. Heinoet al.,
“Anisotropic effects in highly scattering media,”
Phys. Rev. E, 68
(3), 031908
(2003). http://dx.doi.org/10.1103/PhysRevE.68.031908 PLEEE8 1063-651X Google Scholar
O. K. Dudkoet al.,
“Photon migration in turbid media with anisotropic optical properties,”
Phys. Med. Biol., 49
(17), 3979
–3989
(2004). http://dx.doi.org/10.1088/0031-9155/49/17/011 PHMBA7 0031-9155 Google Scholar
O. K. DudkoG. H. Weiss,
“Estimation of anisotropic optical parameters of tissue in a slab geometry,”
Biophys. J., 88
(5), 3205
–3211
(2005). http://dx.doi.org/10.1529/biophysj.104.058305 BIOJAU 0006-3495 Google Scholar
A. KienleF. K. ForsterR. Hibst,
“Anisotropy of light propagation in biological tissue,”
Opt. Lett., 29
(22), 2617
–2619
(2004). http://dx.doi.org/10.1364/OL.29.002617 OPLEDP 0146-9592 Google Scholar
T. Yunet al.,
“Monte Carlo simulation of polarized photon scattering in anisotropic media,”
Opt. Express, 17
(19), 16590
–16602
(2009). http://dx.doi.org/10.1364/OE.17.016590 OPEXFF 1094-4087 Google Scholar
T. LinderT. Löfqvist,
“Monte Carlo simulation of photon transport in a randomly oriented sphere-cylinder scattering medium,”
Appl. Phys. B, 105
(3), 659
–664
(2011). http://dx.doi.org/10.1007/s00340-011-4684-z APBOEM 0946-2171 Google Scholar
A. Kienleet al.,
“Determination of the optical properties of anisotropic biological media using an isotropic diffusion model,”
J. Biomed. Opt., 12
(1), 014026
(2007). http://dx.doi.org/10.1117/1.2709864 JBOPFO 1083-3668 Google Scholar
A. KienleF. FoschumA. Hohmann,
“Light propagation in structural anisotropic media in the steady-state and time domains,”
Phys. Med. Biol., 58
(17), 6205
–6223
(2013). http://dx.doi.org/10.1088/0031-9155/58/17/6205 PHMBA7 0031-9155 Google Scholar
E. Alerstam,
“Anisotropic diffusive transport: connecting microscopic scattering and macroscopic transport properties,”
Phys. Rev. E, 89
(6), 063202
(2014). http://dx.doi.org/10.1103/PhysRevE.89.063202 Google Scholar
F. FoschumM. JägerA. Kienle,
“Fully automated spatially resolved reflectance spectrometer for the determination of the absorption and scattering in turbid media,”
Rev. Sci. Instrum., 82
(10), 103104
(2011). http://dx.doi.org/10.1063/1.3648120 RSINAK 0034-6748 Google Scholar
M. Morocuttiet al.,
“Ultrastructure of the bovine nuchal ligament,”
J. Anat., 178 145
–154
(1991). JOANAY 0021-8782 Google Scholar
A. I. Lansinget al.,
“The structure and chemical characterization of elastic fibers as revealed by elastase and by electron microscopy,”
Anat. Rec., 114
(4), 555
–575
(1952). http://dx.doi.org/10.1002/(ISSN)1097-0185 ANREAK 0003-276X Google Scholar
S. J. KirkpatrickM. T. HindsD. D. Duncan,
“Acousto-optical characterization of the viscoelastic nature of a nuchal elastin tissue scaffold,”
Tissue Eng., 9
(4), 645
–656
(2003). http://dx.doi.org/10.1089/107632703768247340 1937-3341 Google Scholar
W. F. Daamenet al.,
“Elastin as a biomaterial for tissue engineering,”
Biomaterials, 28
(30), 4378
–4398
(2007). http://dx.doi.org/10.1016/j.biomaterials.2007.06.025 BIMADU 0142-9612 Google Scholar
E. G. ClearyL. B. SandbergD. S. Jackson,
“The changes in chemical composition during development of the bovine nuchal ligament,”
J. Cell Biol., 33
(3), 469
–479
(1967). http://dx.doi.org/10.1083/jcb.33.3.469 JCLBA3 0021-9525 Google Scholar
M. A. KewleyG. WilliamsF. S. Steven,
“Studies of elastic tissue formation in the developing bovine ligamentum nuchae,”
J. Pathol., 124
(2), 95
–101
(1978). http://dx.doi.org/10.1002/(ISSN)1096-9896 JPTLAS 1096-9896 Google Scholar
W. H. FahrenbachL. B. SandbergE. G. Cleary,
“Ultrastructural studies on early elastogenesis,”
Anat. Rec., 155
(4), 563
–575
(1966). http://dx.doi.org/10.1002/(ISSN)1097-0185 ANREAK 0003-276X Google Scholar
R. Ross,
“The elastic fiber. A review,”
J. Histochem. Cytochem., 21
(3), 199
–208
(1973). http://dx.doi.org/10.1177/21.3.199 JHCYAS 0022-1554 Google Scholar
J. B. FinlayF. S. Steven,
“The fibrous components of bovine ligamentum nuchae observed in the scanning electron microscope,”
J. Microsc., 99
(1), 57
–63
(1973). http://dx.doi.org/10.1111/jmi.1973.99.issue-1 JMICAR 0022-2720 Google Scholar
D. S. JacksonL. B. SandbergE. G. Cleary,
“The swelling of bovine ligamentum nuchae as a function of pH,”
Biochem. J., 96
(3), 813
–817
(1965). BIJOAK 0264-6021 Google Scholar
G. HaleM. Querry,
“Optical constants of water in the 200-nm to 200-μm wavelength region,”
Appl. Opt., 12
(3), 555
–563
(1973). http://dx.doi.org/10.1364/AO.12.000555 APOPAI 0003-6935 Google Scholar
R. C. Haskellet al.,
“Boundary conditions for the diffusion equation in radiative transfer,”
J. Opt. Soc. Am. A, 11
(10), 2727
–2741
(1994). http://dx.doi.org/10.1364/JOSAA.11.002727 JOAOD6 0740-3232 Google Scholar
MATLAB and Optimization Toolbox Release 2008b,
(2008). Google Scholar
BiographyEmanuel Simon is a PhD student at the University of Ulm working at the ILM Ulm in the Materials Optics and Imaging Group of Professor Alwin Kienle on measurements of time-resolved diffuse spectroscopy. He received a master’s degree in physics from the University of Massachusetts in North Dartmouth in 2008 with thesis work in loop quantum cosmology and his diploma in econo physics from the University of Ulm in 2009. Philipp Krauter received his diploma in physics from the University of Ulm in 2012 and is currently a PhD student in the Material Optics and Imaging Group of Alwin Kienle. He is working on light propagation in highly scattering media. Alwin Kienle is the vice director (science) of the Institut für Lasertechnologien in der Medizin and Meßtechnik (ILM), Ulm, Germany, and head of the Materials Optics and Imaging Group at ILM. In addition, he is a professor at the University of Ulm. He studied physics and received his doctoral and habilitation degrees from University of Ulm. As postdoc, he worked with research groups in Hamilton, Canada, and in Lausanne, Switzerland. |


