|
|
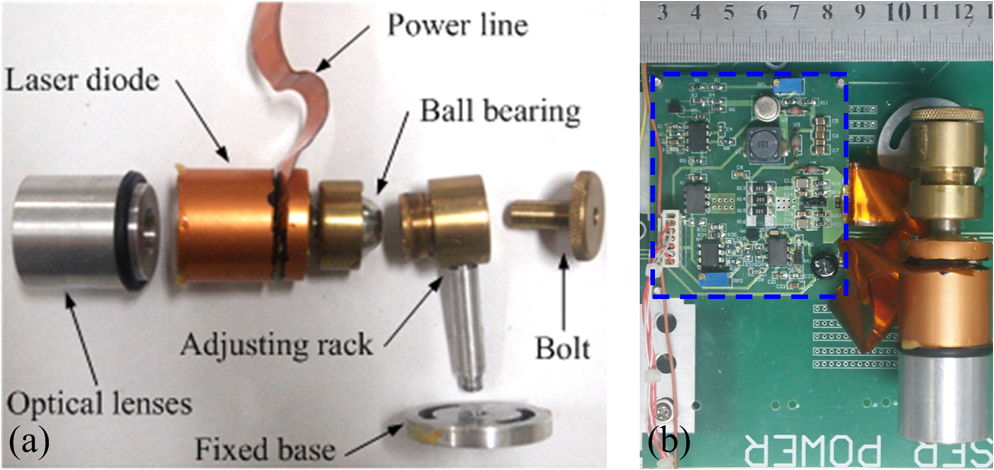
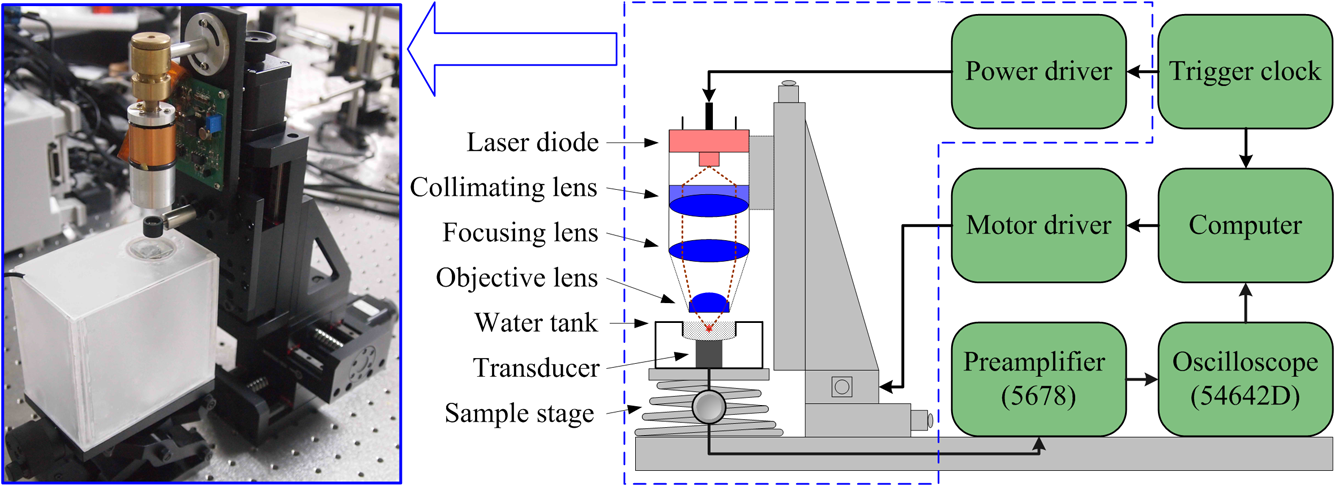
1.IntroductionPhotoacoustic microscopy (PAM) is an emerging biomedical imaging technology which provides high resolution sensing of rich optical contrast at depths beyond other transport- and diffusion-mode optical imaging modalities, and has been successfully applied to structural, functional, and molecular biomedical applications.1,2 Based on the configuration of optical illumination and ultrasonic detection, PAM has two major forms: acoustic-resolution PAM (AR-PAM) and optical-resolution PAM (OR-PAM). In AR-PAM, the imaging resolution, as well as the imaging depth, is scalable with the ultrasonic frequency within the reach of diffuse photons. Typically, it uses a focused ultrasound detector or array (20–100 MHz) to achieve not more than lateral resolution with a maximum imaging depth of in tissue. Reducing the center frequency to 5 MHz could extend the imaging depth to several centimeters and relax the lateral resolution to hundreds of micrometers.3 This lateral resolution is adequate for most large-scale biological tissues. However, higher spatial resolution is required to resolve the smaller structures, such as microvasculature that is in diameter, which require an ultrasonic center frequency of more than 300 MHz.2 Due to high-frequency (HF) ultrasonic attenuation, AR-PAM mode either has a low lateral resolution or shallow imaging depth. For example, a 1.2 GHz ultra HF AR-PAM system has been used to image single melanoma cell and red blood cell with a lateral resolution.4 However, the strong frequency-dependent ultrasonic attenuation ( at 37°C and 1 GHz) limits the penetration depth to tens of microns’ thickness. In contrast, OR-PAM can provide optical diffraction-limited lateral resolution by using focused laser spot excitation, which is directly related to the numerical aperture (NA) of the objective lens. Increasing the NA potentially allows sub-micrometer resolution to be achieved when optical focusing is effective within the soft-depth limit; so far, a penetration of has been achieved.1,5 Recently, an OR-PAM was described with a 220-nm lateral resolution using a high-NA (1.23) water-immersion objective lens. Axial mechanical scanning could maintain high transverse resolution over a large depth range to offset the short length of the objective focal zone.6 Meanwhile, the other performances of OR-PAM have been significantly improved in terms of detection sensitivity, imaging speed, penetration depth, and multimode combination.5–9 Despite the previously described progresses, the cost and size of AR/OR-PAM apparatus are still restricted because of the photoacoustic excitation source. In most cases, a bulky and expensive solid-state laser with a pulse duration of a few nanoseconds and a pulse energy of several millijoules is generally preferred, such as Q-switched Nd:YAG lasers. At present, the pulse repetition frequency (PRF) of flashlamp-pumped laser systems can reach 10–100 Hz while that of diode-pumped solid-state Q-switched lasers is in the kHz range. In order to realize functional PAM, wavelength-tunable laser sources are usually employed, such as Q-switched Nd:YAG pumped OPO, Ti:Sapphire, and a dye laser system. Although commonly used as laboratory tools, such laser systems have been limited in clinical applications by their high cost, large size, and cooling requirements. To increase widespread clinical use, an inexpensive and compact AR/OR-PAM system is required. Laser diodes offer an attractive alternative for all solid-state lasers because they guarantee a low cost, ultra compact, highly reliable, and free-maintenance excitation source for photoacoustics. Moreover, they are readily available from visible to near-infrared (NIR) regions of the wide spectrum with a high-PRF up to 10 KHz. Therefore, they can be embedded in a real-time portable photoacoustic system without cooling circuits and optical table, which offers the possibility for combining different wavelength laser diodes in one system for functional imaging. The technological challenge of this alternative is that the low peak output power is typically limited to to avoid the catastrophic optical damage effect in laser diodes. This results in the induced photoacoustic signal being averaged thousands of times (i.e., 5000–10,000) over a large region for an acceptable signal-to-noise ratio (SNR).10,11 For this reason, laser diode excitation sources have been slowly developed for photoacoustic applications over the last decade. Certainly, there is still some room for mitigation of this disadvantage. A modulated (or coded) excitation technique may be a potential concept to increase the stimulus laser energy.12,13 For example, a photoacoustic system with an intensity-modulated laser diode has been built to image two-dimensional (2-D) rabbit ear vasculature, but it cannot provide depth-direction information about the photoacoustic time of flight for three-dimensional (3-D) imaging.14 Moreover, the long pulsed duration and low modulated frequency of laser diodes limit the excited photoacoustic center frequency to a few megahertz, resulting in a lateral resolution of a few hundreds of micrometers, which is far from the micron-scale level of microscopy.10–16 In this study, we investigated a cost-efficient laser-diode-based OR-PAM (LD-OR-PAM) system by adopting an optical-resolution illumination mode, which should make it possible to retrieve high lateral resolution with relatively low pulse energies. In order to validate the prototype, preliminary 2-D and 3-D photoacoustic images of small animal and blood vessel phantoms were clearly reconstructed. The experimental results demonstrated the potential utility of a semiconductor light source for an inexpensive and miniaturized OR-PAM apparatus. 2.Materials and MethodsAn NIR-pulsed laser diode (905D4S16C, Laser Components, Montreal, Canada) is used as a photoacoustic pumping source. The 2-D-stack chip of the laser diode has a peak output power of 140 W, and consists of four micro-optical elements with an active region of . The full width at half maximum (FWHM) spectral bandwidth is 5 nm with a temperature coefficient of for a stable center wavelength of 905 nm. The junction areas of the single elements for the diode array have different widths, and this leads to different divergence angles in the fast and the slow axes, such as 30 deg for the fast axis and 12 deg for the slow axis. The laser diode was driven by a home-made laser driver capable of supplying a 30 A peak forward current in pulses and a 1.2 A threshold current. The PRF and duration of the laser driver were 0.8 KHz and 100 ns, resulting in an ultra-low duty cycle of 0.08% (typically, ) for a minimal thermal effect. The structure of the compact laser diode source is shown in Fig. 1(a). It employed an optical lens group to project laser pulses at a long focus length of 15 cm whose clear aperture (CA) is 10 mm with a full-angle divergence of 3.0 mrad (-values). In order to focus accurately, the laser diode integrated with the optical lens group was fixed on a 3-D adjustable stage. An aspheric objective lens (352340B, LightPath, Orlando, Florida) with an NA of 0.62 was used to achieve the microscope optical resolution. The CA of the objective lens is 5.0 mm with an effective focal length of 4.0 mm. In Fig. 1(b), the compact structures of the laser diode source and its driver are only approximate to and , respectively. The schematic and photograph of the LD-OR-PAM system are shown in Fig. 2. During a 20-min warm-up period, the focused diode laser was projected onto the phantom for photoacoustic generation. A 1–3 composite ultrasonic transducer (I5P10N, Doppler, Guangzhou, China) was used as a forward-mode sensor with a center frequency of 4.53 MHz and a bandwidth of 152.8%. The diameter of the active element is 10 mm, and the relative pulse-echo sensitivity is . The excited photoacoustic signal captured by the transducer was amplified by a 40 dB preamplifier (5678, Olympus, Waltham, Massachusetts), then synchronously recorded by signal averaging 128 pulses with a mixed-signal oscilloscope (54642D, Agilent, Palo Alto, California), and finally transferred to a personal computer with an interface card (GPIB-USB-HS, National Instruments, Austin, Texas). In our experiment, the oscilloscope features an 8-bit analog-to-digital converter with a maximal sampling rate of . Raster scanning is controlled by the computer, which triggers the oscilloscope to capture the photoacoustic signal. The trigger signal is synchronized with the clock-out signal from the laser diode driver. The 2-D raster scanning is implemented by translating the laser diode source along the horizontal plane. Therefore, the photoacoustic volumetric data set is obtained and can be reconstructed with 2-D maximum amplitude projection (MAP) images and 3-D surface renderings. 3.ResultsDue to the relatively low peak power of laser diode, which is several orders of magnitude less than that of a Q-switch solid-state laser, special attention should be paid to the SNR of the diode laser-induced photoacoustic signal. To demonstrate the generation of detectable photoacoustic signals, single point measurements were made on a human hair sample. Figure 3 shows the time-resolved photoacoustic pressures recorded by signal averaging 8, 32, and 128 pulses, respectively. It can be seen that the effective photoacoustic signal has a peak-to-peak voltage of and an upper SNR of 11 dB, where the SNR is defined as the ratio of the signal peak value to the average value of the noise. Therefore, an acceptable SNR could be obtained by optical-resolution illumination with a lower averaging number than that of acoustic-resolution mode (i.e., 5000–10.000).10,11 Fig. 3(a)–(c) Time-resolved photoacoustic pressures recorded by signal averaging 8, 32, and 128 pulses, respectively, (d) corresponding frequency spectrum of the effective photoacoustic signal.  The corresponding frequency spectrum of the effective photoacoustic signal is shown in Fig. 3(d), which has a FWHM of . The cutoff frequency of the photoacoustic transient is approximately 8.0 MHz, which basically corresponds to the reciprocal of the pulse duration of 100 ns. It is far below that of most other OR-PAM systems (e.g., 100 MHz at duration), resulting in a predominance of lower frequency-dependent acoustic attenuation. 3.1.Two-Dimensional Imaging at Different ScalesAs previously measured, the lateral resolution of our system is estimated to be , which is suitable for imaging blood vessels of varied diameters.17 Figure 4(a) shows a 2-D photoacoustic MAP image of a group of carbon fibers (Type, T300-1K) as small as microvasculature. An imaging field-of-view (FOV) of was scanned with a step size of . It can be seen, where two carbon fibers were superposed on the right side, that the geometric shape and relative position of the carbon fibers were clearly reconstructed. Figure 4(b) gives the corresponding cross-sectional profile of the carbon fibers as indicated by the white dashed line in Fig. 4(a). The intensity variation is about 33% with six peaks clearly depicted in Fig. 4(b). Figure 4(c) shows a 2-D photoacoustic MAP image of a blood vessel phantom with a larger FOV of . The blood vessels approximately range in diameter from 50 to . The vessels consist of Chinese ink dye ( at 905 nm) printed on a cover glass. Fig. 4(a) 2-D photoacoustic MAP image of carbon fibers, (b) the corresponding cross-sectional profile of the carbon fibers as indicated by the white dashed line in (a), (c) 2-D photoacoustic MAP image of blood vessel phantom. Normalized photoacoustic amplitude (NPA).  To demonstrate the feasibility of imaging small animals, we chose a dead ant for tomography as depicted in Fig. 5(a). The body of the ant has a length of and a varying diameter of between 1 mm down to less than 0.3 mm (between the caput and metasoma). The length of the trotters varies between 1.5 and 3.5 mm with a diameter of . To avoid movement of the ant during imaging (e.g., bending of feelers or trotters), we fixed it on a cover glass with a water-resistant gelatin. Figure 5(b) shows the 2-D photoacoustic MAP image (imaging FOV, ) by the LD-OR-PAM system, and Fig. 5(c) gives the cross-sectional scan (B-scan) image along the white dotted line in Fig. 5(b). These images characterize the spatial shape and size of the ant. Fig. 5(a) Anatomic schematic of an ant, (b) 2-D photoacoustic MAP image of the ant, (c) 2-D photoacoustic B-scan image along the white dashed line in (b). Normalized photoacoustic amplitude (NPA).  For reconstruction, we used original data without any signal processing, and no filtering or smoothing was applied. Therefore, the bright spot of the trotters and the somewhat lower contrast at the trunk region attract attention. The photoacoustic signal is proportional to the local energy density times the Grüneisen coefficient. Thus, the optical absorption should be approximately the same for all parts of the ant. However, due to the Gaussian intensity profile of the focused diode laser, regions away from the focal zone create weaker signals, resulting in a sharp deterioration of image quality and sharpness. With axial scanning, different regions of interest could be obtained over a large depth range to offset the short optical focal zone, and a 3-D view can be formed with a series of 2-D horizontal cross sections by selecting signals according to their arrival times.5 3.2.Three-Dimensional Surface Rendering for Volume VisualizationUses of 3-D photoacoustic reconstruction would lead to efficient, effective, and accurate volume visualization in perceiving and understanding the complexity of an object’s shape. In order to validate the possibility of 3-D imaging by the LD-OR-PAM system, a blood vessel phantom was prepared with human hairs with a diameter of . Figure 6(a) shows the 2-D photoacoustic MAP image with an imaging FOV of . Meanwhile, Figure 6(b) gives the corresponding 3-D surface rendering with a viewpoint of , which specifies a viewing angle for a 3-D space in terms of the azimuth and elevation. It can be seen that the phantom structure has been reconstructed and matches well. Figure 6(c) shows a typical 3-D surface rendering with a viewpoint of , and Fig. 6(d) shows the enlarged 3-D surface rendering of an individual human hair with a viewpoint of marked in Fig. 6(c). The 3-D volumetric structure of the human hair phantom has been integrally visualized, and the vessel wall can be clearly resolved. Fig. 6(a) 2-D photoacoustic MAP image of the human hair phantom; arrows denote human hairs, (b) corresponding 3-D photoacoustic surface rendering with a viewpoint of , (c) typical 3-D photoacoustic surface rendering with a viewpoint of , (d) enlarged 3-D rendering marked in (a) with a viewpoint of . Normalized photoacoustic amplitude (NPA). 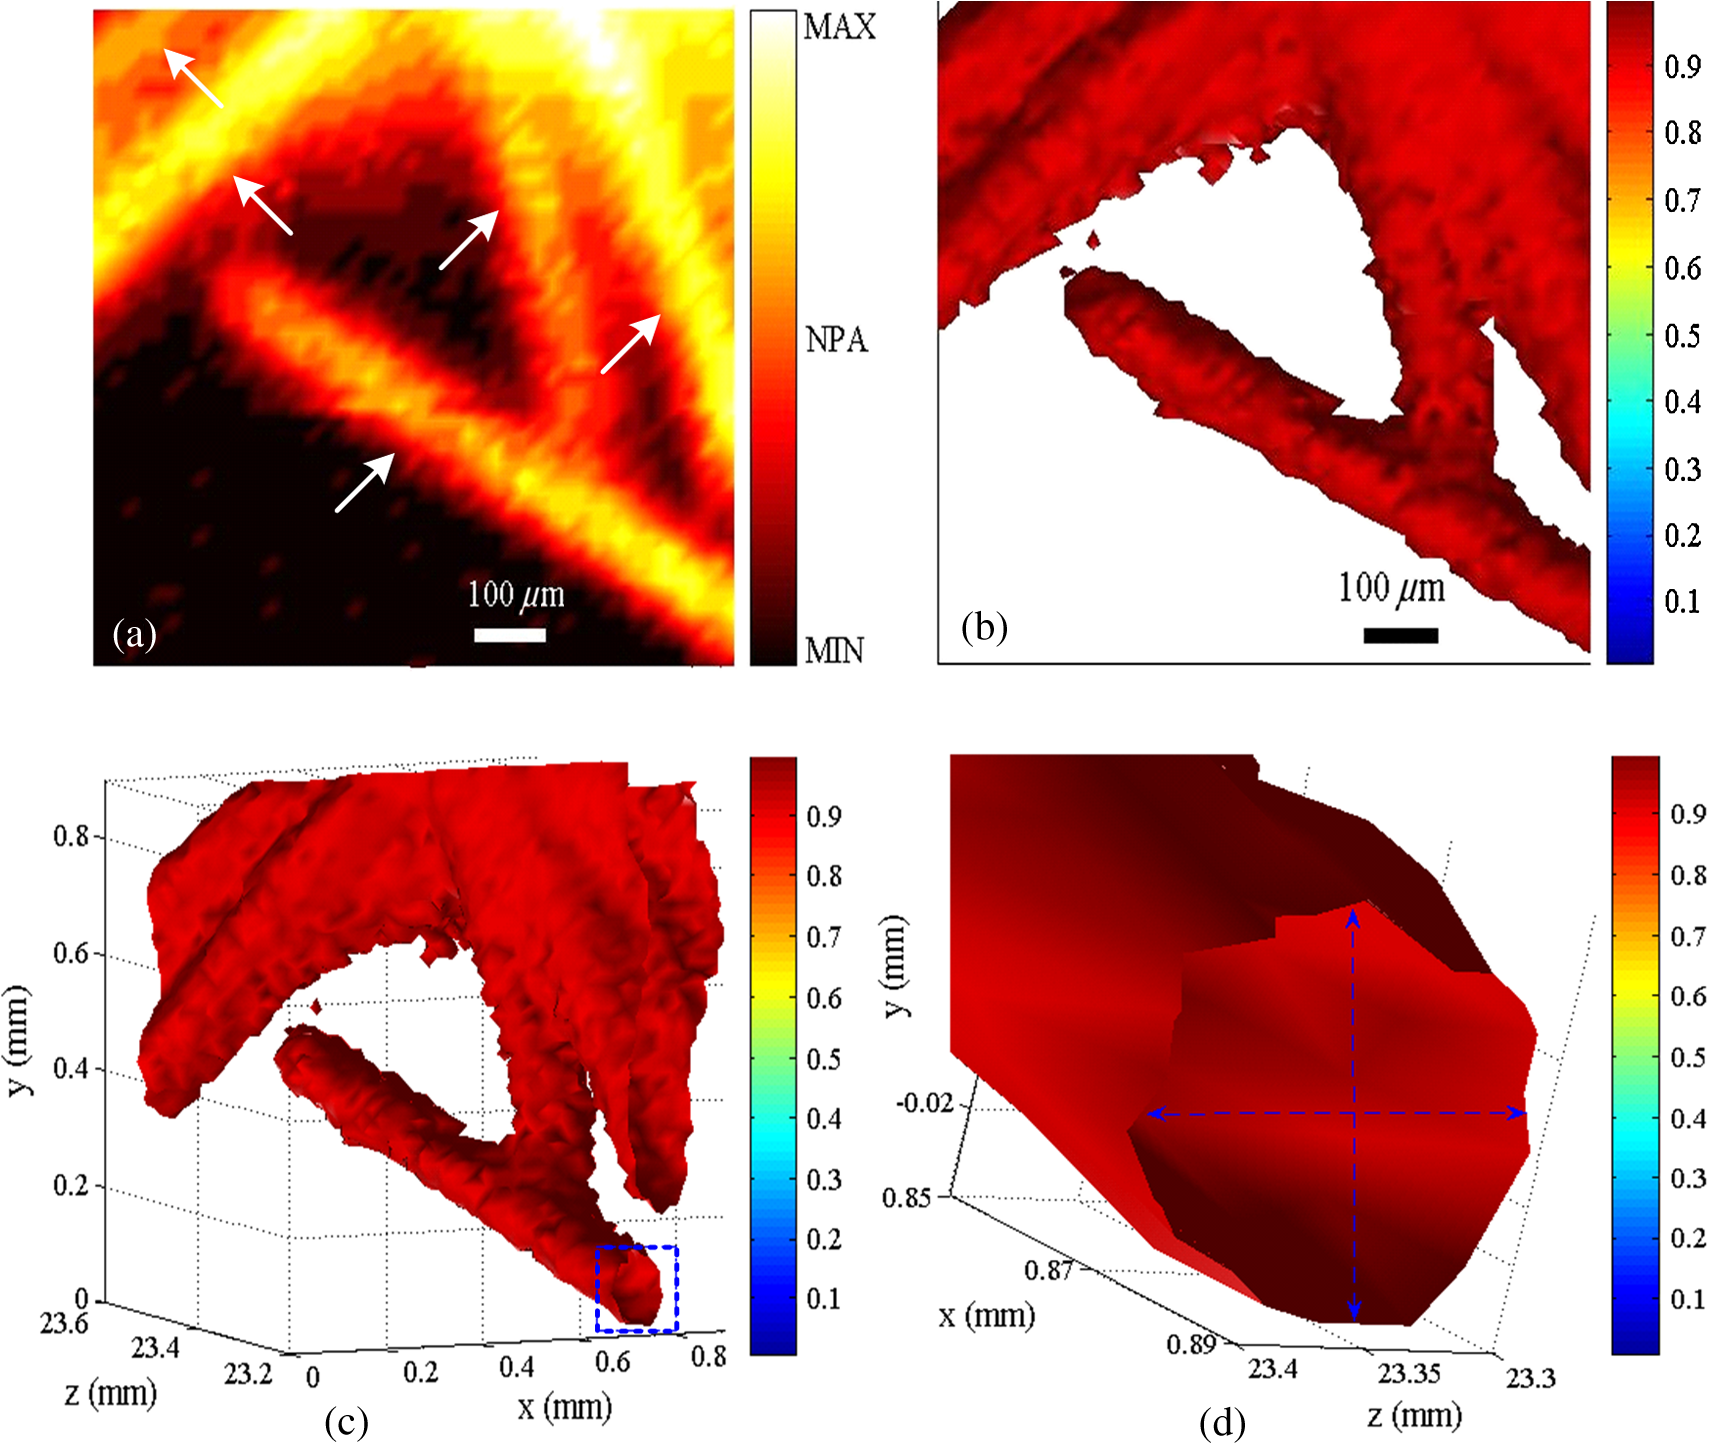 In the reconstruction, a marching cubes (MC) algorithm has been used for extracting a polygonal mesh (sometimes called a voxel) of an iso-surface from a 3-D scalar field,15,18 which is the main concern of medical visualizations such as computed tomography and magnetic resonance imaging. In Figs. 6(b)–6(d), the voxel size is . Rendering a 2-D photoacoustic projection of the 3-D data set requires every sample value to have a defined opacity and color in the volume, which has been done with a simple ramp function to project an RGBA (for red, green, blue, and alpha) value in our experiments. 4.Discussions and ConclusionsFor potential clinical applications, the maximum permissible exposure (MPE) that the LD-OR-PAM can apply is subject to the American National Standards Institute (ANSI) safety standards for the skin. The MPE for a single laser pulse (duration between 1 and 100 ns) is , where the spectral correction factors, CA is 1 for to 700 nm, are for to 1050 nm, and 5.0 for to 1400 nm.19 In the experiments, the laser pulse energy after the imaging objective was measured to be with a light loss of . As the optical focus is 100 μm beneath the skin’s surface, the surface laser fluence is calculated to be , which is less than the ANSI safety limit of at . So far, most high peak power pulsed laser diodes investigated for photoacoustics operate in the NIR wavelength range (i.e., 850, 905, and 1550 nm are the only commercially mature wavelengths).10–17 However, operating in the Q-band of the hemoglobin absorption spectrum (i.e., 550–600 nm), where blood is strongly absorbent () and water absorption is weak (), could allow high contrast photoacoustic images of the superficial vasculature to be achieved. Commercial pulsed and continuous-wave laser diodes in the visible wavelength range (400–700 nm) are available, but provide a peak output power of only hundreds of milliwatts,14 which is about three orders of magnitude less than that of the NIR laser diode. Therefore, special attention should be paid to improving the SNR of the upcoming LD-OR-PAM with the visible laser diode source. On the other hand, as another semiconductor light source, light emitting diodes (LEDs), which have recently been successfully used for biomedical photoacoustics,20,21 are widely available in the visible wavelength range (400–632 nm), and provide an average output power of several watts. Such a visible multiple-wavelength LEDs scheme has the potential to realize the functional OR-PAM of superficial vascular anatomy over the next few years. In summary, we developed a cost-efficient LD-OR-PAM system for 2-D and 3-D imaging of small ant and blood vessel phantoms. Compared to the existing OR-PAM systems with solid-state lasers, it has the desirable properties of being cheap, compact, and durable. The initial study demonstrated the potential for using laser diodes as an inexpensive and compact excitation source for OR-PAM. It may represent a clinical step toward OR-PAM technology with a promising semiconductor light source for superficial biomedical applications, such as skin melanoma diagnosis. AcknowledgmentsThis research is supported in part by the National Natural Scientific Foundation of China (11304129, 11374094), the Science and Technology Pillar Program of Jiangxi Province (2009BSA12700), the Scientific Research Foundation of Jiangxi Provincial Education Bureau (GJJ13581), and the Intramural Top-notch Youth Talent Program (2013QNBJRC003). ReferencesL. V. WangS. Hu,
“Photoacoustic tomography: in vivo imaging from organelles to organs,”
Science, 335
(6075), 1458
–1462
(2012). http://dx.doi.org/10.1126/science.1216210 SCIEAS 0036-8075 Google Scholar
K. Maslovet al.,
“Optical-resolution photoacoustic microscopy for in vivo imaging of single capillaries,”
Opt. Lett., 33
(9), 929
–931
(2008). http://dx.doi.org/10.1364/OL.33.000929 OPLEDP 0146-9592 Google Scholar
K. SongL. V. Wang,
“Deep reflection-mode photoacoustic imaging of biological tissue,”
J. Biomed. Opt., 12
(6), 060503
(2007). http://dx.doi.org/10.1117/1.2818045 JBOPFO 1083-3668 Google Scholar
E. StrohmE. BerndlM. Kolios,
“High frequency label-free photoacoustic microscopy of single cells,”
Photoacoust., 1
(3–4), 49
–53
(2013). http://dx.doi.org/10.1016/j.pacs.2013.08.003 0278-2901 Google Scholar
C. ZhangK. MaslovL. V. Wang,
“Subwavelength-resolution label-free photoacoustic microscopy of optical absorption in vivo,”
Opt. Lett., 35
(19), 3195
–3197
(2010). http://dx.doi.org/10.1364/OL.35.003195 OPLEDP 0146-9592 Google Scholar
S. HuK. MaslovL. V. Wang,
“Second-generation optical-resolution photoacoustic microscopy with improved sensitivity and speed,”
Opt. Lett., 36
(7), 1134
–1136
(2011). http://dx.doi.org/10.1364/OL.36.001134 OPLEDP 0146-9592 Google Scholar
Y. YuanS. YangD. Xing,
“Optical-resolution photoacoustic microscopy based on two-dimensional scanning galvanometer,”
Appl. Phys. Lett., 100
(2), 023702
(2012). http://dx.doi.org/10.1063/1.3675907 APPLAB 0003-6951 Google Scholar
P. Shaoet al.,
“Integrated micro-endoscopy system for simultaneous fluorescence and optical-resolution photoacoustic imaging,”
J. Biomed. Opt., 17
(7), 076024
(2012). http://dx.doi.org/10.1117/1.JBO.17.7.076024 JBOPFO 1083-3668 Google Scholar
L. Xiet al.,
“Miniature probe combining optical-resolution photoacoustic microscopy and optical coherence tomography for in vivo microcirculation study,”
Appl. Opt., 52
(9), 1928
–1931
(2013). http://dx.doi.org/10.1364/AO.52.001928 APOPAI 0003-6935 Google Scholar
R. KolkmanW. SteenbergenT. Leeuwen,
“In vivo photoacoustic imaging of blood vessels with a pulsed laser diode,”
Lasers Med. Sci., 21 134
–139
(2006). http://dx.doi.org/10.1007/s10103-006-0384-z LMSCEZ 1435-604X Google Scholar
T. AllenP. Beard,
“Pulsed near-infrared laser diode excitation system for biomedical photoacoustic imaging,”
Opt. Lett., 31
(23), 3462
–3464
(2006). http://dx.doi.org/10.1364/OL.31.003462 OPLEDP 0146-9592 Google Scholar
M. Mienkinaet al.,
“Multispectral photoacoustic coded excitation imaging using unipolar orthogonal Golay codes,”
Opt. Express, 18
(9), 9076
–9087
(2010). http://dx.doi.org/10.1364/OE.18.009076 OPEXFF 1094-4087 Google Scholar
S. SuP. Li,
“Coded excitation for photoacoustic imaging using a high-speed diode laser,”
Opt. Express, 19
(2), 1174
–1182
(2011). http://dx.doi.org/10.1364/OE.19.001174 OPEXFF 1094-4087 Google Scholar
K. MaslovL. V. Wang,
“Photoacoustic imaging of biological tissue with intensity-modulated continuous-wave laser,”
J. Biomed. Opt., 13
(2), 024006
(2008). http://dx.doi.org/10.1117/1.2904965 JBOPFO 1083-3668 Google Scholar
L. Zenget al.,
“3D-visual laser-diode-based photoacoustic imaging,”
Opt. Express, 20
(2), 1237
–1246
(2012). http://dx.doi.org/10.1364/OE.20.001237 OPEXFF 1094-4087 Google Scholar
P. LeBoulluecH. LiuB. Yuan,
“A cost-efficient frequency-domain photoacoustic imaging system,”
Am. J. Phys., 81
(9), 712
(2013). http://dx.doi.org/10.1119/1.4816242 AJPIAS 0002-9505 Google Scholar
L. Zenget al.,
“Portable optical-resolution photoacoustic microscopy with a pulsed laser diode excitation,”
Appl. Phys. Lett., 102
(5), 053704
(2013). http://dx.doi.org/10.1063/1.4791566 APPLAB 0003-6951 Google Scholar
W. E. LorensenH. Cline,
“Marching cubes: a high resolution 3D surface construction algorithm,”
Comput. Graph., 21
(4), 163
–169
(1987). http://dx.doi.org/10.1145/37402 0278-2901 Google Scholar
ANSI Z136.1-2007: American National Standard for Safe Use of Lasers, New York, New York
(2007). Google Scholar
Y. AdachiT. Hoshimiya,
“Photoacoustic imaging with multiple-wavelength light-emitting diodes,”
Jpn. J. Appl. Phys., 52
(7), 07HB06
(2013). http://dx.doi.org/10.7567/JJAP.52.07HB06 JJAPA5 0021-4922 Google Scholar
T. AllenP. Beard,
“Light emitting diodes as an excitation source for biomedical photoacoustics,”
Proc. SPIE, 8581 85811F
(2013). http://dx.doi.org/10.1117/12.2004471 PSISDG 0277-786X Google Scholar
|