

|
|
1.IntroductionThe propagation of light in biological tissue can be analytically modeled by radiative transport theory.1 The light-scattering process under the framework of the radiative transport theory is described by the scattering coefficient and the scattering phase function. The scattering coefficient is defined as the total scattering cross section (TSCS) per unit volume of tissue.2,3 The scattering coefficient also gives the probability of a scattering interaction per unit distance traveled. The scattering phase function, defined as the normalized differential cross section, is the probability density function of a photon being scattered at a scattering angle. These two scattering properties are important and essential parameters for modeling photon migration in biomedical applications such as quantitative spectroscopy, diffuse optical tomography,1,4,5 and photodynamic therapy.6,7 One potential application of clinical significance is to use these properties as a marker for early detection of epithelial precancer/cancer. In particular, the cellular morphologies and structural heterogeneities of stratified squamous epithelia are altered during the progression of epithelial cancers.8–10 Therefore, the scattering coefficients of stratified squamous epithelia may be a useful indicator to distinguish precancer/cancer from normal tissue. Accurate measurements of scattering coefficients of stratified squamous epithelia are difficult to obtain. The epithelial layer is too thin to lift off for measuring the scattering coefficients by utilizing conventional methods such as the integrating sphere11 and collimated transmission methods. Prior efforts attempting to extract the scattering coefficients of the epithelial tissue can be categorized into two groups: those based on backscattered light measurements of in vivo or fresh ex vivo tissue, and those based on two-dimensional (2-D) quantitative phase images of thin slices of tissue blocks. In the first category, the attenuation coefficient of bulk tissue, consisting of the some of the scattering and absorption coefficients, is extracted by fitting the depth-dependent decay of reflected light [measured using reflectance confocal microscopy8,12 or optical coherence tomography (OCT)13–18] to single-scattering13,14 or multiple-scattering models.15,19,20 In the visible and near-infrared region, the absorption coefficient of the epithelial tissue is significantly lower than the scattering coefficient, and thus the measured attenuation coefficient approximates to the scattering coefficient.21 These methods have limited accuracy because they rely on the assumptions of depth-independent reflectivity or backscattering cross section,8,12,13,15–19,22 a fixed fraction of the attenuated light being backscattered,14 a certain spatial distribution of refractive indices (RI),17 or a certain scattering phase function12 in tissue. Although many methods have been demonstrated to measure the average RI of bulk tissue based on the focus-tracking or bifocal optical coherence tomography23–25 and the critical angle method,26 there is still no suitable method for obtaining the spatially resolved RI values of fresh epithelia. Arifler et al. obtained the RI distributions of stratified squamous epithelial tissue from Feulgen-thionin stained cervical biopsies.27 The results revealed that the different layers of the epithelial tissue, such as the superficial, intermediate, and basal layers, show distinct morphologies and RI distributions. Therefore, the scattering properties, such as backscattering cross section and scattering phase function of different layers, are expected to differ.27 As an alternative, Wang et al.28 and Xu29 have proposed to determine the scattering coefficient from the spatial variance of the phase shifts and the physical thickness of thin slices of tissue blocks, based on the first-order Born approximation. This method provides a convenient and feasible way to investigate both the quantitative structural information and the spatially resolved scattering coefficients of ex vivo tissue specimens. The quantitative structural information helps the interpretation of the determined scattering properties and provides complementary cellular-level morphologies and RI for clinical diagnosis. Due to the intrinsic limitations of quantitative phase microscopy, however, this method is limited to imaging thin slices of tissue blocks. Thin tissue slices are commonly cut from frozen or paraffin-embedded tissue blocks. Figure 1 shows the hematoxylin and eosin (HE) stained image of a frozen section of human oral epithelial tissue. The morphology of cellular structures has been significantly altered, including nuclear shrinkage and empty voids between nuclei and cytoplasm.30 Hence, the frozen sections are inappropriate to determine the scattering properties of tissue. Thin slices from paraffin-embedded tissue blocks show less morphological alterations than frozen tissue slices and have been extensively used as a standard in pathologic diagnosis. Previous studies have reported the changes in cell and tissue volumes after fixation31,32 and paraffin embedding removal processes.33 An increase in the average RI of HE stained paraffin sections compared to nonstained frozen sections has also been shown.34 However, the influences of the paraformaldehyde (PFA) fixation and paraffin embedding removal processes on these structures, RI distributions, and scattering properties of cells and tissue have not been fully elucidated. To help interpret the RI and scattering properties derived from quantitative phase images of thin slices of tissue, knowledge of the effects of these processes on cells and tissue is essential. We measured the three-dimensional (3-D) RI distributions and volumes of epithelial cells in a live state and after both processes. The quantitative 3-D RI distributions were used to calculate the TSCS of the cells before and after processing. The results give insight into the influences of PFA fixation and paraffin embedding removal on the volume shrinkage, RI distributions, and scattering properties of epithelial tissue. Based on the results, we propose simple methods for compensating the cell shrinkage and alterations in RI distributions stemming from the paraffin embedding removal processes. We demonstrate the applications of the compensation methods to estimate the spatially resolved scattering coefficient and RI of human oral epithelial tissue from 2-D quantitative phase images of thin slices of tissue. 2.Materials and Methods2.1.Instrumentation: Digital Holographic MicrotomographyIn this study, 2-D phase images and 3-D RI distributions of specimens were acquired using microtomography (), which is described in detail elsewhere.35,36 The is essentially a Mach–Zehnder interferometer equipped with two galvanometer mirrors and a piezoelectric transducer. The light source is a 532-nm continuous wave diode-pumped solid-state laser and is divided into sample and reference beams. The illumination direction of the sample beam is controlled by the mirrors. The transmitted scattered field of the sample is delivered to a high-speed CMOS camera (Point Grey Co., Canada; Gazelle Model) by the objective (Olympus UPLSAPO 100, 1.4 NA, Japan) and tube lenses and interferes with the reference beam on the camera. For each angle of illumination, six consecutive phase-shifted interferograms were recorded for calculating one scattered field, including the amplitude and phase images. We used the circular scanning strategy in this experiment. In circular scanning, the illumination angle of the incident beam is scanned over azimuthal angles at 10 polar angles with respect to the optical axis of the objective lens. This can improve the axial resolution due to a higher coverage in the Fourier domain of RI distributions.35,37 The 3-D RI distributions of the specimens were reconstructed using the optical diffraction tomography algorithm. Lateral and transverse resolutions were , and the recording time of a single tomogram, reconstructed from 480 scattered fields at different illumination angles, was 28.8 s. 2.2.Analysis of Dry Mass, Volume, and Total Scattering Cross Section of Epithelial CellsWe imaged live HeLa cells, a human epithelial carcinoma cell line. Cells were cultured on poly-L-lysine coated cover slips and incubated at 37°C and 5% for 24 h before measurements. The 3-D RI distributions of the cells were obtained by .36 Subsequently, the cells were fixed with 4% PFA solution, made by adding 4 g PFA powder to 100 mL phosphate buffered saline (PBS). The solution was heated to 60°C until the PFA powder was completely dissolved.38 The RI distributions of fixed cells were measured 1 h after fixation. After imaging, the cells were processed using standard paraffin-embedding procedures.30 Afterward, the cells were deparaffinized with xylene, hydrated with an alcohol gradient, and washed with PBS. The cells were finally immersed in PBS for measuring the 3-D RI distributions by . The volume of a cell can be determined using the 3-D RI distribution. The dry mass of a cell equals the biomolecular concentration times the volume of the cell. The biomolecular concentration is calculated from its 3-D RI distribution based on the relationship39 Here, is the RI of the medium measured to be 1.337 using a commercial refractometer; is the RI of the cell; is the specific RI increment, typically for biological cells; and is the biomolecular concentration expressed in grams per 100 mL.To investigate the influences of PFA fixation and paraffin-embedding removal on the TSCS of cells, we calculated the TSCS using the 3-D RI distributions. The relative RI distributions of biological cells and tissue with respect to that of water range from 1.0 to 1.06.40 Hence, they can be regarded as weakly scattering objects.41 Under the Born approximation, only a single-scattering event needs to be considered for such objects and subsequent multiple-scattering events can be neglected. The scattered fields and differential scattering cross sections of cells or tissue illuminated by a plane wave were calculated using the first-order Born approximation,2,3 such as the 3-D RI distributions of cells. The TSCS of the cell was obtained by integrating the differential scattering cross section. 2.3.Estimation of Volume Shrinkage of Epithelial TissueTo investigate the effect of shrinkage on epithelial tissue, we imaged freshly excised pig oral epithelial tissue using a second harmonic generation (SHG) microscope.42 After imaging, the tissue was fixed with 4% PFA for 24 h and embedded in paraffin. Transverse and longitudinal sections of thickness were cut from paraffin blocks and stained with HE. The shrinkage factor of the tissue due to PFA fixation and paraffin-embedding removal was estimated by dividing the average cellular volume of superficial cells measured using the SHG microscope by the average volume of superficial cells measured from the HE stained paraffin sections. 2.4.Preparation of Human Oral Epithelial TissueWe obtained human oral mucosa specimens with histologically moderate dysplasia from three patients. The study was approved by the Institutional Review Board of National Taiwan University Hospital and informed consent was obtained from subjects. The size of each human oral mucosa specimen from the three independent subjects was approximately . Specimens were fixed with 4% PFA solution and embedded in paraffin. Slices of thickness were cut from the tissue blocks using a rotary microtome. These slices were deparaffinized with xylene, hydrated with an alcohol gradient, and immersed in PBS for quantitative phase imaging by . 3.Refractive Indices Distributions, Dry Mass, Volume, and Total Scattering Cross Section of Epithelial CellsWe analyzed a total of 15 live cells in three repeated experiments. Representative RI distributions of the live cells before processing, after PFA fixation and after the paraffin embedding removal process, are shown in Fig. 2. The morphology of cells after PFA fixation showed no apparent alteration compared to that of the live cells. The paraffin embedding removal process led to a significant shrinkage of volume and an increase in the RI of cells. The mean and standard deviation of the RI for cells in the three treatments were , , and , respectively. Dry mass, volume, and TSCS are summarized in Fig. 3. The percentage differences in dry mass, volume, and TSCS of cells before and after PFA fixation were 2.0%, 7.3%, and , respectively. A slight swelling of the HeLa cells was observed. Shrinkage or swelling of cells after PFA fixation appeared to be cell-specific.32,43,44 The average dry mass and volume of cells after the paraffin embedding removal process were reduced by 6.4% and 38.8%, respectively, compared to those of the live cells. The slight reduction in dry mass of cells probably resulted from the dissolution of lipids of the cell membrane in the organic liquids used (i.e., xylene and alcohol solutions).45 The significant volume shrinkage of cells led to a significant increases in mass density and average RI of cells, as shown in Fig. 2(c). As a consequence, the average TSCS increased significantly by a factor of 8.6. 4.Development and Applications of Compensation Methods4.1.Compensation for Increased Refractive Indices and Volume Shrinkage of CellsAs shown in Sec. 3, the mean and standard deviation of RI of cells increased significantly and cellular volume decreased following the paraffin removal process. The light-scattering properties of cells and tissue were sensitive to morphologies and RI fluctuations.41 To obtain the scattering properties of live cells from cells after the paraffin embedding removal process, we proposed to compensate for the RI changes using RI histogram specification46 and for the volume shrinkage using isotropic scaling. The histogram specification algorithm adjusted the RI values of the processed cells so that the resulting probability histograms of RI were similar to those of the live cells. The flowchart of the histogram specification algorithm is shown in Fig. 4. For each cell, a cumulative probability distribution (CDF) of the RI of the cell after the paraffin embedding removal process, as well as that of the corresponding live cell, was formed. The two cumulative probability histograms were related to build a lookup table, . To set up the lookup table, for each input RI level , we found an output RI level , which minimizes the absolute difference between the CDFs of the live and processed cells, . The RI values of postprocess cells were then reassigned based on the lookup table. To compensate for the volume shrinkage, we enlarged the cells in all 3-Ds by the same scaling factor, based on the assumptions of isotropic shrinkage and space-invariant scaling factors. The scaling factor is the cubic root of the ratio of the average volume of the live cells to that of the cells after the paraffin embedding removal process, and was determined to be 1.18, according to a 38.8% volume shrinkage. The proposed compensation methods were applied to 15 cells after paraffin embedding removal. The RI distributions of the three groups of cells are shown in Figs. 5(a)–5(c), respectively. Figures 5(d)–5(f) show the corresponding histograms of RI within the cells. To evaluate the performance of the proposed compensation methods in restoring the RI distributions and the TSCS of cells, we calculated the TSCS of the restored cells and the live cells. To reduce the scattering of the boundary between cell and medium, we also changed the RI of the surrounding medium to equate that of the average cytoplasmic RI values of the cells in order to mimic a tissue environment [Figs. 5(g)–5(i)]. Average cytoplasmic RI values of live cells, cells after the paraffin embedding removal process, and the restored cells were 1.376, 1.400, and 1.376, respectively. The scatter plots in Figs. 6(a) and 6(b) show the volume and TSCS of live cells against those of the restored cells, respectively, with an average percentage difference in volume between live and restored cells of 0.5% and a percentage deviation in TSCS between and . The average percentage deviation between the TSCS of the two groups was only . Conversely, the average TSCS of the processed cells without compensation was 8.6 times higher than that of the live cells. Therefore, the proposed compensation method demonstrates the feasibility of estimating the TSCS of live cells from the 3-D RI distributions of the same cells following the paraffin embedding removal process. 4.2.Estimating the Scattering Coefficient of Human Oral Epithelial TissueWe estimated the spatially resolved scattering coefficients of human oral epithelial tissue using the scattering-phase theorem28,29 Under the first-order Born approximation, the theorem provides a formula that relates the scattering coefficient of a thin slice of tissue to the spatial variance of the phase shifts and the physical thickness of the tissue slice. The 2-D quantitative phase images under normal incidence as well as the thickness of the thin slices of human oral epithelial tissue were acquired by . The phase shift of the transmitted field passing through the specimen is proportional to the line integral of the RI difference between the specimen and medium along the direction of light propagation. To apply the compensation method described in Sec. 4.1 to the RI distributions of the slices, we calculated an average RI over the slice thickness for each pixel in the phase images. The lookup table for the RI histogram specification was obtained from the accumulated RI histogram of all 15 analyzed live cells. The shrinkage of the epithelial tissue due to the fixation and paraffin embedding removal processes was estimated by comparing SHG images of fresh ex vivo pig oral mucosa specimens to white light microscopic images of HE stained sections of the same specimens following the processes. A representative SHG image and the corresponding HE stained image of the epithelial cells are shown in Figs. 7(a) and 7(b), respectively. Cells in the images were manually segmented from z-stacks of consecutive SHG and HE stained images to calculate the mean cellular volumes before and after the paraffin embedding removal process. Tissue shrank by 29.6%. Based on the assumption of isotropic shrinkage of tissue, we enlarged length, width, and thickness of the tissue slices by the same scaling factor of 1.13, which is the cubic root of the ratio of the average volume of the fresh tissue to that of the processed tissue. Fig. 7(a) SHG image of the fresh ex vivo pig oral epithelial tissue specimen, (b) HE stained paraffin section of the same specimen. .  After compensation of RI distributions and shrinkage of the thin slices of processed oral epithelial tissue, we transformed the RI distributions of the tissue slices into the 2-D quantitative phase images in order to calculate the scattering coefficients. The scattering coefficients at each depth, calculated within an area of the slices before and after restoration of RI and volume, are shown in Fig. 8(b). The results show that the scattering coefficients of oral epithelial tissue after the fixation and embedding removal were increased by an average factor of 2.96. The estimated scattering coefficients at various depths differed, ranging from 100 to . Scattering coefficients in the keratinized superficial and basal layers of the epithelium were higher than in the intermediate layer due to a higher spatial frequency in RI fluctuations and a higher RI standard deviation in the keratinized superficial and basal layers. Fig. 8(a) RI image of a thick slice of human oral epithelial tissue. , (b) scattering coefficient and (c) average RI along the line labeled “PQ” in (a). Circles are the scattering coefficient and RI of the tissue slice after the paraffin embedding removal process, and squares are after compensation. 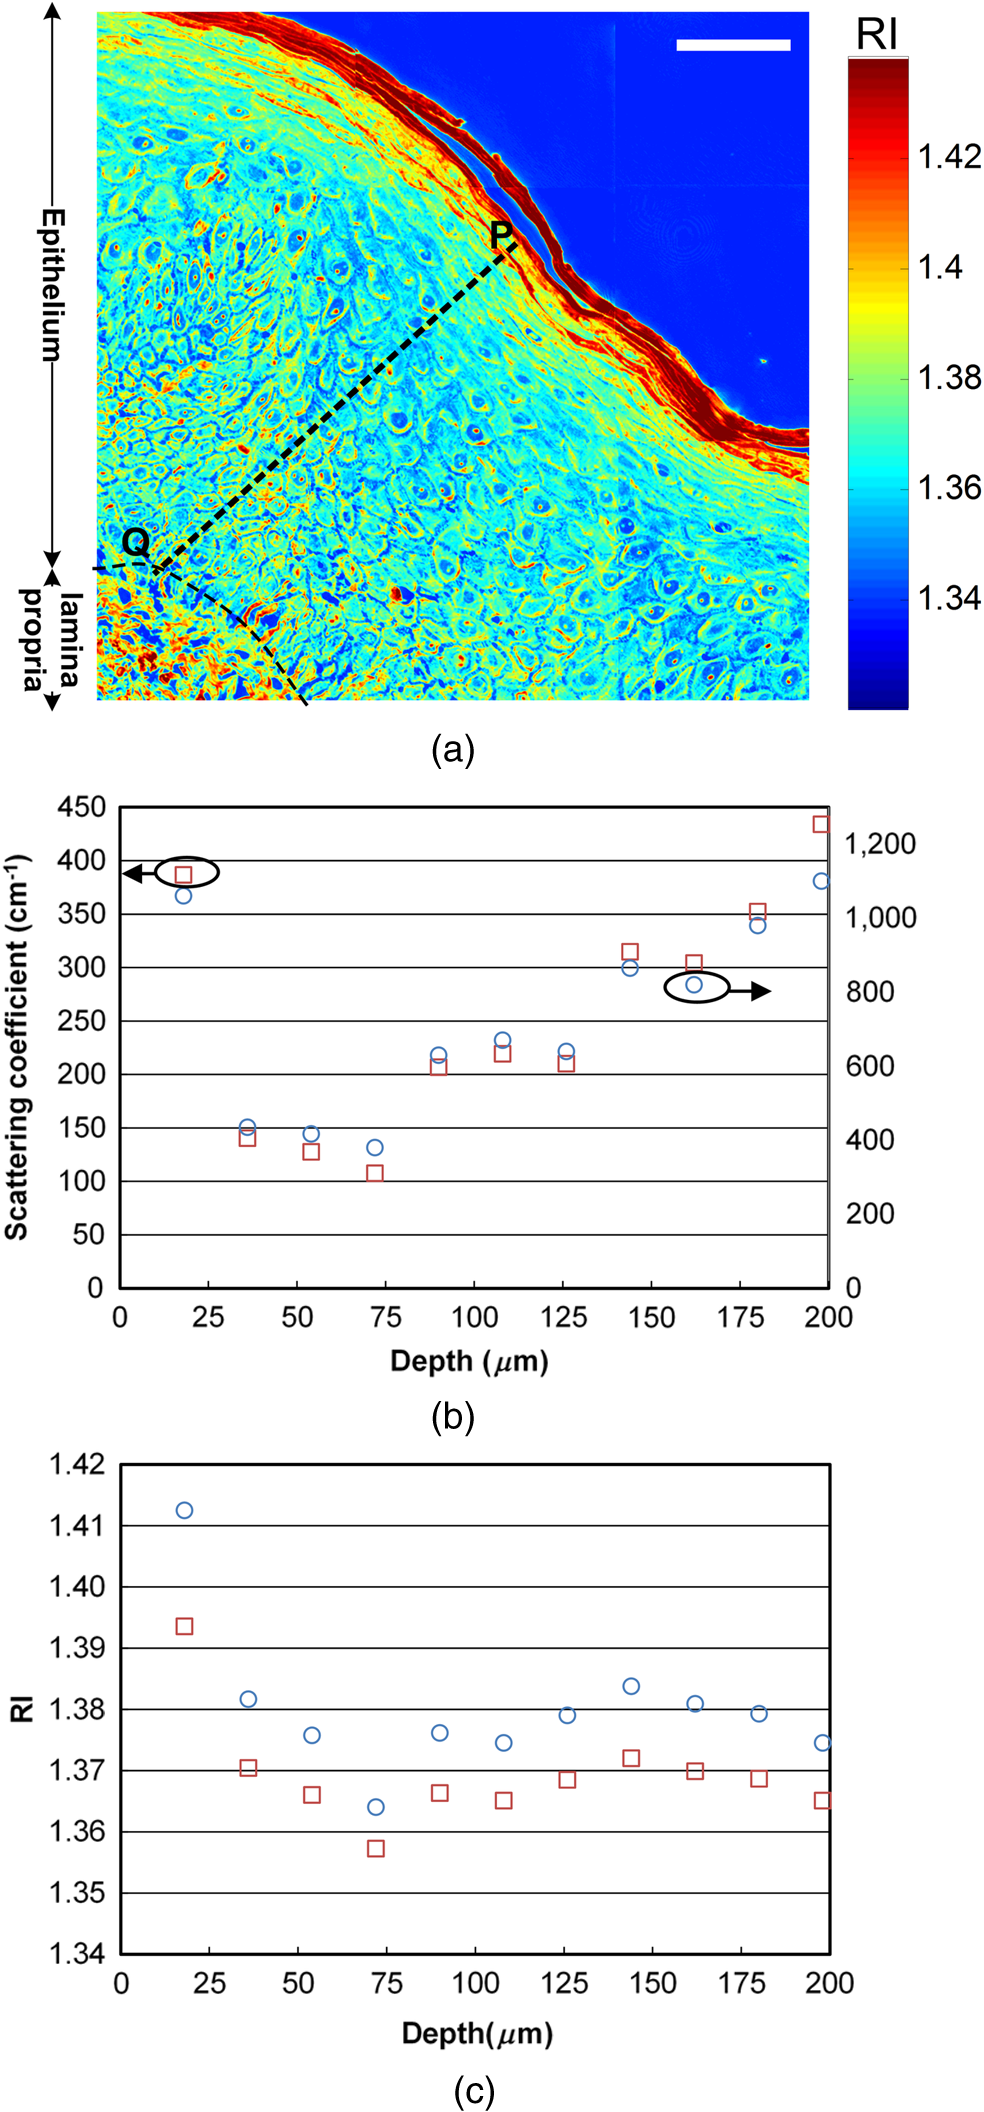 4.3.Estimating the Average Refractive Indices of Epithelial TissueEquation (1) indicates that the RI of biological cells and tissue is related to the biomolecular concentration, which is the ratio of the dry mass to the volume of a cell or tissue specimen. We proposed to compensate for the volume shrinkage and loss of tissue dry mass caused by the fixation and paraffin embedding removal processes, and to estimate the average RI of epithelial tissue from the average RI of tissue slices measured by . The percentage of loss in the tissue dry mass was assumed to be the same as that obtained from the cell study. Volume shrinkage was compensated by isotropic scaling with a factor of 1.13 as described in Sec. 4.2. Mean RI values of the slice shown in Fig. 8(a) at various depths from the tissue surface are shown as blue circles in Fig. 8(c). The RI at each depth was calculated by averaging the RI within an area. Depth-resolved RI values of the slice ranged from 1.36 to 1.42, compared to 1.35–1.39 after compensation, as shown by the red squares in Fig. 8(c). The average RI of the whole epithelium after compensation was calculated as 1.369. RI values of the epithelia in the other two specimens were similar. 5.DiscussionThe results of the cell study presented in Sec. 4.1 demonstrate that the average percentage deviation of the TSCS of restored cells from that of the original live cells was only . There were some visible differences in RI values and distributions between the restored cells and the live cells, indicating that the assumptions of isotropic and space-invariant shrinkage were only approximate. Despite the minor discrepancy in RI distributions between restored and live cells, the proposed compensation method was feasible for determining the TSCS of live cells, as the areas in restored cells showing different RI compared to those of the live cells were 0.1– in size and thus mainly contributed to backscattering. The TSCS of single cells was mostly determined from forward scattering which was several orders of magnitude higher than the sideward scattering and backscattering.9,47 Extending the proposed compensation method to accurately determine the backscattering characteristics and scattering phase functions of live cells using restored cells requires further study of the shrinkage mechanism of organelles to provide guidelines on how to compensate for organelle- or structure-specific alterations in RI and size. We estimated the scattering coefficients of the oral epithelium at various depths from 2-D quantitative phase images of thin epithelial tissue slices. The scattering coefficients of unprocessed oral epithelia were estimated from 100 to at a wavelength of 532 nm. The scattering coefficients of stratified squamous epithelia reported in the literature23,48,49 range from 20 to in the near-infrared region. Estimated scattering coefficients of unprocessed oral epithelia in our study were higher than the values reported in the previous studies. One possible reason is that the epithelia in different organs may have different scattering coefficients. The compensation methods employed in the present study could be improved to obtain a more accurate estimation of the 2-D phase distributions of unprocessed tissue from tissue slices. The amount of volume shrinkage could be assessed directly by comparing images of stained tissue slices to images of the same tissue specimen taken before processing. The 3-D microscopy techniques, such as SHG or reflectance confocal microscopy,50 could be used to capture the images of unprocessed tissue. For the RI fluctuations of epithelial tissue, we compensated the RI distributions of the epithelial tissue by the RI histogram of the 15 attached live cells. However, the RI distribution of single cells may not accurately represent that of epithelial cells in intact tissue due to the diversity of cells and cell junctions. One possible approach for obtaining more accurate RI histograms of unprocessed tissue is to measure the RI histograms of monolayered cell cultures on tissue-like substrates. We also demonstrated the estimation of the localized average RI of unprocessed human oral epithelia from quantitative 2-D phase images of thin tissue sections using the compensation method described in Sec. 4.2. The proposed method could be adapted to estimate the spatially resolved RI of any semi-transparent tissue from thin tissue slices. The method is particularly useful for characterizing the RI distribution of heterogeneous tissue because it does not require the assumption of homogeneous or piecewise homogeneous tissue.23–26,51–56 6.ConclusionWe quantitatively investigated the influences of 4% PFA fixation and paraffin embedding removal processes on the structure, RI, and TSCS of in vitro epithelial cells using 3-D RI distributions of the cells and the first-order Born approximation. Results show that the fixation and paraffin embedding removal resulted in significant increases in the mean and standard deviation of a cellular RI and a significant volume shrinkage (38.8%) compared to live cells. Processing increased the TSCS of the cells by a factor of 8.6. Knowledge of alterations in the structure and scattering properties of cells may help interpret the scattering properties derived from quantitative phase images of thin tissue slices. Based on the results of the cell study, we propose simple methods based on histogram specification and the isotropic enlargement of volume to compensate for changes in RI and volume of epithelial cells caused by the fixation and paraffin embedding removal processes. After compensation, the TSCS of processed cells deviated from that of the original live cells by approximately . We also utilized the compensation methods to estimate the spatially resolved scattering coefficients and RI of human oral epithelial tissue from quantitative phase images of thin tissue slices. Estimated scattering coefficients at a wavelength of 532 nm ranged from 100 to . After compensating for shrinkage and a slight loss of tissue mass, estimated spatially resolved RI values ranged from 1.35 to 1.39, averaging . The demonstrated capabilities of these techniques to quantify the structure, RI, and scattering properties of epithelial tissue facilitate the development and optimization of optical diagnostic techniques and provide essential information for photon-migration modeling. AcknowledgmentsWe acknowledge financial support from the National Health Research Institutes (Grant No. NHRI-EX102-10020EC) and Ministry of Science and Technology (Grant No. #102-2221-E-002-032) of Taiwan. We are grateful to Dr. Han-Yi Elizabeth Chou and Dr. Shih-Torng Ding of National Taiwan University for providing the HeLa cells and pig oral mucosa specimens, respectively, as well as Dr. Chih-Feng Lin of National Taiwan University Hospital for providing the human oral mucosa specimens. We also thank Ms. Hsueh-Chin Chen and her colleagues at the Laboratory Animal Center, National Taiwan University College of Medicine, for the preparation of specimens and helpful discussions. ReferencesL. V. WangH.-i. Wu, Biomedical Optics: Principles and Imaging, Wiley-Interscience, New Jersey
(2007). Google Scholar
İ. R. Çapoğluet al.,
“Accuracy of the Born approximation in calculating the scattering coefficient of biological continuous random media,”
Opt. Lett., 34
(17), 2679
–2681
(2009). http://dx.doi.org/10.1364/OL.34.002679 OPLEDP 0146-9592 Google Scholar
A. Ishimaru, Wave Propagation and Scattering in Random Bedia, Wiley-IEEE Press, New Jersey
(1999). Google Scholar
T. Durduranet al.,
“Diffuse optics for tissue monitoring and tomography,”
Rep. Prog. Phys., 73
(7), 076701
(2010). http://dx.doi.org/10.1088/0034-4885/73/7/076701 RPPHAG 0034-4885 Google Scholar
R. A. SimonC. S. John,
“Optical tomography: forward and inverse problems,”
Inverse Probl., 25
(12), 123010
(2009). http://dx.doi.org/10.1088/0266-5611/25/12/123010 INPEEY 0266-5611 Google Scholar
A. E. ProfioD. R. Doiron,
“Transport of light in tissue in photodynamic therapy,”
Photochem. Photobiol., 46
(5), 591
–599
(1987). http://dx.doi.org/10.1111/php.1987.46.issue-5 PHCBAP 0031-8655 Google Scholar
C. W. BrianS. P. Michael,
“The physics, biophysics and technology of photodynamic therapy,”
Phys. Med. Biol., 53
(9), R61
(2008). http://dx.doi.org/10.1088/0031-9155/53/9/R01 PHMBA7 0031-9155 Google Scholar
T. Collieret al.,
“Determination of epithelial tissue scattering coefficient using confocal microscopy,”
IEEE J. Sel. Topics Quantum Electron., 9
(2), 307
–313
(2003). http://dx.doi.org/10.1109/JSTQE.2003.814413 IJSQEN 1077-260X Google Scholar
D. Arifleret al.,
“Light scattering from normal and dysplastic cervical cells at different epithelial depths: finite-difference time-domain modeling with a perfectly matched layer boundary condition,”
J. Biomed. Opt., 8
(3), 484
–494
(2003). http://dx.doi.org/10.1117/1.1578640 JBOPFO 1083-3668 Google Scholar
R. Drezeket al.,
“Light scattering from cervical cells throughout neoplastic progression: influence of nuclear morphology, DNA content, and chromatin texture,”
J. Biomed. Opt., 8
(1), 7
–16
(2003). http://dx.doi.org/10.1117/1.1528950 JBOPFO 1083-3668 Google Scholar
M. Hammeret al.,
“Optical properties of ocular fundus tissues-an in vitro study using the double-integrating-sphere technique and inverse Monte Carlo simulation,”
Phys. Med. Biol., 40
(6), 963
(1995). http://dx.doi.org/10.1088/0031-9155/40/6/001 PHMBA7 0031-9155 Google Scholar
R. SamathamP. CampagnolaS. L. Jacques,
“Optical properties of mutant versus wild-type mouse skin measured by reflectance-mode confocal scanning laser microscopy (rCSLM),”
J. Biomed. Opt., 13
(4), 041309
(2008). http://dx.doi.org/10.1117/1.2953195 JBOPFO 1083-3668 Google Scholar
J. M. SchmittA. KnüttelR. F. Bonner,
“Measurement of optical properties of biological tissues by low-coherence reflectometry,”
Appl. Opt., 32
(30), 6032
–6042
(1993). http://dx.doi.org/10.1364/AO.32.006032 APOPAI 0003-6935 Google Scholar
K. A. Vermeeret al.,
“Depth-resolved model-based reconstruction of attenuation coefficients in optical coherence tomography,”
Biomed. Opt. Express, 5
(1), 322
–337
(2014). http://dx.doi.org/10.1364/BOE.5.000322 BOEICL 2156-7085 Google Scholar
A. KnüttelS. BonevW. Knaak,
“New method for evaluation of in vivo scattering and refractive index properties obtained with optical coherence tomography,”
J. Biomed. Opt., 9
(2), 265
–273
(2004). http://dx.doi.org/10.1117/1.1647544 JBOPFO 1083-3668 Google Scholar
J. YiV. Backman,
“Imaging a full set of optical scattering properties of biological tissue by inverse spectroscopic optical coherence tomography,”
Opt. Lett., 37
(21), 4443
–4445
(2012). http://dx.doi.org/10.1364/OL.37.004443 OPLEDP 0146-9592 Google Scholar
Y. Yanget al.,
“Quantitative analysis of estimated scattering coefficient and phase retardation for ovarian tissue characterization,”
Biomed. Opt. Express, 3
(7), 1548
–1556
(2012). http://dx.doi.org/10.1364/BOE.3.001548 BOEICL 2156-7085 Google Scholar
Y. Yanget al.,
“Optical scattering coefficient estimated by optical coherence tomography correlates with collagen content in ovarian tissue,”
J. Biomed. Opt., 16
(9), 090504
(2011). http://dx.doi.org/10.1117/1.3625247 JBOPFO 1083-3668 Google Scholar
D. Levitzet al.,
“Determination of optical scattering properties of highly-scattering media in optical coherence tomography images,”
Opt. Express, 12
(2), 249
–259
(2004). http://dx.doi.org/10.1364/OPEX.12.000249 OPEXFF 1094-4087 Google Scholar
I. V. Turchinet al.,
“Novel algorithm of processing optical coherence tomography images for differentiation of biological tissue pathologies,”
J. Biomed. Opt., 10
(6), 064024
(2005). http://dx.doi.org/10.1117/1.2137670 JBOPFO 1083-3668 Google Scholar
J. Quet al.,
“Optical properties of normal and carcinomatous bronchial tissue,”
Appl. Opt., 33
(31), 7397
–7405
(1994). http://dx.doi.org/10.1364/AO.33.007397 APOPAI 0003-6935 Google Scholar
R. SamathamS. L. Jacques,
“Determine scattering coefficient and anisotropy of scattering of murine tissues using reflectance-mode confocal microscopy,”
Proc. SPIE, 8592 85920U
(2013). http://dx.doi.org/10.1117/12.2005072 PSISDG 0277-786X Google Scholar
A. KnuttelM. Boehlau-Godau,
“Spatially confined and temporally resolved refractive index and scattering evaluation in human skin performed with optical coherence tomography,”
J. Biomed. Opt., 5
(1), 83
–92
(2000). http://dx.doi.org/10.1117/1.429972 JBOPFO 1083-3668 Google Scholar
M. Sandet al.,
“Evaluation of the epidermal refractive index measured by optical coherence tomography,”
Skin Res. Technol., 12
(2), 114
–118
(2006). http://dx.doi.org/10.1111/srt.2006.12.issue-2 0909-752X Google Scholar
A. V. Zvyaginet al.,
“Refractive index tomography of turbid media by bifocal optical coherence refractometry,”
Opt. Express, 11
(25), 3503
–3517
(2003). http://dx.doi.org/10.1364/OE.11.003503 OPEXFF 1094-4087 Google Scholar
K. Yoshidaet al.,
“Application of the critical angle method to refractive index measurement of human skin in vivo under partial contact,”
J. Biomed. Opt., 18
(3), 037002
(2013). http://dx.doi.org/10.1117/1.JBO.18.3.037002 JBOPFO 1083-3668 Google Scholar
D. Arifleret al.,
“Numerical investigation of two-dimensional light scattering patterns of cervical cell nuclei to map dysplastic changes at different epithelial depths,”
Biomed. Opt. Express, 5
(2), 485
–498
(2014). http://dx.doi.org/10.1364/BOE.5.000485 BOEICL 2156-7085 Google Scholar
Z. WangH. DingG. Popescu,
“Scattering-phase theorem,”
Opt. Lett., 36
(7), 1215
–1217
(2011). http://dx.doi.org/10.1364/OL.36.001215 OPLEDP 0146-9592 Google Scholar
M. Xu,
“Scattering-phase theorem: anomalous diffraction by forward-peaked scattering media,”
Opt. Express, 19
(22), 21643
–21651
(2011). http://dx.doi.org/10.1364/OE.19.021643 OPEXFF 1094-4087 Google Scholar
K. SuvarnaC. LaytonJ. Bancroft, Theory and Practice of Histological Techniques, Elsevier Health Sciences, Amsterdam, Netherlands
(2012). Google Scholar
H. Boonstraet al.,
“Cervical tissue shrinkage by formaldehyde fixation, paraffin wax embedding, section cutting and mounting,”
Virchows Arch. A Pathol. Anat. Histopathol., 402
(2), 195
–201
(1983). http://dx.doi.org/10.1007/BF00695061 0340-1227 Google Scholar
C. N. C. CrawfordR. Barer,
“The action of formaldehyde on living cells as studied by phase contrast microscopy,”
Q. J. Microsc. Sci., s3-92
(20), 403
–452
(1951). QJMSAF 0370-2952 Google Scholar
K. F. A. Ross,
“Cell shrinkage caused by fixatives and paraffin-wax embedding in ordinary cytological preparations,”
Q. J. Microsc. Sci., s3-94
(26), 125
–139
(1953). QJMSAF 0370-2952 Google Scholar
H. Aunget al.,
“On alterations in the refractive index and scattering properties of biological tissue caused by histological processing,”
Proc. SPIE, 8592 85920X
(2013). http://dx.doi.org/10.1117/12.2005927 PSISDG 0277-786X Google Scholar
J.-W. Suet al.,
“Digital holographic microtomography for high-resolution refractive index mapping of live cells,”
J. Biophotonics, 6
(5), 416
–424
(2013). http://dx.doi.org/10.1002/jbio.v6.5 JBOIBX 1864-063X Google Scholar
J.-W. SuC.-Y. ChouK.-B. Sung,
“3D refractive index imaging of cells to study light scattering properties of cells and tissue,”
3D Reconstruction: Methods, Applications and Challenges, 107
–123 Nova Science Pub Inc., Hauppauge, New York
(2013). Google Scholar
Y. Sunget al.,
“Stain-free quantification of chromosomes in live cells using regularized tomographic phase microscopy,”
PLoS One, 7
(11), e49502
(2012). http://dx.doi.org/10.1371/journal.pone.0049502 1932-6203 Google Scholar
H. Schatten, Germ Cell Protocols: Sperm and Oocyte Analysis, Humana Press, New York City
(2004). Google Scholar
R. Barer,
“Determination of dry mass, thickness, solid and water concentration in living cells,”
Nature, 172
(4389), 1097
–1098
(1953). http://dx.doi.org/10.1038/1721097a0 NATUAS 0028-0836 Google Scholar
R. A. MeyerA. Brunsting,
“Light scattering from nucleated biological cells,”
Biophys. J., 15
(3), 191
–203
(1975). http://dx.doi.org/10.1016/S0006-3495(75)85811-5 BIOJAU 0006-3495 Google Scholar
A. WaxV. Backman, Biomedical Applications of Light Scattering, McGraw-Hill Professional, New York City
(2009). Google Scholar
M.-R. Tsaiet al.,
“In vivo optical virtual biopsy of human oral mucosa with harmonic generation microscopy,”
Biomed. Opt. Express, 2
(8), 2317
–2328
(2011). http://dx.doi.org/10.1364/BOE.2.002317 BOEICL 2156-7085 Google Scholar
R. BacallaoS. SohrabC. Phillips,
“Guiding principles of specimen preservation for confocal fluorescence microscopy,”
Handbook Of Biological Confocal Microscopy, 368
–380 Springer, New York City
(2006). Google Scholar
M. Peltset al.,
“Thickness profiling of formaldehyde-fixed cells by transmission-through-dye microscopy,”
Biotechniques, 50
(6), 389
(2011). http://dx.doi.org/10.2144/000113684 BTNQDO 0736-6205 Google Scholar
J. M. Nowacek,
“Fixation and tissue processing,”
Education Guide: Special Stains and H & E, Dako North America, Carpinteria, CA
(2010). Google Scholar
R. C. GonzalezR. E. Woods, Digital Image Processing, Prentice Hall, New Jersey
(2007). Google Scholar
A. DunnR. Richards-Kortum,
“Three-dimensional computation of light scattering from cells,”
IEEE J. Sel. Topics Quantum Electron., 2
(4), 898
–905
(1996). http://dx.doi.org/10.1109/2944.577313 IJSQEN 1077-260X Google Scholar
A. L. Clarket al.,
“Detection and diagnosis of oral neoplasia with an optical coherence microscope,”
J. Biomed. Opt., 9
(6), 1271
–1280
(2004). http://dx.doi.org/10.1117/1.1805558 JBOPFO 1083-3668 Google Scholar
T. Collieret al.,
“Sources of scattering in cervical tissue: determination of the scattering coefficient by confocal microscopy,”
Appl. Opt., 44
(11), 2072
–2081
(2005). http://dx.doi.org/10.1364/AO.44.002072 APOPAI 0003-6935 Google Scholar
K.-B. Sunget al.,
“Fiber optic confocal reflectance microscopy: a new real-time technique to view nuclear morphology in cervical squamous epithelium in vivo,”
Opt. Express, 11
(24), 3171
–3181
(2003). http://dx.doi.org/10.1364/OE.11.003171 OPEXFF 1094-4087 Google Scholar
K. Wanget al.,
“Utilizing confocal microscopy to measure refractive index of articular cartilage,”
J. Microsc., 248
(3), 281
–291
(2012). http://dx.doi.org/10.1111/jmi.2012.248.issue-3 JMICAR 0022-2720 Google Scholar
F. P. Bolinet al.,
“Refractive index of some mammalian tissues using a fiber optic cladding method,”
Appl. Opt., 28
(12), 2297
–2303
(1989). http://dx.doi.org/10.1364/AO.28.002297 APOPAI 0003-6935 Google Scholar
K. WangJ. WuT. B. Kirk,
“Depth-dependent refractive index of normal and early degenerated articular cartilage,”
J. Biomed. Opt., 18
(10), 105003
(2013). http://dx.doi.org/10.1117/1.JBO.18.10.105003 JBOPFO 1083-3668 Google Scholar
J. Bindinget al.,
“Brain refractive index measured in vivo with high-NA defocus-corrected full-field OCT and consequences for two-photon microscopy,”
Opt. Express, 19
(6), 4833
–4847
(2011). http://dx.doi.org/10.1364/OE.19.004833 OPEXFF 1094-4087 Google Scholar
A. M. Zysket al.,
“Needle-based refractive index measurement using low-coherence interferometry,”
Opt. Lett., 32
(4), 385
–387
(2007). http://dx.doi.org/10.1364/OL.32.000385 OPLEDP 0146-9592 Google Scholar
G. J. Tearneyet al.,
“Determination of the refractive index of highly scattering human tissue by optical coherence tomography,”
Opt. Lett., 20
(21), 2258
–2260
(1995). http://dx.doi.org/10.1364/OL.20.002258 OPLEDP 0146-9592 Google Scholar
BiographyJing-Wei Su received his BS degree in electrical engineering from National Taiwan University, Taipei, Taiwan, in June 2008. Currently, he is working toward his PhD degree in biomedical electronics and bioinformatics from the same university. His research interests include developments and applications of quantitative optical microscopy and three-dimensional imaging. Wei-Chen Hsu received her BS degree in pharmacy from Taipei Medical University, Taiwan, in 2005, and her MS degree in biophotonics from National Yang-Ming University, Taiwan, in 2008. She received her PhD degree in biomedical electronics and bioinformatics at National Taiwan University in 2013. Her research interests include developments and applications of optical microscopy and spectroscopy. Jeng-Wei Tjiu is a clinical assistant professor in the Department of Dermatology, College of Medicine, National Taiwan University, Taiwan. He is a board certified dermatologist and received his MD and PhD degrees from National Taiwan University in 2000 and 2008, respectively. He is an interdisciplinary researcher focused on novel optical methods to visualize skin structures, delineate cellular morphology, and therapeutic applications via light–tissue interactions. Chun-Pin Chiang graduated from School of Dentistry, National Taiwan University in 1977, and received a Doctor of Medical Science degree in oral pathology from Harvard School of Dental Medicine in 1989. He is now the professor and chairman of the Department of Oral Pathology and Oral Diagnosis, School of Dentistry, National Taiwan University, and the director of the Graduate Institute of Oral Biology, School of Dentistry, National Taiwan University. Chao-Wei Huang is a PhD student at National Taiwan University. He received his BS and MS degrees in animal science from National Chung-Hsing University. His current research interests include animal science, histology, and cell signaling pathways. Kung-Bin Sung received his MS and PhD degrees in biomedical engineering from the University of Texas at Austin in 1999 and 2003, respectively. He worked as a research scientist at Intel Corporation from 2003 to 2006. He joined the Department of Electrical Engineering and Graduate Institute of Biomedical Electronics and Bioinformatics at National Taiwan University in 2006. His research focuses on developing optical spectroscopy and microscopy techniques for early diagnosis of cancer and precancer. |


