|
|
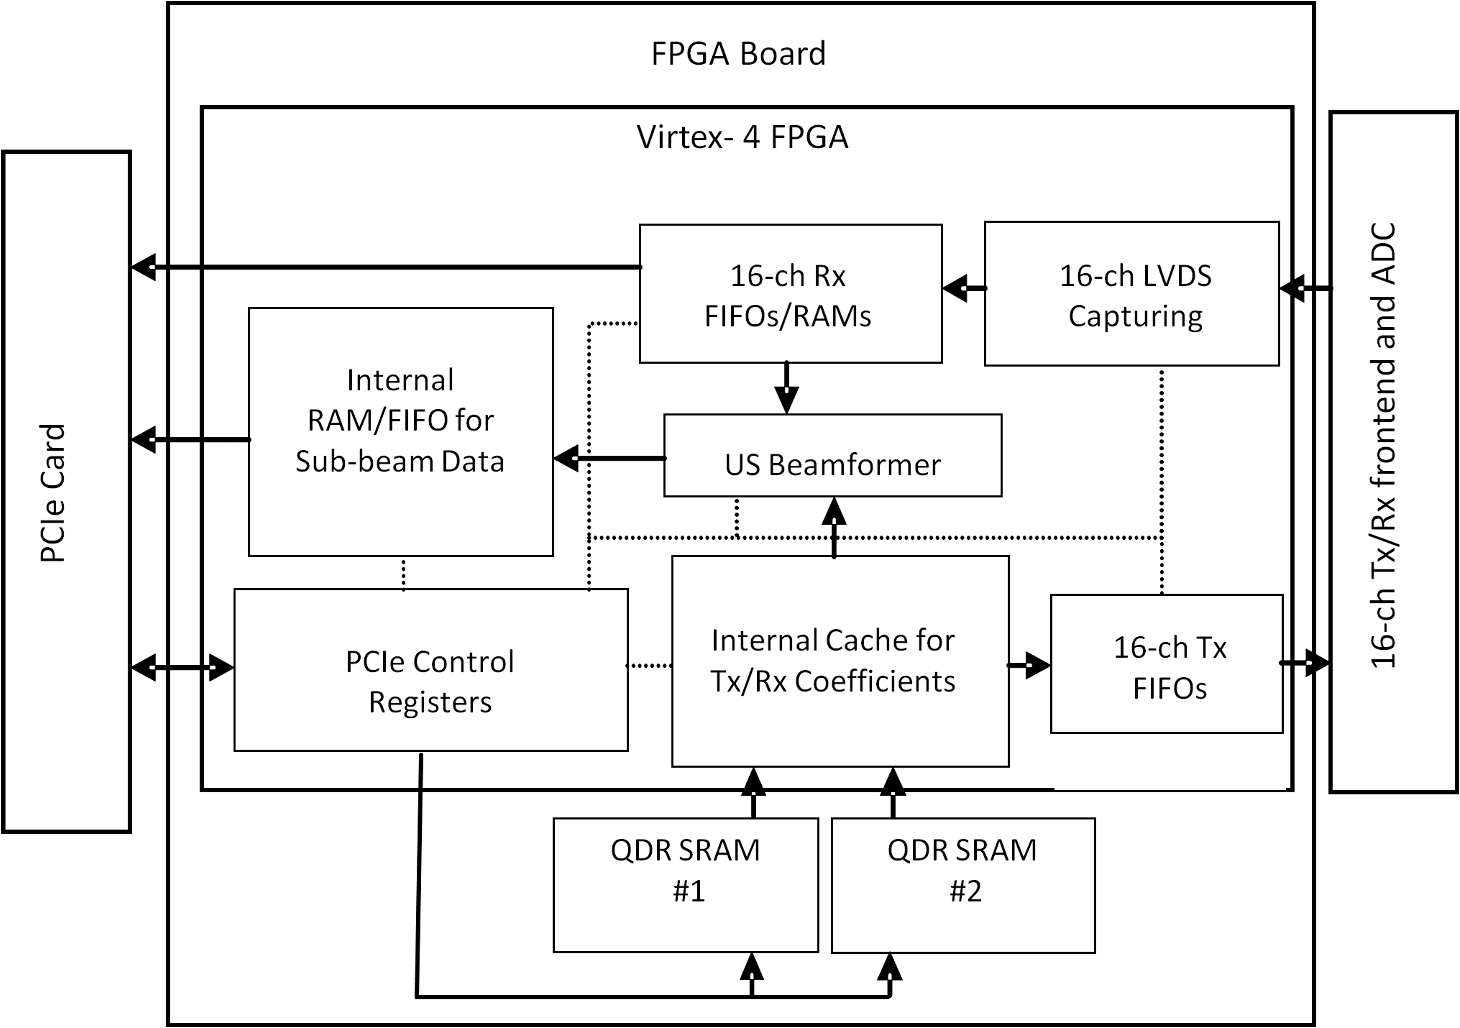
1.IntroductionOvarian cancer has the lowest survival rates of the gynecologic cancers. This is mainly because it is predominantly diagnosed in stages III and IV due to the lack of reliable symptoms as well as the lack of efficacious screening techniques.1 Currently, there is no single test for ovarian cancer detection. The combination of serum marker CA125 screening, transvaginal ultrasound (US), and pelvic examination yields a low-positive predictive value.2–5 X-ray computed tomography scans have low sensitivities and are poor in detecting smaller metastasized tumors of less than 2-cm in diameter.6 Magnetic resonance imaging is costly and is typically used as a secondary imaging method when ultrasonography diagnosis is not sufficient.7 Positron emission tomography has limited value in lesion localization in the early stages of ovarian cancer.8 Within the near-infrared (NIR) optical window (700- to 900-nm wavelength), scattering is the most dominant light–tissue interaction, while the optical absorption coefficient of water is relatively low compared with the main absorber—blood hemoglobin. The transparency of water makes NIR light ideal to probe biological tissues up to several centimeters in depth using optical methods such as photoacoustic tomography (PAT), diffuse optical tomography (DOT), and spectroscopy (DOS).9–11 PAT is an emerging modality that provides optical absorption contrast of targets or lesions at US resolution.10,12–16 Transient acoustic waves generated from thermoelastic expansion, resulting from a transient temperature rise upon laser illumination, are then measured by an US array transducer and used to reconstruct the optical absorption distribution, which is directly related to the microvessel density of tumors or tumor angiogenesis.17,18 The penetration depth of PAT is scalable with the US frequency, provided the signal-to-noise ratio (SNR) is adequate.10 In the diagnostic frequency range of 3 to 8 MHz, the penetration depth of PAT in tissue can reach up to 4 to 5 cm using NIR light,12 which is compatible with the penetration depth of conventional transvaginal US. Though the resolution of PAT is excellent compared with a pure optical imaging modality, such as DOT, it lacks signal inside homogeneous structures and detects signals mainly from the surface due to US transducer bandwidth limitations.10 This makes the coregistration of PAT with conventional US inevitable for better mapping of light absorption to the corresponding anatomical structure. Based on statistics, up to 85 to 90% of ovarian cancers are epithelial ovarian carcinomas located at the outer surface of the ovary.19 Thus, the coregistered US/PAT that maps out the surface vascular density with the surrounding anatomical structure of the ovary is highly valuable in assisting physicians for early detection and characterization of ovarian cancers. Several coregistered US/PAT systems have been developed,20–26 but all of them lack real-time coregistration capability. Visual Sonics (Toronto, Ontario, Canada) provides coregistered high-frequency US and photoacoustic imaging products. Unfortunately, their frame rate is only 4 frames per second (fps) and the penetration depth is limited to about 1 cm. Recently, WinProbe Inc. (North Palm Beach, Florida) has developed both research and clinical imaging systems. Their research system is capable of providing coregistered US and PAT images in real-time with lower frame rates.27 To facilitate the clinical use of the coregistered US/PAT modality, real-time coregistration of US and PAT is desirable to correlate the optical contrast with the anatomical structure for quick localization of suspicious areas. Achieving real-time coregistration of the two modalities is not an easy task since the data acquisition, storage, and processing of these two modalities are different at the technical level. The processor/controller for these tasks should have reconfigurability with negligible latency to perform switching between the two modalities and to achieve interlaced real-time imaging. A field programmable gate array (FPGA)-based reconfigurable processor was designed and implemented by our group to perform the front-end data acquisition and data preprocessing (US beamforming), for which a modular system design was implemented for lowest latency and best SNR.28 In our previous system, only one coregistered frame per second was achieved using a 100-MHz Ethernet linked to a personal computer (PC). In this paper, a significantly improved system is reported in which a peripheral component interconnect express (PCIe) bus for data transfer is implemented. The PC program and FPGA code are optimized according to the new system structure, and multithreads techniques and Fourier domain fast data processing are implemented. These improvements allow us to achieve 15 coregistered US/PAT fps, and this speed is only limited by the 15-Hz laser pulse repetition rate (PRR). Additionally, the number of US channels is upgraded from 64 to 128, which allows us to scan a larger field of view for up to 120 deg. A custom-built probe consisting of a 128-channel transvaginal US array transducer, an optical fiber assembly, and a three-dimensional-printed housing is specially designed for the coregistration of two modalities in this system.29 This paper will present the system architecture and optimal methods employed in the FPGA and PC software. Phantom experiments are conducted to evaluate the lateral resolution and axial sensitivity of the system. An example of real-time scanning obtained from an in vivo tumor-bearing mouse is presented to demonstrate the real-time imaging capability of the system. Examples of ex vivo malignant and normal ovaries are given to demonstrate the synergy of the coregistered US/PAT in identifying tumor vasculature and tumor morphology. To the best of our knowledge, the coregistered US/PAT imaging system reported in this paper is the first real-time system capable of scanning a larger field of view for up to 120 deg and 8 cm in depth with a user selectable configuration for either the US mode, photoacoustic imaging mode, or coregistered imaging mode. 2.System DesignThe first generation US/PAT system reported in Ref. 28 used an Ethernet cable for data transfer and a digital signal processor (DSP, TI6455) for data coordination. The speed of the system was 1 frame per second and the number of channels was 64. The DSP was used to form the pulse-echo transmit (Tx) timing first-in-first-out (FIFO) and to perform beamforming after fetching analog-to-digital converter (ADC) data from module FPGAs. The interface between DSP and module FGPAs is an external memory interface of the DSP chip, and the data transfer rate was low. Another bottleneck was the low-data transfer rate of the Ethernet cable (limited to 100 Mbps). Thus, the low-data transfer rate among module FPGAs, DSP, and PC limited the imaging frame rate to 1 frame per second. To solve the low-data transfer rate problem, we have used PCIe and low-voltage differential signaling (LVDS) tracks in our current design. PCIe (up to 2.5 Gbps) has been used for data transfer between PC and Virtex 5 FPGA inside the PCIe board, which has served as a data coordinator. The LVDS between the PCIe board and module FPGAs has solved the problem of communications among different FPGAs. As a result, a 15 fps imaging frame rate has been achieved which is only limited by our laser repetition frequency. 2.1.System Hardware and Data Acquisition StructureThe real-time system is designed to work in three different imaging modes: US mode, PAT mode, and coregistered mode. It requires different modules to perform data acquisition, transfer, and processing with negligible switch latency between the different imaging modes. From a hardware perspective, the real-time system mainly consists of a front-end analog circuitry, 8-module FPGAs, a PCIe card (Xpress LX110T by PLDA, San Jose, California), and a PC (Fig. 1). The front-end analog circuitry and 8-module FPGAs work together to perform US transmission focusing, data sampling, and US receiving sub-beamforming. The PCIe card works as a data coordinator. It obtains transmission and receiving beamforming delay profiles, calculated according to user’s imaging setting (transmission focus, number of scan lines, and angular scan range) from the PC. It then distributes the delay coefficients to the memories of each module corresponding to its attached 16 channels. Once sub-beamforming is done in each module FPGA, the FPGA on the PCIe card continues US beamforming and envelope detection. The resulting beam envelopes are transferred to the PC for scan conversion and display. For the PAT mode or coregistered mode, the PCIe card directly transfers the PAT radio frequency (RF) data to the PC. The PC software performs PAT delay-and-sum beamforming,30,31 envelope detection, and scan conversion. Furthermore, the PC software graphics user interface allows user interaction for data storage and dynamic range selection for display with different color scales according to each imaging mode. Fig. 1The overall block diagram of the coregistered pulse-echo ultrasound (US)/PAT system. Each 16-channel module consists of five boards: a custom-built 16-channel Tx pulsars and Rx preamplifier board, two commercial 8-channel US-receiving boards, a Virtex-4 FPGA board for digital capturing and reconfigurable subprocessing, and a customized adapter PCB board. The adapter PCB connects the ADC signals of the two receiving boards to one module FPGA board and also connects the Tx control signals from the module FPGA to the Tx pulsars. Eight modules are plugged into the motherboard, which fans out all the 128 channels from the modules to the US probe connector.  The real-time system features 128 parallel channels, each of which has its own transmit/receive (Tx/Rx) circuitry along with ADC sampling at 40 MHz. It is a modular design (Fig. 1), where the front-end circuits of each set of 16 channels are grouped into one module that is plugged into a slot in the system motherboard.32 The transmission of every channel is controlled by the module FPGA using a Tx timing FIFO memory. Furthermore, ADC data are also captured by the module FPGA and stored in another Rx FIFO memory. US sub-beamforming of every 16-channel group is done by each module FPGA that features 2500 beam lines per second. US sub-beamforming data as well as PAT RF data from each module are collected by the Virtex-5 FPGA-based PCIe card plugged into the PC. All module FPGAs are connected to the PCIe card through another customized adapter board that uses LVDS tracks to achieve the ultrafast transfer rate. Here, each module FPGA has two pairs of dedicated one-way LVDS tracks single-edge pumped at 100 MHz and features a transfer speed of per module.33 The modules are connected to the adapter board, and the adapter board is connected to the PCIe card. The PCIe card forms the final US beam from the sub-beamforming data, then stores it in an FIFO. After that, envelope detection is done by taking the absolute value followed by low-pass filtering. PAT RF data are captured and stored in a FIFO inside the PCIe card. The speed of communication between the PCIe card and the PC can reach up to , which adds a negligible latency to the overall acquisition time. 2.2.Module FPGA Operation and ReconfigurationEach module FPGA has two embedded quad-data-rate static random access memory (SRAM) chips which can be freely accessed by the PC through general purpose register input/outputs (GPIO) of the PCIe card. In the initialization stage, the PC transfers the time delay profiles for US transmission focusing and receiving beamforming to module FPGA’s SRAMs via the PCIe card. In every acquisition cycle, the PC program informs the PCIe card of the index of the active scan line through GPIOs. Each module FPGA temporarily stores the Tx and Rx coefficients of the active scan line in its internal cache memory (Fig. 2). The Tx coefficients of the active scan line contain the starting time for pulsing to each element, where a logical algorithm is used to construct the timing profile of every pulse for every element and store it to the Tx timing FIFOs. US sub-beamforming is done within each module FPGA by fetching the data from all 16 channels of the Rx FIFOs/RAMs while realigning and adding (delay and sum). A 50-MHz clock is used for beamforming, which allows forming the beam for one scan line in 102.4 μs for 4096 Rx FIFO points (sampled at 40 MHz, allowing a 7.7 cm maximum imaging depth for US pulse-echo). However, since the internal cache of the FPGA has to be filled with the Tx and Rx coefficients, and the formed beam has to be sent to the PCIe card, the total time needed for the beam envelope data to reach the PC is or . For an image with 100 scan lines, after adding the scan conversion latency, the best frame rate achieved for US-only imaging is 20 fps. In the PAT mode or coregistered mode, the DAQ must be synchronized with the trigger from the laser system. The trigger wire is attached to the PCIe card which keeps checking the status of the trigger signal. The PC program waits for this trigger and sets the imaging mode register to the PAT mode. The FPGA structure can be switched from the PAT mode to the US mode in a fraction of a microsecond. Both PAT and US data acquisition is done between the two laser pulses, which is valuable in that it keeps the US image free from laser lamp coherent noise. With this optimization scheme, 15 fps in both PAT and coregistered modes have been achieved and this frame rate is only limited by our laser repetition frequency. 2.3.PC Imaging Code OptimizationBased on our system structure, several optimization methods are implemented in the PC program developed in C/C++ to maximize the imaging frame rate. This is done by using a multithreads technique and fast data processing in the Fourier domain. In the US mode, the delay profiles for transmission focusing and receiving beamforming are calculated from the coordinates of array elements, preset transmission focus, and dynamic receiving focus. The computation for these delays is time consuming and is repeated for a fixed imaging configuration (transmission focus, number of scan lines, and angular scan range). To save computation time, these delay profiles were precalculated before each experiment and stored in look-up tables for fast access. Similarly, once the imaging configuration is determined, the interpolation coefficients for scan conversion can also be precalculated and stored in a look-up table. Conventionally, the procedure to form one image frame requires sequential DAQ and data processing. We adopted a multithreads technique to reduce the time for each image frame using direct memory access between the PCIe card and the PC. In the PC program, two threads are created for the DAQ and data processing, respectively. Two sets of Ping-Pong buffers are alternately used for these two threads, allowing them to run simultaneously. The DAQ thread acquires data from the FPGA in the PCIe card, and the processing thread performs the required signal processing of the buffered data then displays each image frame on the screen. Special care is taken to avoid simultaneous access of the same set of buffers by two different threads. In the conventional method, the time for one frame is the total DAQ time and processing time. With a multithreads technique, the time for one frame is the maximum of these two which almost doubles the imaging frame rate in our application. In the PAT mode, beam envelope detection is the most time consuming part of image formation. Hilbert transform or base-band demodulation methods are often used in envelope detection. Low- and high-pass filters are intensively used in these two algorithms. Instead of using conventional convolution methods to implement these filters, fast Fourier transform (FFT)-based34 circular convolution is used to reduce the computation time. To process two beams, conventional convolution requires multiplications, where is the finite impulse response (FIR) filter length and is the PAT beam length, while an FFT-based circular convolution takes three rounds of FFT operation (one forward FFT by combining two real-beam data into one complex input and two inverse FFTs), which requires multiplications. For our 6-MHz transducer, the optimized FIR filter length is 57 and the PAT beam length is 2048. Therefore, the time needed for an FFT-based circular convolution is only about 15% of the time spent on a conventional convolution. 2.4.Imaging ProbeThe imaging probe consists of a commercial 128 elements transvaginal US array (6-MHz central frequency and 80% bandwidth, W.L. Gore and Associates, Inc., Newark, Delaware) and 36 core fibers from a pair of high-power fiber-optic beam splitter assemblies (Fig. 3).29 Both transducer and fibers are housed in a home-made protecting frame, which also keeps them from getting too close to the tissue and causing injury during imaging. Additionally, the fibers are positioned so that their distal ends are approximately 1 cm away from the tissue surface during imaging. In this way, the beam is expanded at the tissue surface and the fluence is decreased even more. The 1-cm distance also ensures that the light propagates from the fibers, with a numerical aperture of 0.2, to the tissue surface without reflecting off the surfaces of the plastic cover and transducer. The illumination patterns in tissue at different imaging depths have been reported in our prior publications.29,35 Studies have shown that the laser beams from the fibers spread out as they propagate through tissue and merge together at a depth of about 1 cm to form a fairly uniform illumination pattern at the center directly below the US imaging probe. Since the vagina muscle wall is about 8-mm to 1-cm thick, a uniform illumination of the ovary behind the vaginal wall can be achieved. The light fluence delivered by the probe on the tissue surface is about , which is below the American National Standards Institute maximum permissible exposure (MPE) of at 750 nm. Light from the laser is first coupled into the input ends of the two splitters using a convex lens and 50/50 beam splitter arrangement. The laser is a tunable-wavelength Ti:Sapphire (Symphotics TII, LS-2211, Camarillo, California) optically pumped by a Q-switched Nd:YAG (Symphotics TII, LS-2134). It delivers 20-ns pulses at a 15-Hz repetition rate with 20 mJ/pulse at the imaging wavelength of 750 nm. 2.5.ExperimentsThe first set of experiments was performed on a thin black thread to obtain the system lateral resolution and axial sensitivity. The second set of experiments was conducted using a tumor-bearing mouse to demonstrate the real-time imaging capability of the system. The third set of experiments was performed on ex vivo malignant and normal ovaries to demonstrate the diagnostic imaging capability of the system. The ovaries were freshly excised after an oophorectomy at the UConn Health Center, and the patient signed the informed consent approved by the Institute Review Board. 3.ResultsTo obtain the lateral resolution of the system, a diameter black thread was placed in a water tank at a 30-mm depth with its orientation perpendicular to the imaging plane. The lateral profiles of pulse-echo US and PAT were measured and are shown in Fig. 4(a). Additionally, the maximum amplitude of the beam envelope in the PAT mode was recorded and the system noise was estimated from the root mean square value of the beam envelope when laser transmission was disabled. SNR or sensitivity of the black thread was calculated by (max PAT envelope/system noise). By varying the distance between the black thread and the probe surface from 1 to 6.25 cm with an interval of 2.5 mm, the SNR at each depth is calculated and the curve is shown in Fig. 4(b). The SNR dropped about 24 dB from 1 to 6 cm. Fig. 4(a) Lateral profiles of pulse-echo US and PAT measured from a black thread. (b) Axial sensitivity or SNR of PAT mode.  Since there is no theory for wideband transducer arrays, narrowband theory is used for the lateral resolution estimation.36,37 For a pulse-echo mode, the narrowband theory indicates that the beam profile follows a pattern in the lateral direction, where is the effective size of the transducer in the lateral direction , is the US wavelength, and is the depth. In the PAT mode, the lateral beam profile is given by a sinc function because of one-way reception only. Note that the 65 nearest elements were used in the beamforming, which resulted in an effective transducer array size of 9.56 mm. The measured lateral resolutions of both pulse-echo and PAT modes agree well with theoretical values. From theory, full widths at half maximums of lateral beam profiles are 1.37 deg in pulse-echo and 1.86 deg in the PAT mode, while the measured values are 1.56 and 2.01 deg, respectively. An imaging setup for the in vivo animal experiment is shown in Fig. 3. A calibrated intralipid of absorption coefficient and reduced scattering coefficient was placed in a plastic bag and used as a coupling medium. The tumor-bearing mouse was under anesthesia by inhalation of 1.5% isoflurane. The animal protocol was approved by the Institutional Animal Care and Use Committee of the University of Connecticut. US imaging was performed first, and the real-time images (Video 1) were used to locate the tumor area at 20 fps. Once the tumor area was identified, the coregistered US/PAT scan was performed. Video 2 shows the coregistered images and demonstrates the real-time imaging capability of the system while scanning the tumor area at 5 fps (averaging PAT acquisitions of three laser pulses). To guide the readers, we have included white circles in both movies to mark the tumor area. For better visualization of the tumor vasculature content, all PAT images in Video 2 were normalized to the peak of the PAT beam envelopes of all frames during the scan procedure and are shown with a 15-dB dynamic range. The US images were shown with a 40-dB dynamic range. The wavelength used was 750 nm. In the second part of the experiment, the computer-controlled tunable Ti:Sapphire laser was used to obtain 10 PAT acquisitions at each wavelength from 745 to 835 nm with a 10-nm step size. After that, the coregistered US and oxy-saturation () image was formed, where the value was estimated from the relative ratio of oxy-hemoglobin to the total-hemoglobin concentrations, pixel-by-pixel using a gradient descent fitting technique to minimize the least squares error between the measurement at different wavelengths and a linear model comprising the concentration of oxy- and deoxy-hemoglobins.28 Note that the measurements are constructed from the PAT value at each pixel normalized by the laser energy per pulse as measured at each wavelength. Also, the defined model assumes that the fluence profile over the imaging plane does not change over the selected wavelength window. For extensive details about the model used and assumed approximations, readers are referred to Ref. 28. Figure 5 shows the fitting results of one pixel of 99.14% . The probe output optical energy was measured during data acquisition at each wavelength and used to compensate the PAT measurements before estimation. Figure 6 shows the coregistered US/PAT images at 745, 805, and 835 nm wavelengths along with the resulting coregistered image estimated from all 10 PAT wavelengths. Note that the tumor closer to the tissue surface appears to have a lower as compared to the inside; this observation is quite similar to what we observed in a previous study.28 Skin, in general, has higher absorption at lower wavelengths due to a higher deoxygenated hemoglobin content and thus lower . Video 1Real-time ultrasound scan for quick tumor area identification of tumor-bearing mouse (QuickTime, 8.7 MB) [URI: http://dx.doi.org/10.1117/1.JBO.19.7.076020.1]. 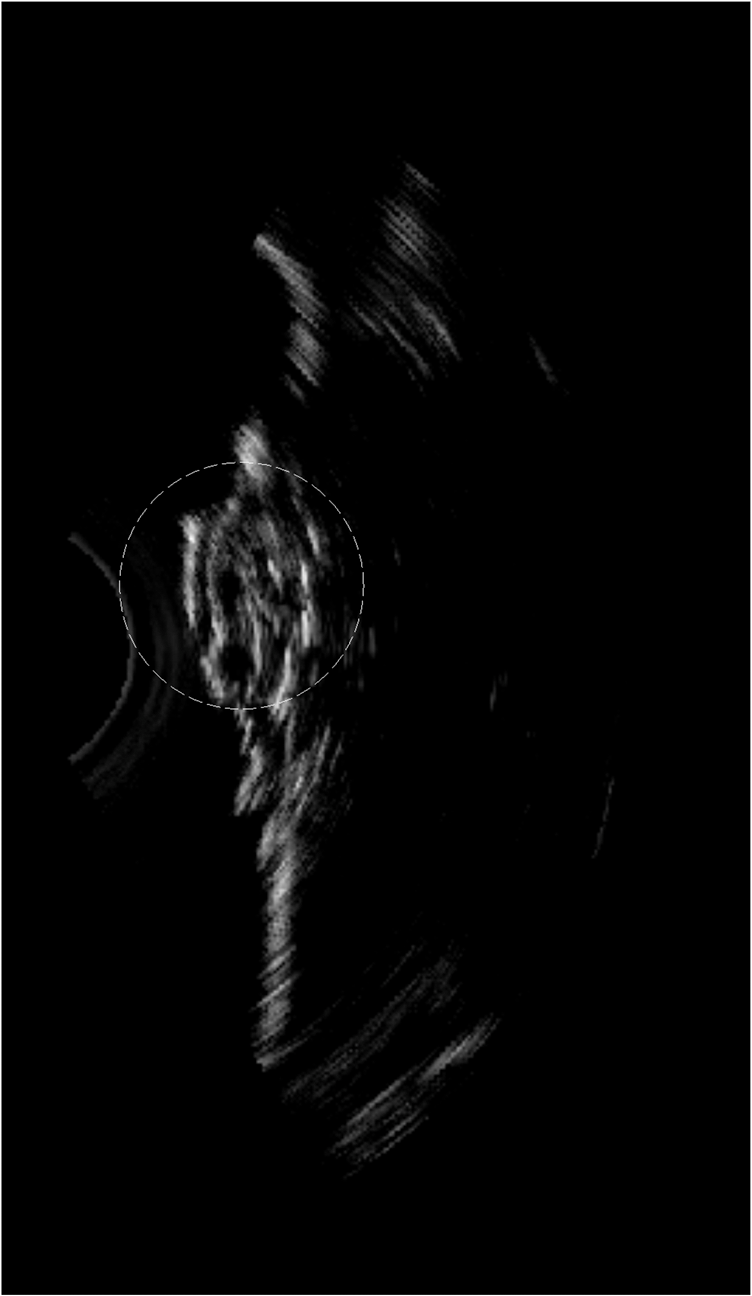 Video 2Real-time coregistered US/PAT scan of mouse tumor area in 5 fps (QuickTime, 3.9 MB) [URI: http://dx.doi.org/10.1117/1.JBO.19.7.076020.2]. 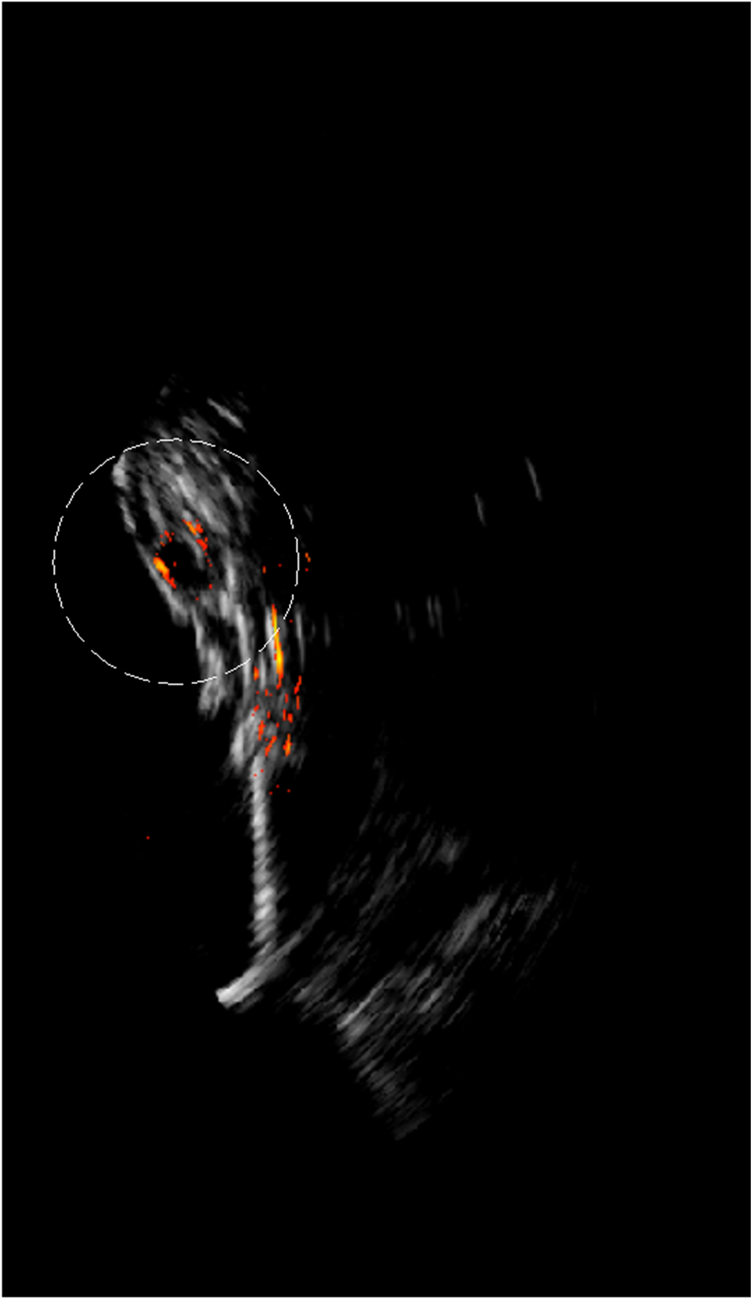 Fig. 5Fitting of 10 PAT measurements for one pixel to obtain a smoothed image of the oxygen saturation.  Fig. 6The first three images from left are coregistered US/PAT at different wavelengths (indicated in the upper left corners), the first image from right is a coregistered image obtained using gradient descent estimation from 10 PAT acquisitions at 10 different wavelengths. US images are in grayscale and the tumor is shown as a round hypoechoic region marked by an arrow.The PAT absorption images (first three) and image are shown in color. The right color bar is the scale. 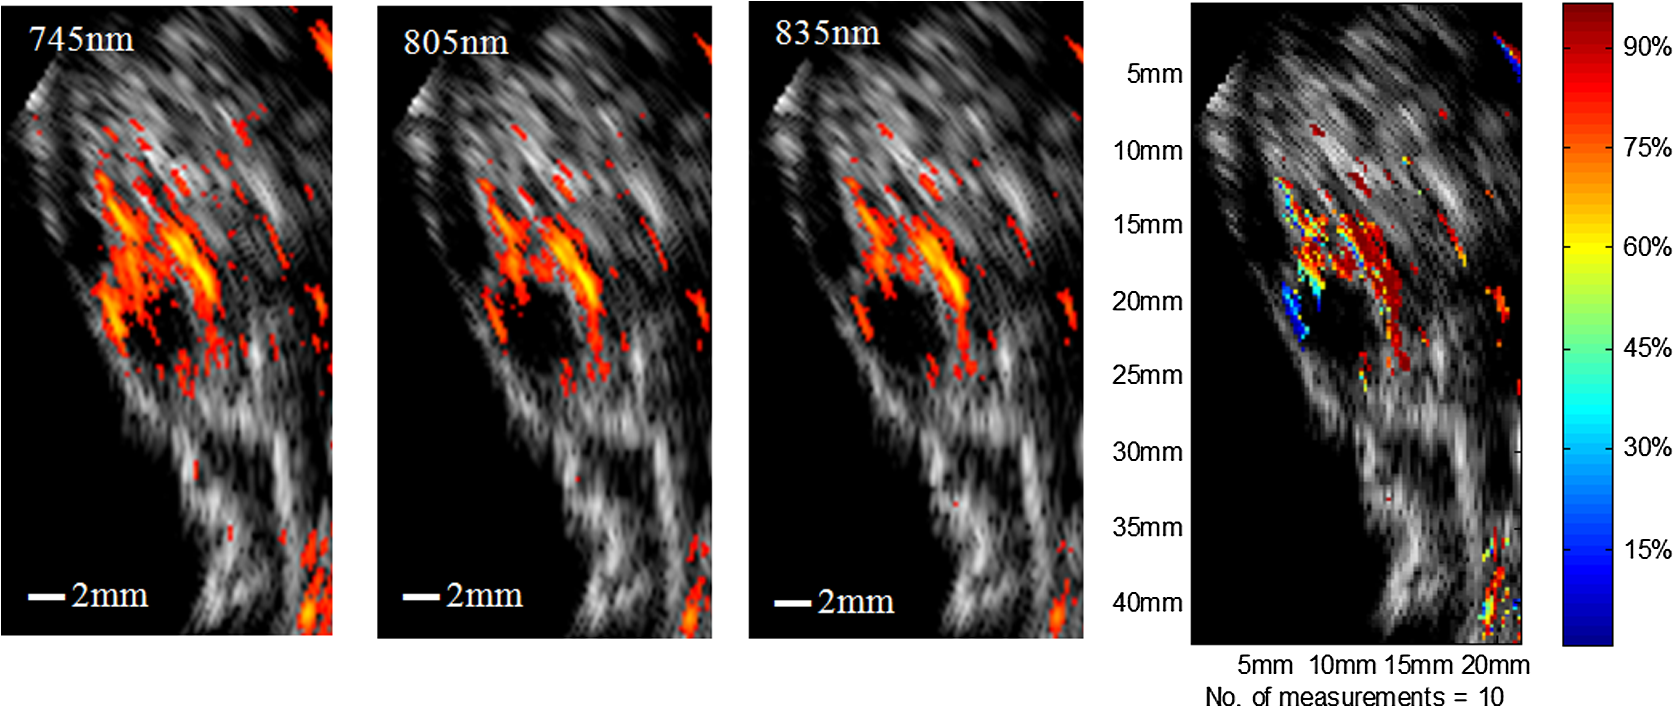 In the third set of experiments, a malignant and a normal ovary were imaged ex vivo. Each ovary was mounted on a supporting frame made of a transparent thin optical fiber net and was submerged inside a calibrated intralipid tank of absorption coefficient and reduced scattering coefficient. The ovary was located about 10-mm deep from the probe surface. The PAT signals of the ovaries were weaker than that of the black thread, thus an average of 64 laser pulses was used to improve the quality of images which reduced the PAT image rate to about 4 s per frame. Figure 7 shows the coregistered US/PAT images which reveal the blood contents on the surface of the malignant and normal ovaries. By comparing both images, we can see much a higher vasculature content on the surface of the malignant ovary than that of the normal one. Fig. 7Examples of coregistered US/PAT images of a (a) malignant ovary and (b) a normal ovary. US images are shown in gray scale, and the level of intensity increases from black to white. The PAT images are shown in color, and the absorption increases from red to yellow. Note that the images in this set are shown with 40-dB dynamic range in pulse echo US and 15-dB dynamic range in PAT. The PAT images were normalized to the maximum envelope of the malignant ovary. 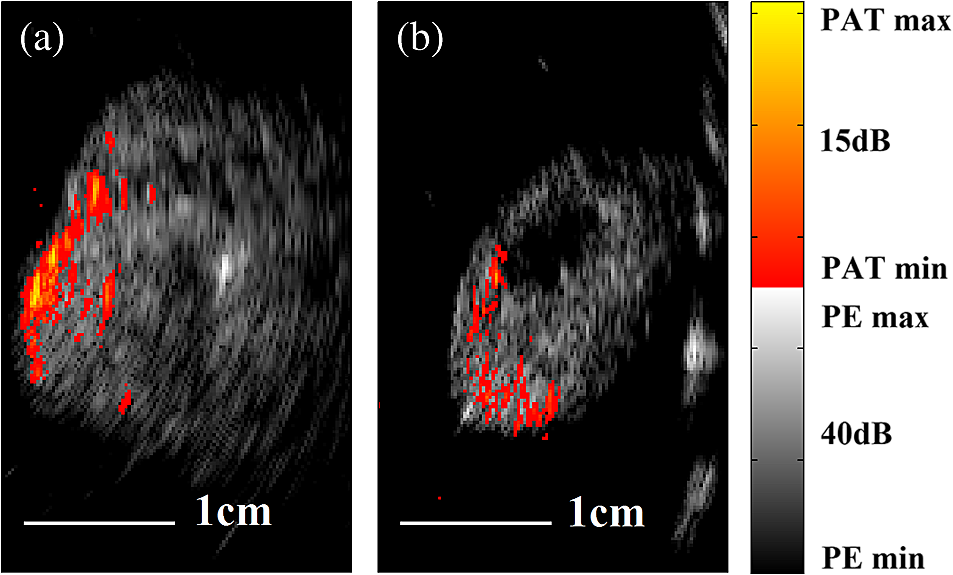 4.SummaryA new US/PAT system with real-time imaging capability to assist physicians in transvaginal scans for ovarian cancer detection and diagnosis is presented. With the ultrafast PCIe data transfer, implementation of multithreads and Fourier domain data processing in PC interface software, and dedicated FPGA structure and optimization, the system can achieve 20 fps in US mode, 15 fps in PAT mode, and 15 fps in the coregistered mode. The system frame rate is limited by the laser PRR, along with the number of PAT averaging times needed to improve the SNR. System lateral resolution matches well with narrow-band estimation in both US pulse echo and PAT mode. The real-time scan capability of the system has been shown using an in vivo tumor-bearing mouse. Furthermore, the image quality achieved by the system was demonstrated by imaging ex vivo human ovaries submerged in a scattering medium. We envision that the real-time US mode will be used for fast scans to quickly identify ovaries and the coregistered US/PAT will be used to characterize the ovaries and assist physicians with diagnosis. Currently, a larger number of PAT acquisitions are averaged to obtain high-quality images, showing features of the vasculature content of the ovaries. These features in PAT images can be used to further validate the image classifier developed by our group.38–40 It is possible to obtain acceptable images even without averaging at 15 fps. However, when the signal is too weak such as that obtained from large ovarian cancers of more than 8 to 10 cm in size, a lower dynamic range has to be used and most features of the images are lost. For in vivo imaging, it is expected that a higher vascular content may be obtained than that of ex vivo scan due to blood loss of the excised ovaries. Of course, the vagina muscle wall and the surrounding tissue may scatter and absorb light which may cause a reduction in the PAT signals. Currently, we are in the process of obtaining an approval for human subject protocol, and we will report our in vivo studies using the reported coregistered US/PAT system in the near future. AcknowledgmentsThis research is supported by the National Cancer Institute (NIH R01CA151570). We thank Dr. Molly Brewer for providing patient ovaries used in this study. ReferencesD. A. Fishmanet al.,
“The role of ultrasound evaluation in the detection of early-stage epithelial ovarian cancer,”
Am. J. Obstet. Gynecol., 192
(4), 1214
–1222
(2005). http://dx.doi.org/10.1016/j.ajog.2005.01.041 AJOGAH 0002-9378 Google Scholar
J. TammelaS. Lele,
“New modalities in detection of recurrent ovarian cancer,”
Curr. Opin. Obstet. Gynecol., 16
(1), 5
–9
(2004). http://dx.doi.org/10.1097/00001703-200402000-00003 COOGEA 1040-872X Google Scholar
V. Nossovet al.,
“The early detection of ovarian cancer: from traditional methods to proteomics. Can we really do better than serum CA-125?,”
Am. J. Obstet. Gynecol., 199
(3), 215
–223
(2008). http://dx.doi.org/10.1016/j.ajog.2008.04.009 AJOGAH 0002-9378 Google Scholar
B. V. Calsteret al.,
“Discrimination between benign and malignant adnexal masses by specialist ultrasound examination versus serum CA-125,”
J. Natl. Cancer Inst., 99
(22), 1706
–1714
(2007). http://dx.doi.org/10.1093/jnci/djm199 JNCIEQ 0198-0157 Google Scholar
M. Goozner,
“Personalizing ovarian cancer screening,”
J. Natl. Cancer Inst., 102
(15), 1112
–1113
(2010). http://dx.doi.org/10.1093/jnci/djq296 JNCIEQ 0198-0157 Google Scholar
A. ShaabanM. Rezvani,
“Ovarian cancer: detection and radiologic staging,”
Clin. Obstet. Gynecol., 52
(1), 73
–93
(2009). http://dx.doi.org/10.1097/GRF.0b013e3181961625 COGYAK 0009-9201 Google Scholar
S. A. FuntH. Hedvig,
“Ovarian malignancies,”
Topics Magn. Res. Imaging, 14
(4), 329
–337
(2003). http://dx.doi.org/10.1097/00002142-200308000-00005 TMRIEY 0899-3459 Google Scholar
R. Kumaret al.,
“Positron emission tomography in gynecological malignancies,”
Expert Rev. Anticancer Ther., 6
(7), 1033
–1044
(2006). http://dx.doi.org/10.1586/14737140.6.7.1033 ERATBJ 1473-7140 Google Scholar
A. YodhB. Chance,
“Spectroscopy and imaging with diffusing light,”
Phys. Today, 48
(3), 34
–40
(1995). http://dx.doi.org/10.1063/1.881445 PHTOAD 0031-9228 Google Scholar
L. V. WangH. Wu, Biomedical Optics: Principles and Imaging, Wiley, Hoboken, New Jersey
(2007). Google Scholar
V. Tuchin, Tissue Optics: Light Scattering Methods and Instruments for Medical Diagnosis, 2nd ed.SPIE Press Publisher, Bellingham Washington
(2007). Google Scholar
L. V. Wang,
“Prospects of photoacoustic tomography,”
Med. Phys., 35
(12), 5758
–5767
(2008). http://dx.doi.org/10.1118/1.3013698 MPHYA6 0094-2405 Google Scholar
X. Wanget al.,
“Noninvasive laser-induced photoacoustic tomography for structural and functional in vivo imaging of the brain,”
Nat. Biotechnol., 21
(7), 803
–806
(2003). http://dx.doi.org/10.1038/nbt839 NABIF9 1087-0156 Google Scholar
A. OraevskyA. A. Karabutov,
“Ultimate sensitivity of time-resolved optoacoustic detection,”
Biomed. Optoacoust., 3916
(1), 228
–239
(2000). http://dx.doi.org/10.1117/12.386326 PSISDG 0277-786X Google Scholar
V. G. Andreevet al.,
“Optoacoustic tomography of breast cancer with arc-array transducer,”
Proc. SPIE, 3916 36
–47
(2000). http://dx.doi.org/10.1117/12.386339 PSISDG 0277-786X Google Scholar
R. A. Krugeret al.,
“Photoacoustic ultrasound reconstruction tomography,”
Med. Phys., 22
(10), 1605
–1609
(1995). http://dx.doi.org/10.1118/1.597429 MPHYA6 0094-2405 Google Scholar
N. Weidneret al.,
“Tumor angiogenesis and metastasis—correlation in invasive breast carcinoma,”
N. Engl. J. Med., 324
(1), 1
–8
(1991). http://dx.doi.org/10.1056/NEJM199101033240101 NEJMAG 0028-4793 Google Scholar
P. VaupelF. KallinowskiP. Okunieff,
“Blood flow, oxygen and nutrient supply, and metabolic microenvironment of human tumors: a review,”
Cancer Res., 49
(23), 6449
–6465
(1989). CNREA8 0008-5472 Google Scholar
J. J. Niederhauseret al.,
“Combined ultrasound and optoacoustic system for real-time high-contrast vascular imaging in vivo,”
IEEE Trans. Med. Imaging, 24
(4), 436
–440
(2005). http://dx.doi.org/10.1109/TMI.2004.843199 ITMID4 0278-0062 Google Scholar
S. Sethuramanet al.,
“Development of a combined intravascular ultrasound and photoacoustic imaging system,”
Proc. SPIE, 6086 60860F
(2006). http://dx.doi.org/10.1117/12.646372 PSISDG 0277-786X Google Scholar
P. Guoet al.,
“Co-registered 3-D ultrasound and photoacoustic imaging using a 1.75D 1280-channel ultrasound system,”
Proc. SPIE, 6437 643713
(2007). http://dx.doi.org/10.1117/12.706702 PSISDG 0277-786X Google Scholar
A. Aguirreet al.,
“Co-registered 3-D ultrasound and photoacoustic imaging system for ovarian tissue characterization,”
J. Biomed. Opt., 14
(5), 054014
(2009). http://dx.doi.org/10.1117/1.3233916 JBOPFO 1083-3668 Google Scholar
R. G. Kolkmaet al.,
“Real-time in vivo photoacoustic and ultrasound imaging,”
J. Biomed. Opt., 13
(5), 050510
(2008). http://dx.doi.org/10.1117/1.3005421 JBOPFO 1083-3668 Google Scholar
S. A. Ermilovet al.,
“Development of laser optoacoustic and ultrasonic imaging system for breast cancer utilizing handheld array probes,”
Proc. SPIE, 7177 717703
(2009). http://dx.doi.org/10.1117/12.812192 PSISDG 0277-786X Google Scholar
T. Harrisonet al.,
“Combined photoacoustic and ultrasound biomicroscopy,”
Opt. Express, 17
(24), 22041
–22046
(2009). http://dx.doi.org/10.1364/OE.17.022041 OPEXFF 1094-4087 Google Scholar
U. Alqasemiet al.,
“FPGA-based reconfigurable processor for ultrafast interlaced ultrasound and photoacoustic imaging,”
IEEE Trans. Ultrason. Ferroelectr. Freq. Control, 59
(7), 1344
–1353
(2012). http://dx.doi.org/10.1109/TUFFC.2012.2335 ITUCER 0885-3010 Google Scholar
P. Kumavoret al.,
“Co-registered pulse-echo/photoacoustic transvaginal probe for real time imaging of ovarian tissue,”
J. Biophotonics, 6
(6–7), 475
–484
(2013). http://dx.doi.org/10.1002/jbio.v6.6/7 JBOIBX 1864-063X Google Scholar
R. A. Mucci,
“A comparison of efficient beamforming algorithms,”
IEEE Trans. Acoust., Speech, Signal Process., 32
(3), 548
–558
(1984). http://dx.doi.org/10.1109/TASSP.1984.1164359 IETABA 0096-3518 Google Scholar
C. G. A. HoelenF. F. M. de Mul,
“Image reconstruction for photoacoustic scanning of tissue structures,”
Appl. Opt., 39
(31), 5872
–5883
(2000). http://dx.doi.org/10.1364/AO.39.005872 APOPAI 0003-6935 Google Scholar
U. Alqasemiet al.,
“Real-time co-registered ultrasound and photoacoustic imaging system based on FPGA and DSP architecture,”
Proc. SPIE, 7899 78993S
(2011). http://dx.doi.org/10.1117/12.875616 PSISDG 0277-786X Google Scholar
U. Alqasemiet al.,
“Ultrafast ultrasound and photoacoustic co-registered imaging system based on FPGA parallel processing,”
Proc. SPIE, 8223 82232U
(2012). http://dx.doi.org/10.1117/12.907583 PSISDG 0277-786X Google Scholar
M. FrigoS. G. Johnson,
“The design and implementation of FFTW3,”
Proc. IEEE, 93
(2), 216
–231
(2005) http://dx.doi.org/10.1109/JPROC.2004.840301 Google Scholar
B. Tavakoliet al.,
“Effect of ultrasound transducer face reflectivity on the light fluence inside a turbid medium in photoacoustic imaging,”
J. Biomed. Opt., 15
(4), 046003
(2010). http://dx.doi.org/10.1117/1.3462930 JBOPFO 1083-3668 Google Scholar
A. Aguirreet al.,
“Coregistered three-dimensional ultrasound and photoacoustic imaging system for ovarian tissue characterization,”
J. Biomed. Opt., 14
(5), 054014
(2009). http://dx.doi.org/10.1117/1.3233916 JBOPFO 1083-3668 Google Scholar
J. L. SchwartzB. D. Steinberg,
“Ultrasparse, ultrawideband arrays,”
IEEE Trans. Ultrason. Ferroelectr. Freq. Control, 45
(2), 376
–393
(1998). http://dx.doi.org/10.1109/58.660149 ITUCER 0885-3010 Google Scholar
A. Aguirreet al.,
“Potential role of coregistered photoacoustic and ultrasound imaging in ovarian cancer detection and characterization,”
Transl. Oncol., 4
(1), 29
–37
(2011). http://dx.doi.org/10.1593/tlo.10187 1936-5233 Google Scholar
U. Alqasemiet al.,
“A recognition algorithm for assisting ovarian cancer diagnosis using co-registered ultrasound and photoacoustic images: an ex vivo study,”
J. Biomed. Opt., 17
(12), 126003
(2012). http://dx.doi.org/10.1117/1.JBO.17.12.126003 JBOPFO 1083-3668 Google Scholar
H. Liet al.,
“Classification algorithm of ovarian tissue based on co-registered ultrasound and photoacoustic tomography,”
Proc. SPIE, 8943 894349
(2014). http://dx.doi.org/10.1117/12.2040467 PSISDG 0277-786X Google Scholar
|