

|
|
1.IntroductionThe photoacoustic (PA) effect has been intensively investigated in recent years using various combinations of optical excitation and ultrasonic detection schemes aimed toward different applications.1,2 In PA imaging, the first necessity is to identify a light source with the output wavelength and pulse duration suitable to image the sample of interest. Then, an ultrasonic transducer with appropriate bandwidth and geometrical configuration is chosen to detect the PA waves for imaging. The sizes and geometric arrangement of optical illumination and ultrasonic detection are determined by the anatomic site, size of the targeted tissue volume, required spatial resolution, and imaging depth. In almost all the existing PA imaging systems, PA signals are generated through linear optical absorption, i.e., optical energy is deposited through single-photon absorption. The PA generation through the nonlinear optical energy deposition induced by ultra-short near-infrared (NIR) pulses3–5 has not been thoroughly investigated. There are several potential benefits to conducting nonlinear optical-absorption-based PA imaging, especially in optical-resolution photoacoustic microscopy (OR-PAM). First, by employing NIR light excitation, the imaging depth of OR-PAM can be potentially extended to deeper regions in tissue as compared to visible light excitation. This is in full analogy with the improved imaging depth in two-photon (TP) fluorescence microscopy as compared with single photon confocal fluorescence microscopy.6,7 Second, nonlinear optical absorption can often be tuned to be associated with specific molecular signatures, such as in stimulated Raman PAM8 to achieve label-free molecular imaging. Third, because PA signal amplitude is proportional to the local optical energy deposition, a TP-PAM contrast agent requires only a large optical absorption cross section and a high local concentration to achieve high-quality imaging. In comparison, a contrast agent for TP fluorescence microscopy requires a high quantum yield, in addition to its absorption cross section and local concentration. As a result, contrast agent development for TP-PAM can potentially be greatly simplified from the current practice. Finally, TP-PAM can potentially penetrate even deeper than the TP fluorescence microscopy, since ultrasonic attenuation is much weaker than optical attenuation in biological tissue,9 and TP-PAM is only subjected to one-way optical attenuation rather than the round-trip optical attenuation found in TP fluorescence microscopy. Several groups previously studied the TP absorption-induced PA generation10,11 and applied it to image the dye labeled samples in two dimensions. Although the quadratic dependence of PA amplitude on illuminating power density was obtained to verify the nonlinear absorption nature, these studies were not comprehensive because the quadratic dependence is not always obvious at low illumination fluence. Moreover, the influence of optical scattering on the TP-PA generation has not yet been investigated, and TP-PA imaging has not been demonstrated in optically scattering medium and in three dimensions. In this paper, we first analytically formulated the TP-PA generation based on TP optical absorption and thermoelastic ultrasonic generation. Then, we experimentally measured the TP-PA signals from samples made from Rhodamine B solution using femtosecond laser illumination and acquired its quadratic amplitude dependence on incident laser fluence. We further conducted time-delay experiments to temporally overlap two femtosecond laser pulse trains to verify the nonlinear nature of the TP-PA generation and investigated the decay of the TP-PA amplitude on an increasing optical scattering coefficient in a scattering medium. At the same time, all the TP-PA studies were compared with correspondingly generated TP photoluminescence (PL) signals. Finally, we compared TP-PL and TP-PA imaging in turbid media and demonstrated the capability of volumetric TP-PA imaging. 2.TheoryTP-PA generation relies on TP absorption, which takes place when an electron migrates to an excited state by simultaneously absorbing two photons with a combined energy matching the electronic energy band gap. In tissue, TP absorption usually requires a much higher photon density than its one-photon counterpart12 to generate comparable fluorescence emission. We define the TP absorption cross section as . The number of photons absorbed during TP excitation, is given by an integration within the laser focus volume where [molecules ] is a parameter related to the photobleaching of the material at position and time , and is the incident laser fluence.13 Under stabilized optical illumination, the incident laser fluence can be separated into temporal and spatial components as Assuming negligible photobleaching and approximately constant spatial distribution, and can be considered as constants, which can be simplified as and , where (Ref. 13). Hence, we have .TP optical excitation occurs within a time scale that is much shorter than the radiative and nonradiative lifetimes of tissue, making it possible to approximate the excitation by a delta function and consider it as only a single pulse. After excitation, electron decay occurs by either radiative or nonradiative processes. The efficiency of the radiative process is given by the quantum yield [dimensionless] of the material, whereas the nonradiative efficiency can be considered as . The number of radiative and nonradiative events created from a single laser pulse is, therefore, given by and The detected TP radiative fluence can be expressed as where is a constant related to the detector efficiency, is the laser power, NA is the numerical aperture of the focusing objective, is Planck’s constant, is the speed of light, and is the incident laser wavelength.The nonlinear PA signal amplitude acts similarly to the relation between nonlinear radiative and incident fluence with only the replacement of the nonradiative quantum yield. For ultrasonic signal amplitudes, expressing the signal in terms of the resulting ultrasonic pressure wave leads to the simplistic form , where is the speed of the ultrasonic wave. When the pulse duration of the excitation laser is much shorter than the tissue’s thermal confinement and stress confinement thresholds, the ultrasonic pressure wave induced by the nonlinear excitation process is directly related to the nonradiative decay,14 or the energy to heat transfer, by where [dimensionless] is the Grüneisen parameter and [] is the absorbed optical energy transferred to heat at the location . Here, we can approximate , where is the energy transferred in the decay over the density in which absorption is taking place. By substituting , we can rewrite Eq. (6) as which suggests a quadratic relationship between the TP-PA signal amplitude and the illuminating laser fluence .3.Experimental Materials and MethodsTo experimentally verify the expected quadratic relationship, we built a system that can simultaneously detect both TP-PA and TP-PL signals based on a commercial inverted microscope platform (IX81, Olympus, Shinjuku, Japan) as shown in Fig. 1. We used an amplified femtosecond laser system (Solstice, Newport, Irvine) as the irradiation source. For the amplifier output, the wavelength was 795 nm, the pulse duration was 100 fs, and the pulse repetition rate was 1 kHz. Although the ultra-short oscillator output was used by other groups for TP-PA excitation,11,15 and the laser repetition rate is theoretically limited only by the bandwidth of the ultrasonic detector, we intentionally used a 1-kHz amplifier output rather than the 80-MHz oscillator output in order to track each individual laser pulse. Fig. 1Schematic of the TP-PA and TP-PL imaging setup. A polarizing-based attenuator was used to control the laser output power. A polarizer was placed in the path of the Pulse 2 to add an optional adjustment to match the powers of the two pulses. Both the ultrasonic transducer and photo diode (PD) signals were routed to the analog to digital converter (AD). The scanning mirror (SM) was controlled by a Labview program that synchronized the signal acquisition and mirror scanning. BS: beamsplitter; P: polarizer; UT: ultrasonic detector; W: water tank; Obj: objective lens; Dich: dichroic mirror; RM: removable mirror.  We passed the amplified laser output through an attenuator to keep the mean power below . We split the attenuated laser pulses by a beamsplitter (CM1-BS014, Thorlabs, Newton) and later rejoined them after routing one pulse (the Pulse 2 in Fig. 1) through a delay line. Routing Pulse 2 through the delay line enabled us to adjust the temporal overlapping of 2 fs pulses to verify the nonlinear effect. For statistical analysis, we used a 0.1-NA objective lens (PLN4X, Olympus) to focus the laser illumination onto samples, allowing more precise control of the laser fluence at the focus. We used an EMCCD (C9100-13, Hamamatsu, Hamamatsu, Japan) to detect TP-PL signals at an exposure time of 100 ms, and a custom-made 40-MHz (60% wideband) piezoelectric needle transducer to detect the TP-PA signals. The TP-PA signals were amplified by 40 dB using a commercial amplifier (5678, Olympus) and were digitized by a digital oscilloscope (TDS5034B, Tektronix, Beaverton) at a sampling rate of with averaging over 1000 frames. The laser amplifier synchronization output triggered both TP-PA and TP-PL acquisitions. For imaging experiments, we used a 0.45-NA NIR objective (LCPlanN20X/0.45IR, Olympus) to focus the laser illumination onto the sample, where the laser fluence was kept constant. We used a 15-MHz ultrasonic detector (V313-SM, Olympus) and a photodiode (PDA36A, Thorlabs) to detect the ultrasonic and PL signals for image reconstruction, respectively. A removable mirror was placed in front of the EMCCD to switch between TP-PL signal and the image acquisitions. The detected signals were amplified 40 dB without averaging. A commercial galvanometer scanning mirror driven by a homemade Labview program was used to scan the optical illumination for imaging. The imaging speed is therefore limited by the pulse repetition rate of the amplifier. We used Rhodamine B (Exciton) to make phantoms due to its high two-photon quantum yield as compared to other fluorescent molecules.13,16 The first phantom contained 0.3 mg Rhodamine B dissolved in 10 mL methanol, which yielded a concentration of . We sealed 5 mL of the Rhodamine B solution in a one-inch diameter Petri dish during experiments to verify the nonlinear signatures of the TP-PA generation. To compare attenuations of TP-PA and TP-PL in a scattering medium, we built a second phantom by continuously passing Rhodamine B solution through a quartz capillary tube (inner diameter: 320 μm; outer diameter: 430 μm; Polymicro Technologies, Phoenix). During measurements, the tube was immersed in a water tank (containing 5 mL distilled water) 2 mm above the bottom and the transducer was placed 2 mm away from the tube. We gradually added silica sphere suspension (diameter: ; concentration: 2%; Duke Scientific, Palo Alto) into the water tank in increments to increase the optical scattering coefficient in the immersion medium. 4.Results and DiscussionsDirectly observing the quadratic power dependence of signal amplitude has been considered the standard proof to confirm the nonlinear nature of TP excitation.17–19 As the first step, we measured the variation of the PA signal amplitude with illuminating laser intensity. We also measured the variation of the correspondingly induced PL signal amplitude on the illuminating laser intensity for comparison. The experimentally measured amplitude variations of PA and PL are shown in Figs. 2(a) and 2(b), respectively. As expected, both signal amplitudes increase nonlinearly when we increased the laser output power from 40 to . Polynomial fitting of the experimental data yields a power of 1.97 and 2.01 in the PA and PL processes, respectively. These results are consistent with theoretical expectations described in Eqs. (3) and (7). The log-plots of the TP-PA and TP-PL amplitude variations are also given in their respective figures as insets. Fig. 2Amplitude variations of (a) TP-PA and (b) TP-PL signals with respect to irradiating laser power density. Power density was adjusted using a polarization-based attenuator and measured with a calibrated integrating sphere.  Although quadratic power dependences were observed in the TP-PA and TP-PL signals, linear absorption may be comparable to the TP absorption at lower incident powers, making quadratic fitting unreliable. To further verify the nonlinear nature of the TP-PA generation, we performed a time-delay experiment. As shown in Fig. 1, we separated a laser pulse by a beamsplitter and later rejoined the separated pulses after passing one of them through a delay line. We compared PA and PL intensities under four different illuminating cases as illustrated in Fig. 3. In Cases 1 and 2, only one of the separated pulses illuminated the sample; in Case 3, the two separated pulses immediately followed each other without temporal overlapping; and in Case 4, the two separated pulses completely overlapped temporally with each other. If the illuminating intensities in Cases 1 and 2 are and , respectively, we can expect that where represents the detected PA intensity for a particular illuminating case. If , we should expect . Similar relationships among PL intensities should also hold in these four cases.Fig. 3Time-delay experiment showing the nonlinear nature of TP-PA and TP-PL signal generations. The top part shows the temporal relationship of the two pulses. The bottom part shows the TP-PA and TP-PL signal amplitudes in different illumination cases. By adjusting the delay line, the pulses were separated in time by approximately 300 fs in the Case 3.  Figure 3 shows the time-delay experiment results. Both the PA and PL intensities are normalized with respect to their values in Case 1. In the PA experiment, we have a normalized intensity , which suggests . Using the relationship shown in Eq. (8), we expect and . As shown in Fig. 3, the experimentally measured normalized PA intensities in Cases 3 and 4 are and , respectively, which agree with the expected values. In addition, the measured PL intensities also follow Eq. (8). As a result, the time-delay studies further verified a dominant quadratic power dependence in the TP-PA generation. Since ultrasonic scattering is considered two orders of magnitude weaker than optical scattering in biological tissue,20 TP-PA microscopy is expected to offer larger penetration compared to TP-PL microscopy. Assuming the optical attenuation coefficients at the excitation () and emission () wavelengths are and , respectively, the attenuation of the detected TP-PL amplitude should be proportional to , where is the penetration depth. If we further define an effective ultrasonic attenuation coefficient , the attenuation of the detected TP-PA amplitude should be proportional to . If we independently normalize the TP-PA and TP-PL signal amplitudes with respect to their maximum values, the ratio between the two normalized signals is proportional to . If , we can expect that the attenuation ratio is only proportional to . We experimentally compared the influence of optical scattering on both detected TP-PL and TP-PA signal amplitudes. In our experiment, was held constant and we gradually changed the and by varying the concentration of the silica sphere suspension. The experimental results are shown in Fig. 4. The index of refraction, , of the silica spheres is approximated to be 1.46 for the nonlinear peak emission wavelength (600–610 nm) of Rhodamine B (actual values vary from ). A Mie theory algorithm was used to approximate the scattering coefficients for the incident laser and emitted radiation based on the silica sphere size, concentration, and medium index of refraction. To calculate the decay rate of the PA and PL amplitude versus the increasing scattering medium concentration, we first normalized the curves in Fig. 4 by their maximum values and took the natural log. Then, a linear function was used to fit the natural log values, where the slope of the resulting line quantifies the decay rate of the PA and PL signals. Finally, the ratio of the slopes from PA and PL (decay ratio) was taken to indicate how differently the PL and PA signals are affected by the changing scattering coefficient. Neglecting ultrasonic attenuation, Mie theory scattering predicts a decay ratio of 1.84 for the TP-PL to TP-PA decay. Experimental observations confirm that the PL signal amplitude decreases faster than the photoacoustic signal amplitude by a multiple of . Fig. 4Amplitude variations of TP-PA and TP-PL signals with respect to the optical scattering coefficient in the background medium.  Although the experimental decay ratio is similar to the theoretical estimation, we think that the deviation from the theoretical value could be due to several reasons. First, nonlinear beam pulses cause small changes in the refractive index of both the silica spheres and solution medium, which can cause fluctuations in predicted scattering values. Second, the index of refraction () of silica spheres can vary. Variations as low as can approximately cause an 18% difference in the TP-PL decay ratio over the 2-mm distance in our simulation study. Finally, the emission peak of Rhodamine B can be red-shifted in nonlinear excitation, causing a small percentage change ( for ) of the decay ratio.8 For a more direct comparison, we conducted the TP-PA and TP-PL imaging experiments simultaneously in turbid media. As previously described, Rhodamine B solution was pumped through a quartz capillary tube submerged in a scattering medium. We used a 15-MHz transducer for ultrasonic wave detection and an intralipid (1% concentration in water) solution as the scattering medium for optical attenuation. We used a higher NA objective to collect photons over a wider angle for TP-PA and TP-PL image comparison. Two-dimensional (2-D) () images were acquired at different intralipid concentrations for both TP-PA and TP-PL (Fig. 5). We can see that the TP-PL intensity drops faster than the TP-PA as the scattering coefficient increased in the medium. At a 1% concentration, the TP-PL signal almost vanished while we can still clearly visualize the capillary tube by TP-PA. Fig. 5Comparison of sections from TP-PL (top row) and TP-PA (bottom row) of a Rhodamine B filled capillary tube submerged in optically scattering medium. Panels (a) to (d) are TP-PL images at intralipid concentration of 0%, 0.25%, 0.4%, and 1%, respectively. Panels (e) to (h) are the TP-PA images acquired at corresponding intralipid concentrations for panels (a)–(d). The images are interpolated five times and are plotted in a linear scale as indicated by the color bars. Scale bar: 100 μm. 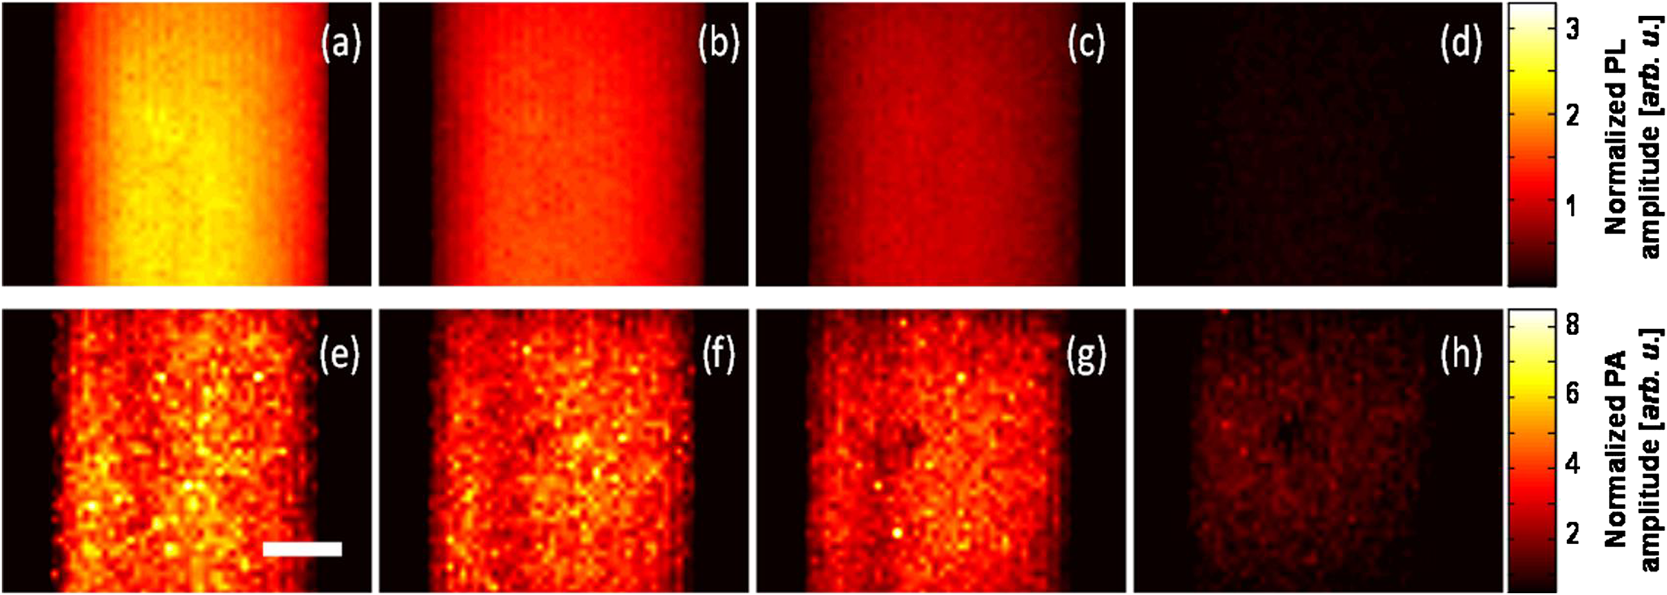 Three-dimensional (3-D) TP-PA imaging was obtained by stacking 2-D images in a series of axial positions acquired at an step size (Fig. 6). The tube diameter measured from the TP-PA image was 323 μm, matching the specifications from the manufacturer. The 3-D TP-PA reconstruction, as expected, resolved the inner diameter of the quartz capillary tube at a precision beyond the ultrasonic bandwidth limited axial resolution in linear PAM with a 15-MHz transducer, displaying another benefit of TP-PAM. Fig. 6Three-dimensional TP-PA imaging. (a) Volumetric visualization of the Rhodamine B filled a quartz capillary tube, which consists 30 stacked plane images. The blue outline represents the boundary of the quartz capillary tube, (b) section of the capillary tube extracted from the volumetric data set shown in panel (a). Scale bar: 100 μm. 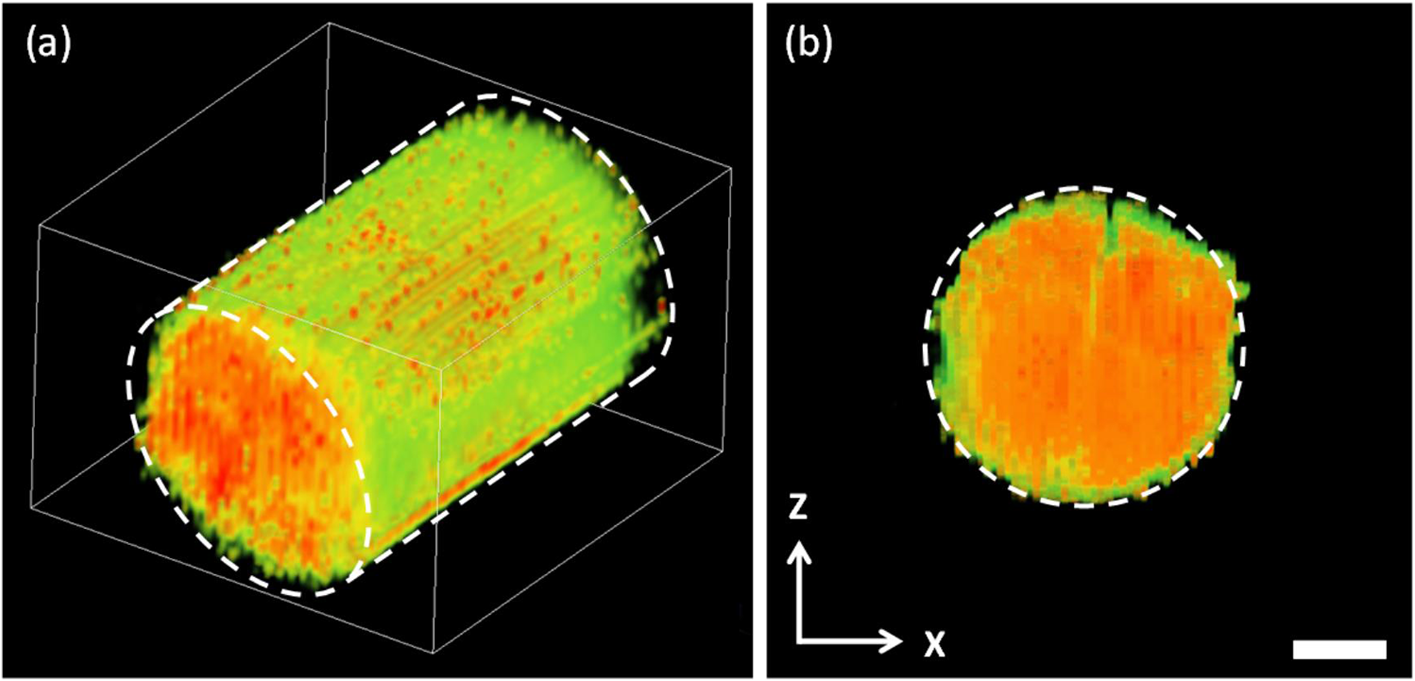 Imaging results also show the advantage of TP-PAM in specific scattering environments due to lower ultrasonic wave attenuation. Intralipid scattering has an approximately two times greater attenuation at the emitted wavelength () than the excitation laser (795 nm),21 significantly leading to more attenuation of the emitted light. Detector and optical setup efficiency affects direct comparison of TP-PL and TP-PA imaging; however, TP absorption efficiency and quantum yield of the contrast agent are more dominant factors that must be considered. Although high detector efficiency favors TP-PL, contrast agents with high TP absorption cross section and low quantum yield make TP-PAM feasible. Promising contrast agents for TP-PAM include several types of quantum dots and Au nanoparticles.22,23 Because tightly focused ultrafast laser pulses often lead to higher ultrasonic frequencies24,25 and ultrasonic attenuation increased with frequency, the signal-to-noise ratio of TP-PA imaging may decrease with imaging depth. 5.ConclusionIn summary, we experimentally measured the nonlinear nonradiative decay process of Rhodamine B using the generated ultrasonic waves that propagated through the medium. The results were compared with theory and showed lower attenuation in two-photon PA than PL in highly scattering media. TP-PA microscopy was demonstrated for 2-D and 3-D imaging. Characterization and imaging with PA generated ultrasonic wave is a relatively new field and information on the nonlinear PA effect is highly limited and of general interest. The emphasized advantage of the nonlinear NIR PA effect, shown in this letter, is its lower attenuation and theoretically identical resolution compared to its nonlinear PL counterpart. We expect this study to be useful in determining internal optical properties of materials where, due to high attenuation of both the pulsed laser and emitted radiation, signal attenuation is too high for direct optical observation. Nonlinear PA has the potential to further increase the imaging and characterization depth in highly scattering mediums while keeping the high resolution associated with nonlinear optical imaging. AcknowledgmentsWe are grateful for the generous support from the NSF (Grant Nos. CBET-1055379, CBET-1066776, ECS-1066562, DBI-10665621, and CBET-10665623), and NIH (Grant Nos. 1R01EY019951 and 1R24EY022883). We would like to thank Siyu Chen for his contribution on the TP-PA system setup. ReferencesB. Coxet al.,
“Quantitative spectroscopic photoacoustic imaging: a review,”
J. Biomed. Opt., 17
(6), 061202
(2012). http://dx.doi.org/10.1117/1.JBO.17.6.061202 JBOPFO 1083-3668 Google Scholar
L. H. V. WangS. Hu,
“Photoacoustic tomography: in vivo imaging from organelles to organs,”
Science, 335
(6075), 1458
–1462
(2012). http://dx.doi.org/10.1126/science.1216210 SCIEAS 0036-8075 Google Scholar
Y. BaeJ. SongY. Kim,
“Photoacoustic study of two‐photon absorption in hexagonal ZnS,”
J. Appl. Phys., 53
(1), 615
–619
(1982). http://dx.doi.org/10.1063/1.329967 JAPIAU 0021-8979 Google Scholar
S. N. Thakuret al.,
“Two-photon photoacoustic spectroscopy of acetone 3p Rydberg states,”
Chem. Phys. Lett., 199
(3), 335
–340
(1992). http://dx.doi.org/10.1016/0009-2614(92)80128-X CHPLBC 0009-2614 Google Scholar
N. ChandrasekharanB. GonzalesB. M. Cullum,
“Non-resonant multiphoton photoacoustic spectroscopy for noninvasive subsurface chemical diagnostics,”
Appl. Spectrosc., 58
(11), 1325
–1333
(2004). http://dx.doi.org/10.1366/0003702042475565 APSPA4 0003-7028 Google Scholar
A. K. Dunnet al.,
“Influence of optical properties on two-photon fluorescence imaging in turbid samples,”
Appl. Opt., 39
(7), 1194
–1201
(2000). http://dx.doi.org/10.1364/AO.39.001194 APOPAI 0003-6935 Google Scholar
D. KobatN. G. HortonC. Xu,
“In vivo two-photon microscopy to 1.6-mm depth in mouse cortex,”
J. Biomed. Opt., 16
(10), 106014
(2011). http://dx.doi.org/10.1117/1.3646209 JBOPFO 1083-3668 Google Scholar
V. V. Yakovlevet al.,
“Stimulated Raman photoacoustic imaging,”
Proc. Natl. Acad. Sci. U. S. A., 107
(47), 20335
–20339
(2010). http://dx.doi.org/10.1073/pnas.1012432107 PNASA6 0027-8424 Google Scholar
S. HuL. H. V. Wang,
“Optical-resolution photoacoustic microscopy: auscultation of biological systems at the cellular level,”
Biophys. J., 105
(4), 841
–847
(2013). http://dx.doi.org/10.1016/j.bpj.2013.07.017 BIOJAU 0006-3495 Google Scholar
Y. YamaokaM. NambuT. Takamatsu,
“Fine depth resolution of two-photon absorption-induced photoacoustic microscopy using low-frequency bandpass filtering,”
Opt. Express, 19
(14), 13365
–13377
(2011). http://dx.doi.org/10.1364/OE.19.013365 OPEXFF 1094-4087 Google Scholar
G. Langeret al.,
“Two-photon absorption-induced photoacoustic imaging of Rhodamine B dyed polyethylene spheres using a femtosecond laser,”
Opt. Express, 21
(19), 22410
–22422
(2013). http://dx.doi.org/10.1364/OE.21.022410 OPEXFF 1094-4087 Google Scholar
A. DiasproG. ChiricoM. Collini,
“Two-photon fluorescence excitation and related techniques in biological microscopy,”
Q. Rev. Biophys., 38
(2), 97
–166
(2005). http://dx.doi.org/10.1017/S0033583505004129 QURBAW 0033-5835 Google Scholar
C. XuW. W. Webb,
“Measurement of two-photon excitation cross sections of molecular fluorophores with data from 690 to 1050 nm,”
J. Opt. Soc. Am. B, 13
(3), 481
–491
(1996). http://dx.doi.org/10.1364/JOSAB.13.000481 JOBPDE 0740-3224 Google Scholar
C. LiL. V. Wang,
“Photoacoustic tomography and sensing in biomedicine,”
Phys. Med. Biol., 54
(19), R59
(2009). http://dx.doi.org/10.1088/0031-9155/54/19/R01 PHMBA7 0031-9155 Google Scholar
T. Liuet al.,
“Photoacoustic generation by multiple picosecond pulse excitation,”
Med. Phys., 37
(4), 1518
–1521
(2010). http://dx.doi.org/10.1118/1.3352666 MPHYA6 0094-2405 Google Scholar
D. MagdeR. WongP. G. Seybold,
“Fluorescence quantum yields and their relation to lifetimes of Rhodamine 6G and fluorescein in nine solvents: improved absolute standards for quantum yields,”
Photochem. Photobiol., 75
(4), 327
–334
(2002). http://dx.doi.org/10.1562/0031-8655(2002)075<0327:FQYATR>2.0.CO;2 PHCBAP 0031-8655 Google Scholar
A. Volkmeret al.,
“One-and two-photon excited fluorescence lifetimes and anisotropy decays of green fluorescent proteins,”
Biophys. J., 78
(3), 1589
–1598
(2000). http://dx.doi.org/10.1016/S0006-3495(00)76711-7 BIOJAU 0006-3495 Google Scholar
S. W. Hellet al.,
“Two-photon near-and far-field fluorescence microscopy with continuous-wave excitation,”
Opt. Lett., 23
(15), 1238
–1240
(1998). http://dx.doi.org/10.1364/OL.23.001238 OPLEDP 0146-9592 Google Scholar
A. VolkmerD. A. HatrickD. J. Birch,
“Time-resolved nonlinear fluorescence spectroscopy using femtosecond multiphoton excitation and single-photon timing detection,”
Meas. Sci. Technol., 8
(11), 1339
(1997). http://dx.doi.org/10.1088/0957-0233/8/11/021 MSTCEP 0957-0233 Google Scholar
F. A. Duck, Physical Properties of Tissue: A Comprehensive Reference Book, Academic Press, San Diego, California
(1990). Google Scholar
S. T. Flocket al.,
“Optical properties of Intralipid: a phantom medium for light propagation studies,”
Lasers Surg. Med., 12
(5), 510
–519
(1992). http://dx.doi.org/10.1002/(ISSN)1096-9101 LSMEDI 0196-8092 Google Scholar
N. J. Durret al.,
“Two-photon luminescence imaging of cancer cells using molecularly targeted gold nanorods,”
Nano Lett., 7
(4), 941
–945
(2007). http://dx.doi.org/10.1021/nl062962v NALEFD 1530-6984 Google Scholar
D. R. Larsonet al.,
“Water-soluble quantum dots for multiphoton fluorescence imaging in vivo,”
Science, 300
(5624), 1434
–1436
(2003). http://dx.doi.org/10.1126/science.1083780 SCIEAS 0036-8075 Google Scholar
B. SullivanA. Tam,
“Profile of laser‐produced acoustic pulse in a liquid,”
J. Acoust. Soc. Am., 75
(2), 437
–441
(1984). http://dx.doi.org/10.1121/1.390467 JASMAN 0001-4966 Google Scholar
C. HoelenF. De Mul,
“A new theoretical approach to photoacoustic signal generation,”
J. Acoust. Soc. Am., 106
(2), 695
–706
(1999). http://dx.doi.org/10.1121/1.427087 JASMAN 0001-4966 Google Scholar
|


