|
|
1.IntroductionColorectal cancer is the third most commonly diagnosed and third most deadly cancer in the United States, accounting for 8% of cases in both categories.1 The five-year survival rate for cases detected during early stages of development is 90%; however, only 40% of new cases are detected during this stage. Detection during the moderate to advanced stages of development is more common and these stages have five-year survival rates that drop to 70% and 13%, respectively. Current screening methods for colorectal cancer include fecal occult blood testing, stool DNA test, flexible sigmoidoscopy, colonoscopy, double-contrast barium enema, and computed tomographic colonography.2 These methods have many benefits and deficits when compared to one another; however, they all have decreased sensitivity and specificity for polyps in diameter.3–6 Also, nonpolypoid lesions are consistently harder to detect that polypoid lesions.7,8 For these reasons, studies of preventative, diagnostic, and treatment methods for colorectal cancer are still needed for improvement in the morbidity and mortality associated with this disease. Mouse models are critical tools in the study of colorectal cancer. Currently, many studies use xenograft models of cancer, allowing for the selection of cell types (and thus molecular expression) present, and for the placement of the tumor in an area accessible to imaging.9–14 Xenograft models, however, have many deficiencies, including limited relevance to spontaneous carcinogenesis, or to the naturally occurring tumor microenvironment.15,16 The carcinogen azoxymethane (AOM) has been known to cause the sporadic growth of colorectal tumors in the distal colon of mice, exhibiting many of the morphological and pathological features associated with sporadic colorectal cancer in humans.17 This model can be used to study the tumors of the colon in vivo, providing a more physiologically relevant method for studying colorectal cancer and its detection. For example, our group has developed and described in detail a minimally invasive endoscopic dual-modality imaging system combining optical coherence tomography (OCT) and laser-induced fluorescence (OCT/LIF) imaging,18 providing information on the morphological and biochemical changes taking place in the colon of AOM-treated mice.19 Many current studies on colorectal cancer utilize the imaging techniques that are not specific to molecular changes; however, it is likely that systems combining complementary imaging modalities, including molecular imaging, will be prevalent in the future.20 The ability to visualize molecular information in the tumors, simultaneously with morphological information, has the potential to elucidate the prognosis of a patient, to provide a route for personalized treatment, and to provide a method of earlier detection of a lesion. The development of fluorescence contrast agents to provide a method of targeted detection of biochemicals could allow for earlier detection of disease than morphological changes alone. Quantum dots are nanoscopic particles of semiconductors whose fluorescence emission wavelength is tunable by the size of the particle. They also have desirable fluorescence qualities such as a wide range of excitation wavelengths, a narrow emission band, high quantum efficiency, high photostablility, and they can be produced to emit throughout a wide range of wavelengths.21–23 Quantum dots have been used in numerous studies as fluorescent markers for cancer in vitro24–29 and in vivo;30–41however, their use in vivo has been limited to nontargeted30–33 or xenograft labeling.34–41 In order to obtain the specificity in labeling cancerous tissue by the quantum dots, a targeting method must be considered. It has been shown that vascular endothelial growth factor receptor 2 (VEGFR2) is upregulated in many cancers, including colorectal, as it is important in tumor angiogenesis.42–47 Currently, VEGFR2 is considered a predictor for clinical outcome and in some instances is used for targeted therapy with antiangiogenic drugs.43,44,48–50 For these reasons, quantum dots bioconjugated to VEGFR2 antibodies have the potential to provide contrast between normal colon and neoplastic lesions as well as a mechanism for evaluating the molecular changes of colorectal tumors in vivo. In this study, we demonstrate the use of a quantum dot with emission centered about 655 nm conjugated to anti-VEGFR2 primary antibodies (QD655-VEGFR2) as a contrast agent for detection of VEGFR2 overexpression in colorectal cancer in mice. In order to determine if the QD655-VEGFR2 properly targets VEGFR2, the QD655-VEGFR2 contrast agent, as well as the same quantum dots conjugated to an isotype control antibody (QD655-IC) and standard immunofluorescence/immunohistochemistry methods were compared. After the confirmation of proper VEGFR2 targeting, the contrast agents were applied in vivo to the colon of AOM or saline-treated mice via lavage and allowed to incubate. The colons were explanted and imaged ex vivo using a fluorescence stereoscope. With this study, we show that in vivo labeling of colons with the QD655-VEGFR2 contrast agent can provide increased contrast between diseased and undiseased regions and thus has the potential for future use with in vivo imaging techniques using the OCT/LIF dual-modality imaging system. 2.Methods2.1.Contrast Agent PreparationConjugation of Qdot655 with Streptavidin® (Invitrogen, Grand Island, New York) to anti-VEGFR2 primary antibodies was performed through streptavidin/biotin linking. Rabbit IgG isotype control antibodies (Santa Cruz Biotech, San Diego, California) and anti-VEGFR2 primary antibodies (Abcam, Cambridge, Massachusetts) were biotinylated using the DSB-X Biotin Protein Labeling Kit (Invitrogen, Grand Island, New York). The antibodies were mixed with the Qdot655 Streptavidin conjugates at a ratio and incubated at room temperature for 1.5 h. The resulting contrast agents are Qdot655/anti-VEGFR2 (QD655-VEGFR2) and Qdot655/isotype control (QD655-IC). 2.2.ImmunocytochemistryOVCAR3 cells were used as a positive VEGFR2 cell line and HT-29 cells were used as a negative control (low expression). A monolayer of the cells was cultured on 22-mm round glass coverslips. Cells were rinsed with 1X PBS and then fixed using 2% paraformaldehyde. The paraformaldehyde was quenched with glycine and rinsed with 1X PBS. The cells were blocked for nonspecific binding using 10% goat serum before the application of antibodies. Cells were either labeled with QD655-VEGFR2 (), QD655-IC (), QDot655 streptavidin alone (), anti-VEGFR2 primary antibodies (), or buffer alone. For comparison, the cells labeled with anti-VEGFR2 primary antibodies alone were labeled with secondary antibodies conjugated to Cy5.5 (). 2.3.Mouse Model and Imaging PreparationThe mouse model used in this study relies on sporadic colorectal carcinogenesis caused by AOM in A/J mice. 13 A/J mice were used in this study, divided into two treatment groups. The experimental group had seven mice treated with AOM (Sigma-Aldrich Chemicals, St. Louis, Missouri) (AOM group) and the control group had six mice treated with saline (Control group). In accordance to a protocol approved by the University of Arizona Institutional Animal Care and Use Committee, AOM dissolved in saline (,) or saline () was administered subcutaneously once a week for 5 weeks, beginning when the mice were 7 weeks of age. The colorectal cancer was allowed to develop over the course of 20 weeks. Mice were placed on a liquid diet (Pedialyte, Abbott Laboratories, Abbott Park, Illinois) for 20 h before imaging and were anesthetized using Ketamine (, ) and Xylazine (, ) prior to contrast agent application. Once the mice were fully anesthetized, the colon was gently flushed using warm saline until clear of feces and blood. 2.4.In Vivo Contrast Agent Labeling and Ex Vivo Fluorescence ImagingThe colon was prepared for contrast agent application by removing the mucus layer covering the mucosa using the mucolytic agent N-acetylcystine (1%). This agent is applied via lavage by filling the colon with the agent and allowing it to incubate for 2 min before flushing the colon with warm saline. After the N-acetylcystine was fully flushed, the contrast agent was also applied via lavage and allowed to incubate for 1 h. The mice were labeled with either QD655-VEGFR2 () (three AOM mice and three control mice), QD655-IC () (three AOM mice and three control mice), or saline (one AOM mouse). After the incubation time, the colon was thoroughly rinsed with warm saline. The mice were euthanized using carbon dioxide. The distal 30 mm of the colons was explanted, sliced longitudinally, and opened for en face imaging of the lumen. The colons were first photographed using a standard digital camera. Then, fluorescence imaging was performed using an MVX10 microscope with a xenon light source (Olympus, Tokyo, Japan) and an ImageX Nano camera (Photonic Research Systems, Manchester, United Kingdom). The Qdot655 emission was collected using a 440/90 nm bandpass filter (Semrock, Rochester, New York) for excitation, a 495-nm Brightline® dichroic beamsplitter (Semrock, Rochester, New York), and 610-nm longpass filter (Chroma, Bellows Falls, Vermont) for emission. Images were taken using a 0.63 magnification and an integration time of 0.6 s. Four images were taken along the length of the colon, ensuring some overlap of the images. 2.5.Image AnalysisIn order to determine if the QD655-VEGFR2 contrast agent was able to positively label diseased regions of the colon, the intensity of the fluorescence signal coming from the diseased and undiseased regions of the colon was measured. This was performed by manually drawing regions of interest (ROI) around suspected areas of disease.51 These areas were determined by examining the gross digital camera images of each colon using the metric of visual change in morphology, tissue thickness, color and protrusion from the undiseased tissue, and were confirmed by examining histology. Similarly, two undiseased regions per image (eight per colon) were identified. The average signal intensity for each ROI was recorded. This was performed on all four fluorescence images for each colon. If a diseased region was visible on more than one image, the signal measure for that particular area of disease was taken as the average of the measured signals. Then, the average of all of the diseased areas and an average of all of the undiseased regions within a contrast agent/treatment group (i.e., all QD655-VEGFR2 labeled colons from AOM treated mice) were taken as the representative signal intensity for diseased and undiseased tissues for that group. A cutoff value to indicate positive VEGFR2 labeling was determined using the diseased regions of the QD655-IC and saline labeled AOM mice because the signal from these regions should be purely inherent to the tissue and not caused by the targeted QD655 emission. Anything above the cutoff value (the average plus one standard deviation of the signal intensity from these regions) was considered to be positively labeled for VEGFR2 and anything below the cutoff value was considered to be negatively labeled for VEGFR2. 2.6.ImmunohistochemistryImmunohistochemistry (IHC) was performed using the same anti-VEGFR2 primary antibody with a goat antirabbit secondary biotinylated for DAB conjugation through streptavidin. The colons were fixed in 2% formalin and the embedded in paraffin wax after fluorescence imaging was performed. Colon cross sections were cut at thicknesses. The sections were deparaffinized and rehydrated before labeling. Antigen retrieval was performed using a 10 mM sodium citrate buffer at 95°C. After antigen retrieval, the tissues were washed and incubated in goat serum for blocking against nonspecific binding. The tissues were washed and then the primary anti-VEGFR2 () was applied to the tissue for 1 h at 37°C. Endogenous peroxidase was blocked for using 3% in water before the secondary antibody was applied. The secondary goat antirabbit IgG biotinylated antibody () (Vector Labs, Burlingame, California) was applied to the tissue for 1 h at room temperature. Sections were then incubated with streptavidin-HRP (Dako, Carpentaria, California) and then visualized (brown chromophore) using 3,3-diaminobenzidine (DAB) (Dako, Carpentaria, California). A counter stain was performed using 1% methyl green. All washes were performed using 1X PBS. 3.Results and Discussions3.1.Bioconjugation and Cell LabelingResults of the cell labeling with the QD655-VEGFR2 and QD655-IC contrast agents are shown in Fig. 1. OVCAR3 cells were positively labeled with the QD655-VEGFR2 contrast agent with identical signal locations and similar intensity values as the standard immunofluorescence labeling with anti-VEGFR2 and secondary antibody with Cy5.5. Cells labeled with QD655-IC and buffer alone showed no signal. Cells were labeled with double the concentration of QDot655 streptavidin to indicate the tendency of the quantum dots to stickto the cells when labeling with QD655-IC. Some signal is visible at this concentration; however, it is very low compared to the QD655-VEGFR2 signal and will not have an impact on the ability to determine the specific from nonspecific labeling. HT-29 cells were also labeled as a negative control. These cells do have some low expression of VEGFR2 and show some signal when labeled with QD655-VEGFR2. Similar to OVCAR3 cells, HT-29 cells labeled with QD655-IC or buffer showed no signal. Overall, the results of this study indicate that the QD655-VEGFR2 contrast agent was successfully conjugated and has the ability to label VEGFR2 with specificity. Also, QD655-VEGFR2 signal is comparable to the standard immunofluorescence labeling technique using a primary and secondary antibody with Cy5.5. Fig. 1(a)–(d) OVCAR3 cells labeled with either QD655-VEGFR2, Cy5.5-VEGFR2, QD655, or QD655-IC. OVCAR3 cells are positive for VEGFR2. (e)–(f) HT-29 cells labeled with either QD655-VEGFR2 or QD655-IC. HT-29 cells have low expression of VEGFR2 and were used as a negative control. All images were taken under identical image settings and have been adjusted to the same intensity range to allow for direct visual comparison between the images. The small inserts on images (d) and (f) have adjusted intensity range to show that cells are present but have low signal. 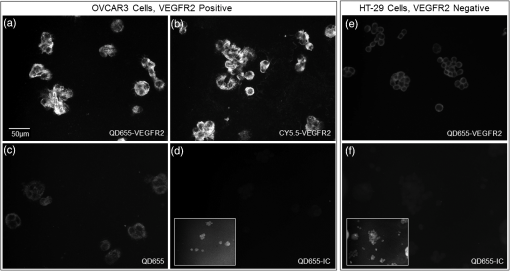 3.2.In-Vivo Labeling/Ex-Vivo ImagingThe goal of this study was to evaluate the ability of the contrast agent QD655-VEGFR2 to properly target VEGFR2 in vivo, which should be expressed in higher quantities in colorectal tumors than in undiseased regions of colon tissue. In order for this approach to be effective during colonoscopy, visual inspection of fluorescence images should provide high contrast for lesions. Diseased regions of the colon are identifiable from visual inspection of the gross images of colons from AOM-treated mice labeled with QD655-VEGFR2 (Fig. 2). However, these regions are visible with higher contrast in the fluorescence images of the same colons, with the diseased regions exhibiting strong fluorescence and the undiseased tissue having limited to no detectable fluorescence. In comparison, the diseased regions of colons from AOM-treated mice labeled with QD655-IC showed very little fluorescence signal, barely detectable as greater than the undiseased tissue fluorescence signal. Because of the minimal fluorescence signal seen in diseased regions of QD655-IC labeled colons, one AOM-treated mouse was labeled with saline in order to determine if the signal was from autofluorescence or from the quantum dots. The saline labeled colon showed a very similar level of fluorescence originating from the diseased regions, indicating that the signal is autofluorescence. There may be greater autofluorescence in the diseased regions of the colon, or the signal strength may be greater simply because the disease tissue is thicker compared to undiseased colon. Visual inspection also indicates that the expression of VEGFR2 within each diseased area is variable, as is the expression among all of the tumors in a single mouse. This has been shown in previous studies on VEGFR2 expression in colon cancer42–46,52 and in our own histological evaluation of the colons as demonstrated in Fig. 3. This visual analysis shows that qualitatively, the contrast agent QD655-VEGFR2 was able to properly target VEGFR2 in colorectal cancer lesions and provide increased contrast between diseased and undiseased tissues. Fig. 2Colons from AOM-treated mice were labeled in vivo with either QD655-VEGFR2 (2 colons on left) or QD655-IC (2 colons on right) via lavage. They were then explanted and splayed open such that images could be taken of the lumen. (a), (c), (e), and (g) gross images taken using a standard digital camera, (b), (d), (f) and (h) images taken using a fluorescence stereoscope (MVX10, Olympus). Tumors labeled with QD655-VEGFR2 show a visible increase in fluorescence compared to those labeled with QD655-IC, and to the undiseased tissue around them. Displayed intensity ranges are identical. 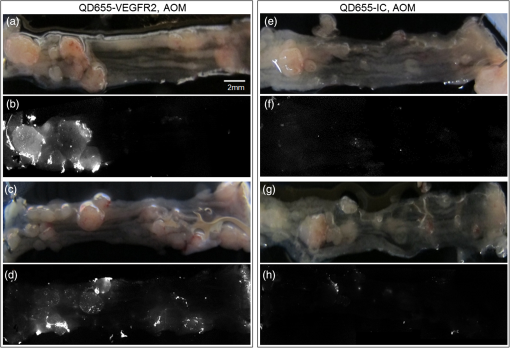 Fig. 3Histological analysis of the colon tissues provided further support for fluorescence signals detected. (a) Fluorescence image of a QD655-VEGFR2 labeled AOM-treated colon with multiple adenoma and varying quantum dot signal (fluorescence intensity) on adenoma, (b) gross image of the area, (c) VEGFR2 immunohistochemistry (IHC) for the area surrounded by the circle in image (a) and (b), (d) VEGFR2 IHC for the area surrounded by the square in image (a) and (b). Fluorescence images of AOM-treated colons labeled with QD655-VEGFR2 showed variations in fluorescence signal among the diseased regions. IHC confirmed that this difference is mostly due to a true difference in level of VEGFR2 expression among the tumors. 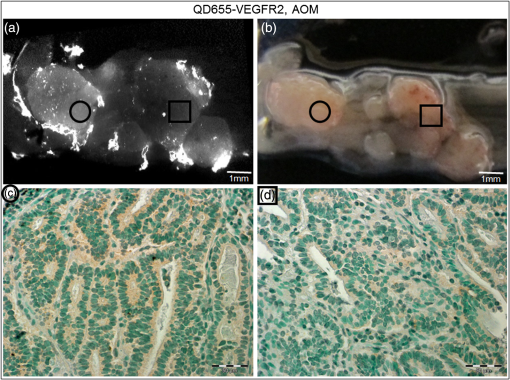 In order to provide quantitative evidence for the proper targeting of QD655-VEGFR2 to colorectal cancer lesions expressing VEGFR2, evaluation of the average intensity of the diseased and undiseased regions of the colons was performed (Fig. 4). Evaluation of the diseased regions of colons from AOM-treated mice labeled with QD655-VEGFR2 indicates that the contrast agent provides on average a factor of 4.2 increase over diseased regions labeled with QD655-IC or saline and a factor of 5.8 increase over undiseased regions. The average intensity of the diseased regions labeled with QD655-IC or saline was not significantly different between these two control groups, but they were significantly different from their respective undiseased regions. This result indicates that the diseased regions have some autofluorescence signal; however, it is considerably smaller than the diseased regions expressing VEGFR2 targeted fluorescence signal. Visually, this difference can be easily seen. The large standard deviation in QD655-VEGFR2 labeled colons can be attributed to previously discussed variability in expression of VEGFR2 within and between tumors and mice. Fig. 4Fluorescence intensity measurements were taken of each diseased region and eight undiseased regions for each colon. All diseased regions or undiseased regions for all colons of mice labeled with a particular contrast agent and in a particular treatment group were averaged together for a representative signal intensity. This graph shows these intensities for diseased and undiseased tissue regions for all contrast agent/treatment group combinations. ****, **. 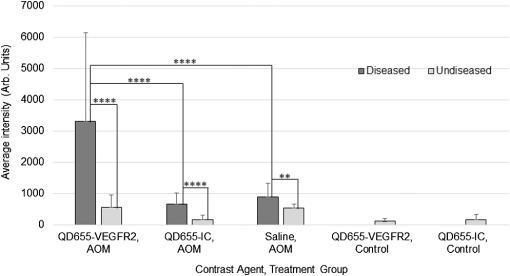 After it was determined that the QD655-VEGFR2 contrast agent successfully targeted VEGFR2 using the fluorescence images, a metric was determined for stating whether or not a diseased region was positive or negative for VEGFR2 based on the fluorescence signal intensity. A cutoff value was chosen by taking the average of the intensities of the diseased regions from the QD655-IC and saline labeled AOM mice plus the average of their standard deviations. Anything above this cutoff was considered positive and anything below was considered negative. Immunohistochemical evaluation provided the gold standard for evaluating the performance of the contrast agent at identifying VEGFR2 expression status. Immunostained sections were used to determine the positive or negative staining of each diseased region as well as the undiseased regions evaluated for fluorescence signal. Undiseased colon tissue will express VEGFR2 in low levels and in specific locations. Positive VEGFR2 signal in histology was determined by the intensity of the signal above the normal signal strength and location, which should be a light brown stain located at the bottom of the crypts, or folds, of the colon. The positive and negative expressions as determined by the fluorescence and the immunohistochemical signals were then used to indicate true and false signals for sensitivity and specificity calculations (Fig. 5). From this metric, it was determined that the QD655-VEGFR2 was 85.7% sensitive and 91.3% specific to VEGFR2 expression in colorectal cancer, while the negative control contrast agent, QD655-IC, was 5.6% sensitive and 100% specific, indicating that there exists some nonspecific signal from diseased regions, but none exists in the undiseased regions. Fig. 5VEGFR2 expression in diseased and undiseased regions for all mice labeled with (a) QD655-VEGFR2 or (b) QD655-IC evaluated by fluorescence intensity threshold and gold standard histology. 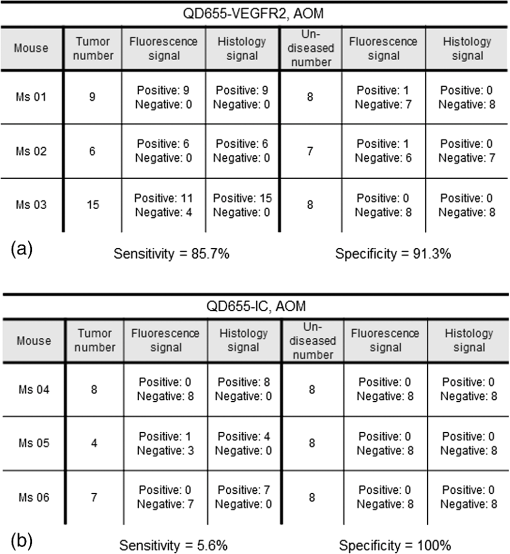 It is notable that for the QD55-VEGFR2, all false-negative values came from one mouse. This mouse had fluorescence signal values that were lower than other mice in the group, and the mouse colon contained a very large number of tumors. The contrast agent had been prepared and stored at room temperature during labeling, and as only one mouse could be labeled at a time, the agent had been exposed to room temperature for approximately 3 h before use in this mouse. This time delay could have led to some changes in labeling efficiency such as aggregation, and could be avoided in the future by keeping the contrast agent on ice during labeling. Difficulty in accessing the tumors due to a very high tumor burden could have also led to decreased fluorescence signal in this mouse, as large tumors can press against the opposite side of the colon, essentially blocking themselves from the contrast agent. The AOM mouse model can cause changes in molecular expression and structure throughout the colon, even in areas without obvious disease. Undiseased tissue in an AOM-treated mouse model experiences changes, such as a thickened mucosa and an increased presence of lymphoid aggregates, which can cause changes in the autofluorescence of the tissue compared to the saline-treated mice. High autofluorescence is likely the cause of the one false positive in fluorescence signal of QD655-VEGFR2 undiseased tissue and one false positive in QD655-IC mice, as immunohistochemical evaluation confirmed that the expression of VEGFR2 was negative, and the signals were generally just above the chosen cutoff. These results indicate the proper labeling of VEGFR2 in physiologically relevant cancerous lesions of the colon by the contrast agent QD655-VEGFR2. In-vivo labeling of spontaneous colorectal cancer tumors using fluorescent contrast agents has been a challenge and has led to studies of cancer in vivo using xenograft tumors, which have limited relevancy to the forms of cancer seen in humans. This study shows that tumors of the colon expressing VEGFR2 can be labeled with QD655-VEGFR2, a novel fluorescent contrast agent, in vivo via lavage and that QD655-VEGFR2 can be readily detected, providing a factor of 5.8 increase in signal between diseased and undiseased regions of a colon using a physiologically relevant model of colorectal cancer. Our laboratory has designed and studied the use of an OCT/LIF dual-modality imaging system for detecting the colorectal cancer in vivo. The OCT component of this system provides a high resolution imaging technique for detecting morphological changes of the mucosa associated with tumor development, and the LIF component provides the ability to detect the changes in molecular expression of the cells of the mucosa which may be visible prior to morphological changes and can provide information on treatment plan development. As we have shown that the QD655-VEGFR2 contrast agent can be applied via lavage to the colon of mice and appropriately target VEGFR2 in diseased regions of the colon, this contrast agent can be used in studies of tumor development utilizing the in vivo labeling technique and the OCT/LIF in vivo imaging system. Preliminary investigations have shown that the OCT/LIF system can be used (ex vivo) to visualize the adenoma in an AOM-treated mouse colon and to simultaneously provide a fluorescence intensity map of the QD655-VEGFR2 labeled adenoma (Fig. 6). Fluorescence signal was very strong at and near the tumor location, suggesting high levels of VEGFR2 expression in the tumor and some surrounding tissue. Targeted labeling of adenoma with QD655-VEGFR2 in vivo, in combination with the in vivo OCT/LIF dual-modality imaging system, has great potential for studying the development and molecular expression of colorectal cancer in vivo. Fig. 6(a) Colon from an AOM mouse labeled with QD655-VEGFR2 in vivo and imaged ex vivo using the OCT/LIF dual-modality imaging system. The OCT image is on top, followed by the fluorescence intensity map (600 to 700 nm) on bottom. The box indicates an adenoma. Fluorescent signal in the LIF map corresponds to the location of the adenoma in the OCT image, with undiseased tissue showing markedly less signal, (b) gross image of the colon with the adenoma. The dotted line indicates the slice location of the OCT/LIF image and the box indicates the same adenoma from (a). 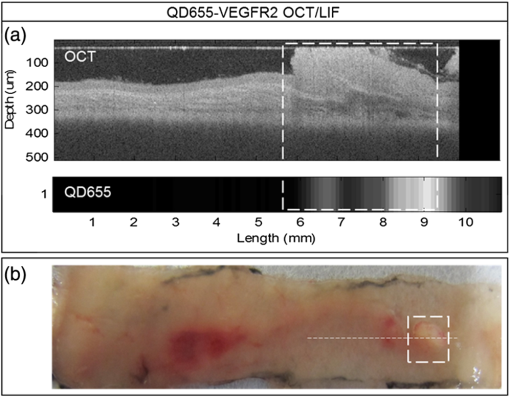 AcknowledgmentsResearch reported in this publication was supported by the National Cancer Institute and the National Institute of Heart, Lung and Blood of the National Institutes of Health under Award Nos. R01CA109835 and T32HL007955. The content is solely the responsibility of the authors and does not necessarily represent the official views of the National Institutes of Health. We would also like to acknowledge the NSF GTEAMS STEM in K-12 Graduate Fellowship #081234 and Faith Rice, Brenda Baggett, Dr. Gabriel Orsinger, Dr. Sarah Leung, and Dr. Marek Romanowski for their expertise and use of equipment. ReferencesCancer Facts & Figures 2014, American Cancer Society, Atlanta
(2014). Google Scholar
B. Levin et al.,
“Screening and surveillance for the early detection of colorectal cancer and adenomatous polyps, 2008: a joint guideline from the American Cancer Society, the US multi-society task force on colorectal cancer, and the American College of Radiology,”
Ca-Cancer J. Clin., 58
(3), 130
–160
(2008). http://dx.doi.org/10.3322/CA.2007.0018 0007-9235 Google Scholar
J. E. Allison et al.,
“A comparison of fecal occult-blood tests for colorectal-cancer screening,”
New Engl. J. Med., 334 155
–159
(1996). http://dx.doi.org/10.1056/NEJM199601183340304 NEJMAG 0028-4793 Google Scholar
T. F. Imperiale et al.,
“Fecal DNA versus fecal occult blood for colorectal-cancer screening in an average-risk population,”
New Engl. J. Med., 351 2704
–2714
(2004). http://dx.doi.org/10.1056/NEJMoa033403 NEJMAG 0028-4793 Google Scholar
A. Graser et al.,
“Comparison of CT colonography, colonoscopy, sigmoidoscopy and faecal occult blood tests for the detection of advanced adenoma in an average risk population,”
Gut, 58
(2), 241
–248
(2009). http://dx.doi.org/10.1136/gut.2008.156448 GUTTAK 0017-5749 Google Scholar
D. K. Rex et al.,
“Relative sensitivity of colonoscopy and barium enema for detection of colorectal cancer in clinical practice,”
Gastroenterology, 112
(1), 17
–23
(1997). http://dx.doi.org/10.1016/S0016-5085(97)70213-0 GASTAB 0016-5085 Google Scholar
R. M. Soetikno et al.,
“Prevalence of nonpolypoid (flat and depressed) colorectal neoplasms in asymptomatic and symptomatic adults,”
J. Am. Med. Assoc., 299
(9), 1027
–1035
(2008). http://dx.doi.org/10.1001/jama.299.9.1027 JAMAAP 0098-7484 Google Scholar
K. C. Vemulapalli and D. K. Rex,
“Failure to recognize serrated polyposis syndrome in a cohort with large sessile colorectal polyps,”
Gastrointest. Endosc., 75
(6), 1206
–1210
(2012). http://dx.doi.org/10.1016/j.gie.2012.01.033 GAENBQ 0016-5107 Google Scholar
H. Cho et al.,
“In vivo cancer imaging by poly(ethylene glycol)-b-poly(epsilon-caprolactone) micelles containing a near-infrared probe,”
Nanomed. Nanotechnol., 8
(2), 228
–236
(2012). http://dx.doi.org/10.1016/j.nano.2011.06.009 1549-9634 Google Scholar
P. Diagaradjane et al.,
“Imaging epidermal growth factor receptor expression in vivo: pharmacokinetic and biodistribution characterization of a bioconjugated quantum dot nanoprobe,”
Clin. Cancer Res., 14 731
–741
(2008). http://dx.doi.org/10.1158/1078-0432.CCR-07-1958 CCREF4 1078-0432 Google Scholar
M. Goetz et al.,
“In vivo molecular imaging with cetuximab, an anti-EGFR antibody, for prediction of response in xenograft models of human colorectal cancer,”
Endoscopy, 45 469
–477
(2013). http://dx.doi.org/10.1055/s-00000012 ENDCAM 0013-726X Google Scholar
M. Goetz et al.,
“In vivo molecular imaging of colorectal cancer with confocal endomicroscopy by targeting epidermal growth factor receptor,”
Gastroenterology, 138
(2), 435
–446
(2010). http://dx.doi.org/10.1053/j.gastro.2009.10.032 GASTAB 0016-5085 Google Scholar
B. Paudyal et al.,
“Positron emission tomography imaging and biodistribution of vascular endothelial growth factor with 64Cu-labeled bevacizumab in colorectal cancer xenografts,”
Cancer Sci., 102
(1), 117
–121
(2011). http://dx.doi.org/10.1111/cas.2010.102.issue-1 CSACCM 1347-9032 Google Scholar
A. Pichorner et al.,
“In vivo imaging of colorectal cancer growth and metastasis by targeting MACC1 with shRNA in xenografted mice,”
Clin. Exp. Metastas., 29
(6), 573
–583
(2012). http://dx.doi.org/10.1007/s10585-012-9472-6 CEXMD2 0262-0898 Google Scholar
A. Kamb,
“What’s wrong with our cancer models?,”
Nat. Rev. Drug Discov., 4 161
–165
(2005). http://dx.doi.org/10.1038/nrd1635 NRDDAG 1474-1776 Google Scholar
K. K. Frese and D. A. Tuveson,
“Maximizing mouse cancer models,”
Nat. Rev. Cancer, 7 645
–658
(2007). http://dx.doi.org/10.1038/nrc2192 NRCAC4 1474-175X Google Scholar
C. Neufert, C. Becker and M. F. Neurath,
“An inducible mouse model of colon carcinogenesis for the analysis of sporadic and inflammation-driven tumor progression,”
Nat. Protoc., 2 1998
–2004
(2007). http://dx.doi.org/10.1038/nprot.2007.279 NPARDW 1754-2189 Google Scholar
L. P. Hariri et al.,
“Simultaneous optical coherence tomography and laser induced fluorescence imaging in rat model of ovarian carcinogenesis,”
Cancer Biol. Ther., 10
(5), 438
–447
(2010). http://dx.doi.org/10.4161/cbt CBTAAO 1538-4047 Google Scholar
A. M. Winkler et al.,
“In vivo, dual-modality OCT/LIF imaging using a novel VEGF receptor-targeted NIR fluorescent probe in the AOM-treated mouse model,”
Mol. Imaging Biol., 13
(6), 1173
–1182
(2011). http://dx.doi.org/10.1007/s11307-010-0450-6 1536-1632 Google Scholar
R. S. DaCosta, B. C. Wilson and N. E. Marcon,
“Optical techniques for the endoscopic detection of dysplastic colonic lesions,”
Curr. Opin. Gastroen., 21
(1), 70
–79
(2005). COGAEK 0267-1379 Google Scholar
X. H. Gao et al.,
“In vivo molecular and cellular imaging with quantum dots,”
Curr. Opin. Biotech., 16
(1), 63
–72
(2005). http://dx.doi.org/10.1016/j.copbio.2004.11.003 CUOBE3 0958-1669 Google Scholar
V. Biju et al.,
“Bioconjugated quantum dots for cancer research: present status, prospects and remaining issues,”
Biotechnol. Adv., 29
(2), 259
–260
(2011). http://dx.doi.org/10.1016/j.biotechadv.2010.11.003 BIADDD 0734-9750 Google Scholar
M. Fang et al.,
“Quantum dots for cancer research: current status, remaining issues, and future perspectives,”
Cancer Biol. Med., 9
(3), 151
–163
(2012). http://dx.doi.org/10.7497/j.issn.2095-3941.2012.03.001 CBMADQ 2095-3941 Google Scholar
X. Y. Wu et al.,
“Immunofluorescent labeling of cancer marker Her2 and other cellular targets with semiconductor quantum dots,”
Nat. Biotechnol., 21 41
–46
(2002). http://dx.doi.org/10.1038/nbt764 NABIF9 1087-0156 Google Scholar
D. S. Lidke et al.,
“Quantum dot ligands provide new insights into erbB/HER receptor-mediated signal transduction,”
Nat. Biotechnol., 22 198
–203
(2004). http://dx.doi.org/10.1038/nbt929 NABIF9 1087-0156 Google Scholar
J. K. Jaiswal et al.,
“Long-term multiple color imaging of live cells using quantum dot bioconjugates,”
Nat. Biotechnol., 21 47
–51
(2002). http://dx.doi.org/10.1038/nbt767 NABIF9 1087-0156 Google Scholar
K. C. Weng et al.,
“Targeted tumor cell internalization and imaging of multifunctional quantum dot-conjugated immunoliposomes in vitro and in vivo,”
Nano Lett., 8
(9), 2851
–2857
(2008). http://dx.doi.org/10.1021/nl801488u NALEFD 1530-6984 Google Scholar
M. V. Yezhelyev et al.,
“In situ molecular profiling of breast cancer biomarkers with multicolor quantum dots,”
Adv. Mater., 19
(20), 3146
–3151
(2007). http://dx.doi.org/10.1002/adma.200701983 ADVMEW 0935-9648 Google Scholar
K. T. Yong et al.,
“Imaging pancreatic cancer using bioconjugated InP quantum dots,”
Acs Nano, 3
(3), 502
–510
(2009). http://dx.doi.org/10.1021/nn8008933 1936-0851 Google Scholar
B. Ballou et al.,
“Sentinel lymph node imaging using quantum dots in mouse tumor models,”
Bioconjugate Chem., 18
(2), 389
–396
(2007). http://dx.doi.org/10.1021/bc060261j BCCHES 1043-1802 Google Scholar
S. Kim et al.,
“Near-infrared fluorescent type II quantum dots for sentinel lymph node mapping,”
Nat. Biotechnol., 22 93
–97
(2003). http://dx.doi.org/10.1038/nbt920 NABIF9 1087-0156 Google Scholar
D. R. Larson et al.,
“Water-soluble quantum dots for multiphoton fluorescence imaging in vivo,”
Science, 300
(5624), 1434
–1436
(2003). http://dx.doi.org/10.1126/science.1083780 SCIEAS 0036-8075 Google Scholar
M. Stroh et al.,
“Quantum dots spectrally distinguish multiple species within the tumor milieu in vivo,”
Nat. Med., 11 678
–682
(2005). http://dx.doi.org/10.1038/nm1247 1078-8956 Google Scholar
M. E. Akerman et al.,
“Nanocrystal targeting in vivo,”
Proc. Natl. Acad. Sci. USA, 99
(20), 12617
–12621
(2002). http://dx.doi.org/10.1073/pnas.152463399 1091-6490 Google Scholar
W. B. Cai et al.,
“Peptide-labeled near-infrared quantum dots for imaging tumor vasculature in living subjects,”
Nano Lett., 6
(4), 669
–676
(2006). http://dx.doi.org/10.1021/nl052405t NALEFD 1530-6984 Google Scholar
J. H. Gao et al.,
“Ultrasmall near-infrared noncadmium quantum dots for in vivo tumor imaging,”
Small, 6
(2), 256
–261
(2010). http://dx.doi.org/10.1002/smll.v6:2 1613-6829 Google Scholar
J. H. Gao et al.,
“In vivo tumor-targeted fluorescence imaging using near-infrared noncadmium quantum dots,”
Bioconjugate Chem., 21
(4), 604
–609
(2010). http://dx.doi.org/10.1021/bc900323v BCCHES 1043-1802 Google Scholar
X. H. Gao et al.,
“In vivo cancer targeting and imaging with semiconductor quantum dots,”
Nat. Biotechnol., 22 969
–976
(2004). http://dx.doi.org/10.1038/nbt994 NABIF9 1087-0156 Google Scholar
H. Tada et al.,
“In vivo real-time tracking of single quantum dots conjugated with monoclonal anti-HER2 antibody in tumors of mice,”
Cancer Res., 67 1138
–1144
(2007). http://dx.doi.org/10.1158/0008-5472.CAN-06-1185 CNREA8 0008-5472 Google Scholar
K. Yang et al.,
“In-vivo imaging of oral squamous cell carcinoma by EGFR monoclonal antibody conjugated near-infrared quantum dots in mice,”
Int. J. Nanomed., 6 1739
–1745
(2011). http://dx.doi.org/10.2147/IJN IJNNHQ 1176-9114 Google Scholar
K. Yang et al.,
“In vivo and in situ imaging of head and neck squamous cell carcinoma using near-infrared fluorescent quantum dot probes conjugated with epidermal growth factor receptor monoclonal antibodies in mice,”
Oncol. Rep., 27
(6), 1925
–1931
(2012). http://dx.doi.org/10.3892/or.2012.1705 OCRPEW 1021-335X Google Scholar
K. Fujimoto et al.,
“Expression of two angiogenic factors, vascular endothelial growth factor and platelet-derived endothelial cell growth factor in human pancreatic cancer, and its relationship to angiogenesis,”
Eur. J. Cancer, 34
(9), 1439
–1447
(1998). http://dx.doi.org/10.1016/S0959-8049(98)00069-0 EJCAEL 0959-8049 Google Scholar
J. Y. Kim et al.,
“Prognostic significance of epidermal growth factor receptor and vascular endothelial growth factor receptor in colorectal adenocarcinoma,”
Acta Pathol. Microbiol. Immunol. Scand., 119
(7), 449
–459
(2011). http://dx.doi.org/10.1111/j.1600-0463.2011.02752.x APMSEL 0903-4641 Google Scholar
J. Y. Kim et al.,
“The prognostic significance of growth factors and growth factor receptors in gastric adenocarcinoma,”
Acta Pathol. Microbiol. Immunol. Scand., 121
(2), 95
–104
(2013). http://dx.doi.org/10.1111/apm.2013.121.issue-2 APMSEL 0903-4641 Google Scholar
Y. Takahashi et al.,
“Significance of vessel count and vascular endothelial growth factor and its receptor (KDR) in intestinal-type gastric cancer,”
Clin. Cancer Res., 2 1679
–1684
(1996). CCREF4 1078-0432 Google Scholar
Y. Takahashi et al.,
“Expression of vascular endothelial growth-factor and its receptor, Kdr, correlates with vascularity, metastasis, and proliferation of human colon-cancer,”
Cancer Res., 55 3964
–3968
(1995). CNREA8 0008-5472 Google Scholar
D. J. Hicklin and L. M. Ellis,
“Role of the vascular endothelial growth factor pathway in tumor growth and angiogenesis,”
J. Clin. Oncol., 23
(5), 1011
–1027
(2004). http://dx.doi.org/10.1200/JCO.2005.06.081 JCONDN 0732-183X Google Scholar
L. M. Ellis and D. J. Hicklin,
“VEGF-targeted therapy: mechanisms of anti-tumour activity,”
Nat. Rev. Cancer, 8 579
–591
(2008). http://dx.doi.org/10.1038/nrc2403 NRCAC4 1474-175X Google Scholar
N. Ferrara, K. J. Hillan and W. Novotny,
“Bevacizumab (Avastin), a humanized anti-VEGF monoclonal antibody for cancer therapy,”
Biochem. Bioph. Res. Co., 333
(2), 328
–335
(2005). http://dx.doi.org/10.1016/j.bbrc.2005.05.132 BBRCA9 0006-291X Google Scholar
J. C. Lee et al.,
“Prognostic value of vascular endothelial growth factor expression in colorectal cancer patients,”
Eur. J. Cancer, 36
(6), 748
–753
(2000). http://dx.doi.org/10.1016/S0959-8049(00)00003-4 EJCAEL 0959-8049 Google Scholar
J. Schindelin et al.,
“Fiji: an open-source platform for biological-image analysis,”
Nat. Methods, 9 676
–682
(2012). http://dx.doi.org/10.1038/nmeth.2019 1548-7091 Google Scholar
C. Kim et al.,
“Sentinel lymph nodes and lymphatic vessels: noninvasive dual-modality in vivo mapping by using indocyanine green in rats-volumetric spectroscopic photoacoustic imaging and planar fluorescence imaging,”
Radiology, 255
(2), 442
–450
(2010). http://dx.doi.org/10.1148/radiol.10090281 RADLAX 0033-8419 Google Scholar
|

