|
|
1.IntroductionPhotoacoustic tomography (PAT) is a hybrid biomedical imaging technique that integrates rich optical absorption contrast and deep penetration in a single modality.1–4 In PAT, short laser pulses illuminate the tissue of interest, and photoacoustic (PA) waves are generated by transient thermoelastic expansion following the absorption of the incident laser pulses. One way to receive the PA signals is to scan a single-element ultrasonic transducer over multiplepoint-like locations, one at a time. However, this approach inevitably results in an imaging speed limited by the pulse repetition rate of the laser and the time needed to scan the transducer over different locations. Alternatively, one-dimensional or two-dimensional ultrasonic transducer arrays can be used to receive multiple channels of PA signals in parallel during one illumination-receiving cycle [Fig. 1(a)].5–8 The ultrasound array can provide electronic beam forming, eliminating mechanical scanning and enabling a much faster imaging speed. Generally, the imaging speed depends on the number of transducer elements in the array. However, with multiple transducer elements, the construction and operation of the ultrasound receiving system becomes more challenging and costly. Thus, reducing or even completely eliminating the need for massive ultrasonic transducer arrays and corresponding data acquisition (DAQ) electronics is highly desirable. Fig. 1(a) Photoacoustic (PA) signal reception using multiple transducers and multichannel data acquisition (DAQ) electronics; and (b) PA signal reception using a single-element transducer and single-channel DAQ electronics through parallel acoustic delay lines. 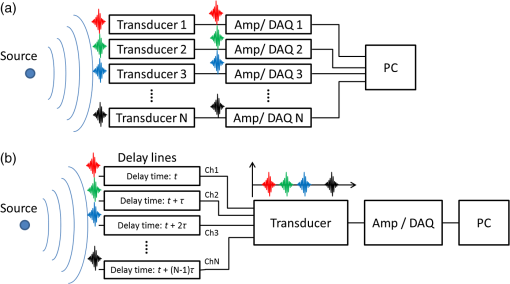 In our previous work, we investigated a new time-delayed ultrasound receiving concept based on parallel acoustic delay lines (PADLs) [Fig. 1(b)].9 Depending on the penetration depth (from a few millimeters to centimeters) and the speed of sound in the target tissue (), the typical propagation time of a PA wave in the tissue medium is on the order of microseconds (). Because the repetition rate of the pulsed laser is low, the time interval between two successively generated PA signals is on the order of milliseconds (ms) or more, which are much longer than the duration of PA signals. By introducing a specific amount of acoustic time delay () to each channel, it is possible to transmit multiple channels of PA signals onto a single-ultrasound transducer in one receiving cycle [Fig. 1(b)]. The acoustic time delays are controlled by varying the propagation length of each delay line. The PA signals in multiple channels can be forced to arrive at a single-element ultrasonic transducer at different times; therefore, they are completely distinguishable in the time domain even after being mixed into a single DAQ channel. This capability opens the possibility for detecting and processing multiple time-delayed PA signals in a serial manner, using single-element transducers and single-channel DAQ electronics. As a result, a large number of DAQ channels can be merged into one, thereby significantly reducing the complexity and cost of ultrasound receiving systems. In our previous work, low-loss fused-silica optical fibers were used to construct the PADLs. The typical speed of sound in fused-silica fibers is around . To provide suitable acoustic time delays (e.g., ) that will avoid possible mixing of multiple PA signals, each two adjacent PADLs had to differ in length by around 5 cm. As a result, the total length of the PADLs dramatically increased with the number of the PADLs. For example, the longest delay line in an 8-PADL array was more than 40 cm. Further, to avoid excessive acoustic attenuation, distortion, cross-talk, and potential mechanical fracture of the fused-silica fibers, the PADLs were laid out across a large area. However, this situation not only limited the total number of PADLs that could be practically constructed but also impeded the use of the PADL technique in real biomedical applications. In this paper, we report the development of a miniaturized PADL probe suitable for handheld PAT operations. The PADL probe consists of 16 PADLs (made of fused-silica optical fibers) arranged into two bundles, which allows the simultaneous collection of 16 channels of the PA signals in one illumination-receiving cycle, using just two single-element transducers and two channels of DAQ electronics. To minimize the size of the PADL probe, all the PADLs are tightly wound into a spiral pattern with a suitable radius of curvature to avoid excessive acoustic attenuation and distortion. To provide robust support for all the delay line structures, plastic spacers with specially designed isolation trenches were fabricated using laser micromachining. The ultrasonic transmission properties of the individual PADLs were characterized and verified using two-port ultrasound measurements. To test its photoacoustic imaging capability, we used the assembled PADL probe to collect photoacoustic signals from a black-ink target embedded in an optical phantom tissue. PAT images of the black-ink target were successfully constructed and matched well with the actual sizes of the target. 2.Probe Design and ConstructionAs shown in Fig. 2, the 16-channel handheld PADL probe consists of one input port, two output ports, and a PADL housing unit located between. At the input port, all of the 16 PADLs receive incoming PA signals. After routing through the PADL housing unit, the 16 PADLs are divided into two arrays, each of which goes to one output port. Compared with bundling all 16 PADLs together, the 2-by-8 design reduces the total length of the PADLs and allows a much more compact probe structure, while requiring only one additional ultrasonic transducer and DAQ system. Fig. 2Schematic of the 16-channel handheld parallel acoustic delay line (PADL) probe; a perspective view of the probe input port, the PADL housing unit, and two output ports. 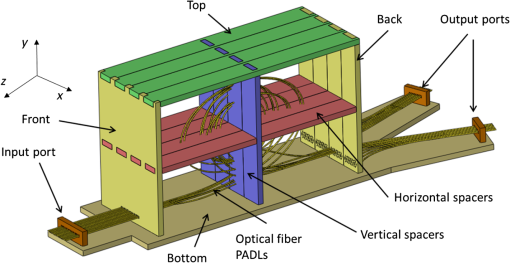 2.1.PADL DesignBuilding on our previous results, the PADLs were designed to provide good mechanical stability and acoustic performance. Due to their broad availability, low cost, and low acoustic attenuation at ultrasonic frequencies (i.e., MHz), fused-silica optical fibers (CeramOptec Inc., East Longmeadow, Massachusetts) with a total diameter of were used in the PADLs. In a cylindrical wire-type ultrasound delay line, the acoustic delays can vary with different frequencies. To transmit desirable ultrasound signals in the wire-type delay lines, the second and higher-orders of longitudinal mode and mode dispersion should be suppressed by satisfying the following condition10,11 where is the diameter of the optical fiber, is the frequency of the ultrasonic waves, and is the acoustic velocity in the optical fiber. At a center frequency of 2.25 MHz, the small diameter of the optical fiber and the high acoustic velocity (5000 to ) of fused silica allow good suppression of both higher order modes and mode dispersion to ensure clean transmission of PA signals. Based on the acoustic properties of the optical fibers, we kept the following design specifications in mind: (1) the time delay of the shortest PADL, (2) the time delay increment needed to prevent overlapping, and (3) the parallel arrangement of fibers and pitch between fibers at the input port.The acoustic time delays were controlled by varying the length of the delay lines which was determined using the following two criteria.9 First, the time delay between each delay line had to be long enough to prevent signal interference from neighboring delay lines. In our PADLs, the length differences between two adjacent delay lines were determined to be 5.00 cm long, which corresponded to an incremental time delay of . Since the time duration of the PA signal from each delay line is less than , a delay is adequate. Second, the PA signal in the longest (eighth) delay line had to reach the receiving transducers before the first reflected signal (first echo, a signal reflected twice by the two ends of the optical fiber) in the shortest delay line, to avoid possible interference between them. Representing the time delay of the first delay line as (in microseconds), the eighth signal will reach the receiving transducer after , and the first echo will be detected at . To avoid interference, an inequality of is required, and, therefore, should be greater than . Based on this calculation, the time delays of the shortest (first) delay line and longest (eighth) delay line were designed for 40 and , respectively. The time delays and delay lengths for the 8-channel PADL array are summarized in Table 1. In common ultrasonic array systems, the transducer elements are arranged with , where is the pitch and is the ultrasound wavelength. Based on the ultrasound frequency (2.25 MHz) of our ultrasonic transducers, the pitches between two adjacent fibers were determined to be . Since the optical fibers have an overall diameter of , a fiber-to-fiber spacing of was chosen for arranging the PADLs at the input port. Table 1Time delays and fiber lengths for the 8-channel parallel acoustic delay line array.
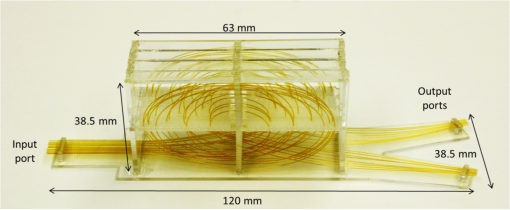
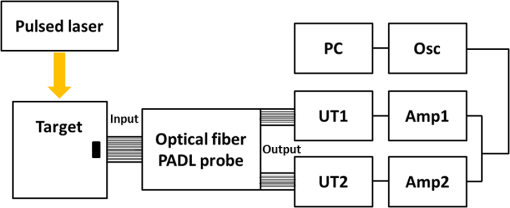
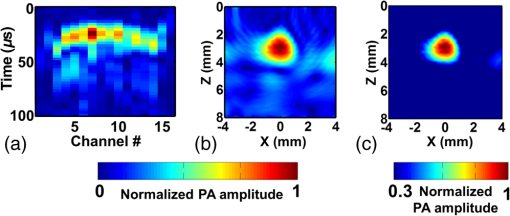
2.2.Fiber Spacer Design and FabricationTo securely position the optical-fiber PADLs, four pairs of spacer structures were designed and fabricated [Fig. 3(a)], each having horizontal and a vertical members assembled into a cross. On each spacer structure, there is a 2-D matrix of elliptical holes ( long and wide) for assembling the optical fibers. Unlike circular holes, the elliptic holes can provide relief clearance in the direction of optical fiber bending, which helps to reduce the chance of breaking the optical fibers during threading. To reduce possible acoustic coupling between two adjacent optical fibers passing through the spacer structure, an “L” shaped isolation trench was cut around each elliptic hole, as seen in Fig. 3(b). The length and width of the isolation trenches were 2.15 mm and , respectively. To accommodate even the longest optical fiber (), the horizontal spacer structure has an array of 4-by-30 elliptic holes and the vertical spacer structure has an array of 4-by-18 elliptic holes. Overall, the spacer structures measure 6.2 mm by 60 mm horizontally () and 6.2 mm by 35.5 mm vertically (). These dimensions allow the longest fiber to be snugly wound with a smallest radius of curvature of around 5 mm without breaking. Fig. 3(a) Horizontal and vertical spacers fabricated using laser micromachining; and (b) zoom-in view of the horizontal spacer showing the elliptical threading holes and “L” shaped isolation trenches. 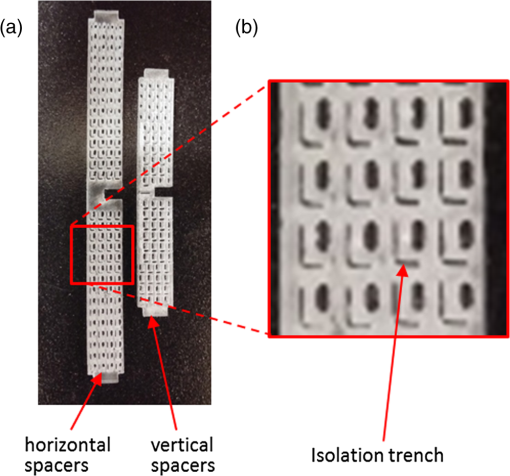 When a sound wave is incident at an oblique angle onto an interface of two materials with different acoustic impedances, one form of vibrational motion (e.g., longitudinal) can be transformed into another one (e.g., transverse). This phenomenon is called (acoustic) mode conversion. The mode conversion could occur at the bent section of an optical-fiber PADL, depending on the both the wavelength of the PA signals and the bending radius. Generally, a larger bending radius creates less mode conversion. In PA imaging, the PA signals are launched and received in the longitudinal mode. Therefore, any conversion to other modes during their transmission in the optical-fiber PADLs should be avoided. Based on our previous studies,9 a smallest bending radius of 5 mm was maintained in winding the optical fiber PADLs to minimize the mode conversion. 2.3.Probe ConstructionThe first step to construct the handheld PADL probe was preparing the optical-fiber PADLs. 16 optical fibers were cut to their requisite lengths, and both ends of each optical fiber were polished. Then, a laser micromachining system (Universal Laser Systems, PLS6.75, Scottdale, Arizona) was used to cut the input/output fiber holders, the top, bottom, front, and back plates of the PADL housing unit, and four pairs of optical fiber spacers from a 1.5-mm-thick acrylic sheet. To assemble the PADL probe, the input and the output holders for fiber arrangement were first fixed on the bottom plate. Second, the front and back panels were fixed on the bottom plate. Third, the horizontal and the vertical spacers were assembled crosswise. The main housing part, including the front/back panels and crossed horizontal/vertical spacers, was fixed on the bottom plate. The last step was carefully threading the optical probe fibers through the input port, front panel, vertical/horizontal spacers, back panel, and output port. Since the coiled optical fibers are flexible springs under compression, the lengths of the input and output port were carefully adjusted to provide the best contact condition. The fully assembled PADL probe is shown in Fig. 4. 3.Ultrasonic Characterization and PAT Imaging3.1.Ultrasonic Testing SetupWe set up a simple experimental system to characterize the ultrasonic transmission properties of the 16-channel PADLs. The pulser/receiver (Olympus NDT, 5072PR, Houston, Texas) was set to transmission mode. Three ultrasonic transducers (Olympus NDT, V106-RB, 2.25 MHz) were used in the testing, with one serving as the transmitter and the other two serving as the receivers. The transmitting transducer was interfaced with the input port of the 16-channel PADLs. The two receiving transducers were interfaced with the two output ports of the PADLs, respectively. To enhance coupling efficiency and minimize unwanted reverberation, mineral oil was applied between the surfaces of the transducers and the ends of the PADLs. The ultrasound signals (generated by the transmitting transducer) traveled from the input port to the two output ports through the 16-channel PADLs with different time delays. Since the pulser/receiver had only one receiving port, the two receiving transducers were connected to the pulser/receiver one at a time to receive all ultrasound signals from the 16 optical fibers, which were averaged 16 times to improve the signal-to-noise ratio, displayed, and recorded on the digital oscilloscope (Tektroniks, TDS2014B, Beaverton, Oregon). 3.2.PAT Imaging SetupThe experimental setup of the PA imaging experiment is shown in Fig. 5. The light source was a frequency-doubled Q-switched Nd:YAG laser (Continuum, SL2-10, San Jose, California) with a pulse duration of 5 ns, a pulse repetition rate of 10 Hz, and a wavelength of 532 nm. After it passed through several prisms, the light beam was focused on a phantom via a cylindrical lens, parallel to the alignment of the delay lines. The laser pulse energy was less than , much lower than the ANSI safety limit ( at 532 nm). The induced PA waves propagated from the phantom and traveled along the PADLs into two DAQ channels. In each DAQ channel, eight time-delayed PA signals were sequentially detected by a single-element unfocused ultrasonic transducer (Olympus NDT, V303). The delivered PA signals were amplified by an ultrasound pulser/receiver (Olympus NDT, 5072PR). An oscilloscope (Tektronix, TDS5054) recorded these signals at a sampling rate of 5 MHz. 3.3.DAQ and Image ReconstructionThe PA signals were averaged 10 times to generate one PA image. Thus, the imaging speed was 1 Hz. The end of each delay line on the sample surface was considered as a single-ultrasound element in an ultrasound array system. Each PA signal sequentially detected by one DAQ channel was reshaped into eight separate PA signals, based on the predefined time positions and measured by the ultrasound transmission experiment. The differences in acoustic attenuation in each fiber were compensated for (). Then, a commonly used delay-and-sum image reconstruction method was applied to reconstruct the PA images.12 Briefly, the PA images were reconstructed by summing the data from all channels after compensating for time delays at each fiber based on its length and matching phase. In a 2-D beam field along the and directions, a time delay for the ’th PADL located on can be calculated as follows: where is the distance from a focusing point to the center of the delay line and is the speed of sound in soft tissues, . Envelope detection was applied by using Hilbert transformation along the axial direction (i.e., the direction) followed by taking the absolute value.4.Results and Discussion4.1.Ultrasonic Transmission through the PADLsFigure 6(a) shows the eight channels of time-delayed ultrasound signals followed by the first channel’s echo signal received by ultrasonic transducer UT1, and Fig. 6(b) shows a zoom-in view of the first three ultrasound signals. Similarly, Fig. 6(c) shows the eight channels of time-delayed ultrasound signals followed by the first channel’s echo signal received by ultrasonic transducer UT2, and Fig. 6(d) shows a zoom-in view of the first three ultrasound signals. The ultrasound signals naturally attenuated along the length of the PADLs. Theoretically, acoustic attenuation should be exponential to the delay length according to Beer’s law. However, the observed nonlinear attenuation of the PADLs could be caused by nonuniform contacts between the PADLs and the transducers. The average attenuation was calculated to be at 2.25 MHz by measuring the signal amplitude difference between the shortest fiber and the longest one. This value is similar to that observed before ( at 1 MHz).9 Figures 6(b) and 6(d) show incremental time delays of . Fig. 6Plots of acoustic waveforms propagating through the optical-fiber PADLs with various lengths ranging from 21 to 56 cm: (a) Raw A-line signals obtained by ultrasonic transducer UT1; (b) zoom-in view of the first three signals in (a); (c) raw A-line image obtained by ultrasonic transducer UT2; and (d) zoom-in view of the first three signals in (c).  4.2.PAT ImagingTo demonstrate the PA imaging capability of the handheld PADL-PAT probe, we imaged an optically absorptive target ( along the , , and axes, respectively) embedded in an optically scattering tissue phantom ( along the , , and axes, respectively), shown in Fig. 7(a). The phantom consisted of 10% gelatin by weight and 1% intralipid by volume, and its reduced scattering coefficient was . The object was located 2.5 mm below the phantom’s surface. The optical absorption coefficient of the target was . The raw A-line data with Hilbert transformation acquired by both channels are shown in Figs. 7(b) and 7(c). Fig. 7(a) Photograph of an optically absorbing target embedded in an optically scattering medium; (b) raw A-line PA signals with Hilbert transformation obtained by the ultrasonic transducer (UT 1); and (c) raw A-line PA signals with Hilbert transformation obtained by the ultrasonic transducer (UT 2).  The A-line PA data from both channels were rearranged into one raw Hilbert-transformed PA B-scan image, shown in Fig. 8(a). The reconstructed PA images are presented with compensation for the ultrasound attenuation () in each fiber, as shown in Fig. 8(b). The reconstructed PA images match well with the photograph in Fig. 7(a). The image contrast, defined as , is calculated to be . The spatial resolution, defined as the one-way distance between 10% and 90% of the maximum over the minimum, is . Compared to our previous results,9 we found that the PA signals were broadened and more noisy due to the increased contact junctions and bends of the optical fibers in the small housing unit. Thus, the image contrast and spatial resolution were slightly diminished, by 20% and 37%, respectively. Further, the enhanced PA image can be presented after the signal threshold of 30% [Fig. 8(c)]. 5.Conclusion and DiscussionIn this work, we have successfully demonstrated a handheld PAT probe using optical-fiber PADLs. To minimize their layout space, laser-micromachined spacer structures were used to wind the optical-fiber PADLs into spiral coils with suitable radii of curvature. Thus, all 16 optical-fiber PADLs fit into a compact probe structure suitable for handheld operation. By properly designing and constructing the microspacer structures and carefully threading the optical fibers, we achieved robust and accurate placement of the optical-fiber PADLs with small acoustic distortion and interchannel coupling. Using the handheld PADL probe, 16 channels of PA signals can be unambiguously received with two single-element transducers and two DAQ channels, which corresponds to a channel reduction ratio of 8:1. The handheld PADL probe could be used to conduct real-time PAT without a complex ultrasound receiver system. It should be noted that using optical fibers as the PADLs has some drawbacks. To achieve higher lateral imaging resolution, a larger number of PADLs are desired. However, as the number of PADLs increases, the optical fibers will become longer and the acoustic attenuations will be higher, which will also make the probe assembly process more complex and labor-intensive. A second issue is the uncontrolled ultrasound detection angle due to the small diameter of the optical fiber (e.g., 100 to ). To receive the PA signals within a well-controlled detection angle requires a larger size (e.g., ) of the input terminal. In the future, new PADL materials, designs, and construction methods will be investigated to address these issues and also to improve the PA imaging capability (e.g., a larger number of channels and higher channel reduction ratio). AcknowledgmentsThis work was supported in part by a grant (CMMI-1131758) from the National Science Foundation to J.Z., a grant (U54-CA136398) from the National Institutes of Health to L.V. W., and by MSIP (Ministry of Science, ICT, and Future Planning), Korea, under the “IT Consilience Creative Program” (NIPA-2013-H0203-13-1001) supervised by the NIPA (National IT Industry Promotion Agency) and NRF grant of Korea government (MSIP) (2011-0030075) to C.K. L. V. Wang has a financial interest in Microphotoacoustics, Inc., and in Endra, Inc., which, however, did not support this work. ReferencesA. A. Oraevsky and A. A. Karabutov, Biomedical Photonics Handbook, CRC, Boca Raton, Florida
(2003). Google Scholar
C. Kim, C. Favazza and L. V. Wang,
“In vivo photoacoustic tomography of chemicals: high-resolution functional and molecular optical imaging at new depths,”
Chem. Rev., 110
(5), 2756
–2782
(2010). http://dx.doi.org/10.1021/cr900266s CHREAY 0009-2665 Google Scholar
L. Wang, Photoacoustic Imaging and Spectroscopy, CRC, Boca Raton, Florida
(2009). Google Scholar
L. V. Wang and S. Hu,
“Photoacoustic tomography: in vivo imaging from organelles to organs,”
Science, 335
(6075), 1458
–1462
(2012). http://dx.doi.org/10.1126/science.1216210 SCIEAS 0036-8075 Google Scholar
M. P. Fronheiser et al.,
“Real-time optoacoustic monitoring and three-dimensional mapping of a human arm vasculature,”
J. Biomed. Opt., 15
(2), 021305
(2010). http://dx.doi.org/10.1117/1.3370336 JBOPFO 1083-3668 Google Scholar
J. Gamelin et al.,
“A real-time photoacoustic tomography system for small animals,”
Opt. Express, 17
(13), 10489
–10498
(2009). http://dx.doi.org/10.1364/OE.17.010489 OPEXFF 1094-4087 Google Scholar
L. Song et al.,
“High-speed dynamic 3D photoacoustic imaging of sentinel lymph node in a murine model using an ultrasound array,”
Med. Phys., 36
(8), 3724
(2009). http://dx.doi.org/10.1118/1.3168598 MPHYA6 0094-2405 Google Scholar
C. Kim et al.,
“Handheld array-based photoacoustic probe for guiding needle biopsy of sentinel lymph nodes,”
J. Biomed. Opt., 15
(4), 046010
(2010). http://dx.doi.org/10.1117/1.3469829 JBOPFO 1083-3668 Google Scholar
M. K. Yapici et al.,
“Parallel acoustic delay lines for photoacoustic tomography,”
J. Biomed. Opt., 17
(11), 116019
(2012). http://dx.doi.org/10.1117/1.JBO.17.11.116019 JBOPFO 1083-3668 Google Scholar
J. May,
“Wire-type dispersive ultrasonic delay lines,”
IRE Trans. Ultrasonic Eng., 7
(2), 44
–52
(1960). http://dx.doi.org/10.1109/T-PGUE.1960.29263 0096-1019 Google Scholar
I. Gelles,
“Optical-fiber ultrasonic delay lines,”
J. Acoust. Soc. Am., 39
(6), 1111
–1119
(1966). http://dx.doi.org/10.1121/1.1909998 JASMAN 0001-4966 Google Scholar
M. Xu and L.V. Wang,
“Universal back-projection algorithm for photoacoustic computed tomography,”
Phys. Rev. E, 71
(1), 016706
(2005). http://dx.doi.org/10.1103/PhysRevE.71.016706 PLEEE8 1063-651X Google Scholar
BiographyYoung Cho is a PhD student in the Department of Electrical and Computer Engineering at Texas A&M University, College Station, Texas, USA. He received his BS and MS degrees in biomedical engineering from Kyung Hee University (Seoul, South Korea) in 2005 and 2007, respectively. His current research interests include microfabrication and micromachining technologies, and the development of microacoustic devices for ultrasound and photoacoustic imaging applications. Cheng-Chung Chang received his BSc degree in electronics engineering from National Chiao Tung University (Hsinchu, Taiwan) in 2006. He is currently pursuing his PhD degree in the Department of Electrical and Computer Engineering at Texas A&M University, College Station, Texas, USA. His research interests include microfabrication and micromachining technologies, microelectromechanical devices and systems, and micro-optical devices for sensing applications. Jaesok Yu received his MS from the Electronic Engineering Department of Sogang University, Seoul, South Korea, in 2012. Currently, he is a PhD student in the Department of Bioengineering at the University of Pittsburgh, Pittsburgh, Pennsylvania, USA. His research interest is photoacoustic molecular imaging for detection of disease specific biomarkers. Mansik Jeon received his PhD degree in electrical engineering from Kyungpook National University, Daegu, Republic of Korea in 2011. He is currently working as a postdoctoral researcher in the Bio Optics and Acoustics Laboratory directed by Prof. Chulhong Kim at Pohang University of Science and Technology (POSTECH) in Korea. His research interests lie in the development of optical imaging systems including photoacoustic tomography, optical coherence tomography, and their clinical applications. Chulhong Kim received his PhD degree from Washington University in St. Louis, St. Louis, Missouri, USA. He is currently an assistant professor of Creative IT Engineering at Pohang University of Science and Technology (POSTECH) in Korea. From August 2010 to February 2013, he was an assistant professor of biomedical engineering at the State University of New York at Buffalo. His research interests lie in the development, clinical translation, and commercialization of optical and ultrasound imaging techniques. Lihong V. Wang received his PhD degree in electrical engineering from Rice University, Houston, Texas, USA, in 1992. He is currently the Gene K. Beare distinguished professor of biomedical engineering at Washington University in St. Louis, St. Louis, Missouri, where he directs the Optical Imaging Laboratory and the Imaging Division. He is a fellow of the AIMBE, OSA, and SPIE, and the elected editor-in-chief of the SPIE Journal of Biomedical Optics since 2010. Jun Zou received his PhD degree in electrical engineering from the University of Illinois at Urbana-Champaign (UIUC) in 2002. In 2004, he joined the Department of Electrical and Computer Engineering at Texas A&M University, College Station, Texas, USA, where he is currently an associate professor. His research interests lie in the development of micro- and nano-opto-electro-mechanical devices and systems for biomedical imaging and sensing applications. |


