|
|
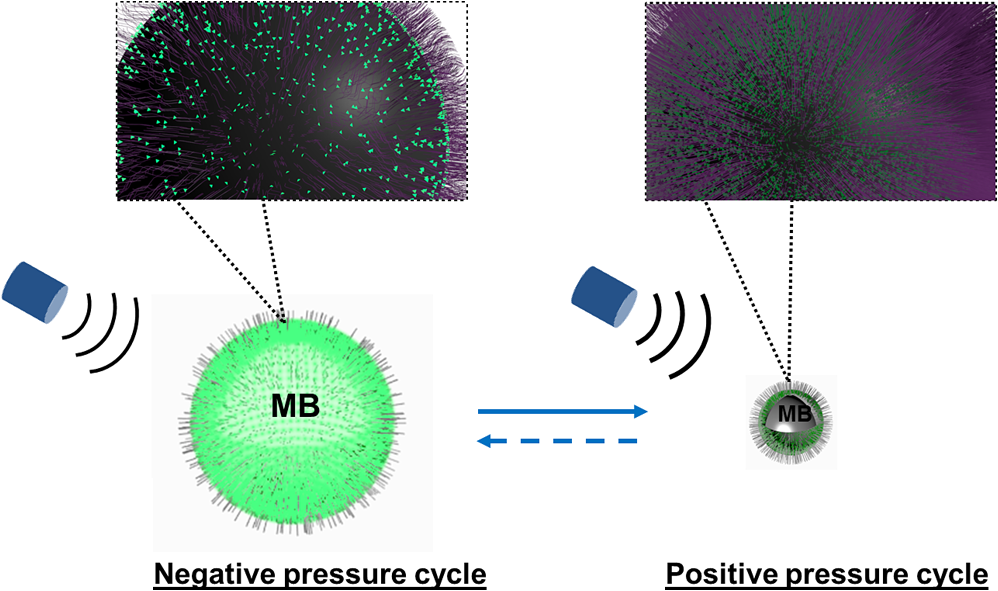
1.IntroductionUltrasound-modulated fluorescence (UMF) has been demonstrated in the past years.1–5 One of its unique features is that it can provide tissue fluorescent contrast with ultrasound resolution.1–4 The concept of UMF is similar to ultrasound-modulated optical tomography, which has been widely studied.6–18 A focused ultrasound beam is used to modulate the diffused fluorescent photons in the acoustic focal region. Specifically, by analyzing the modulated fluorescent photons, one can isolate and quantify the fluorescence properties within the ultrasonic focal zone. As a result, UMF may provide anatomical, functional, and molecular information of tissue via appropriate fluorophores while maintaining ultrasonic resolution and imaging depth.2,3,19–22 UMF may be used alone or as a complementary tool for conventional ultrasound imaging.23–28 For example, simultaneous imaging of multiple molecular targets is highly desired for investigating different signaling pathways and their potential crosstalk in tumor angiogenesis.29 It would be extremely difficult for ultrasound alone30–32 because the ultrasonic echoes cannot be distinguished from similarly sized microbubbles that are attached to different molecules. Therefore, waiting for tens of minutes is necessary to ensure passive clearance (or active destruction) of targeted microbubbles before the second type of microbubbles is administered.32 Accordingly, ultrasound can be considered a technique for sequential imaging of multiple molecular targets via microbubbles. By contrast, the UMF technique has the potential to simultaneously image multiple molecules by labeling them with fluorophores having different excitation and emission spectra. Besides the advantages in molecular imaging, UMF may exhibit unique features when imaging the functional information of tissue. For example, while tumor hypoxia may be imaged via UMF by using a fluorophore that is sensitive to tissue oxygenation, tumor pH may be imaged similarly by selecting a pH-sensitive fluorophore. Generally, one may envision that UMF can transfer the possible applications of conventional fluorescence microscopy from sliced samples or superficial tissues to deep tissues. UMF can also bring possible applications of the techniques based on diffused fluorescent photons (such as fluorescence diffuse optical tomography) from a low- to high-resolution regime. Each of these unique features makes UMF a valuable tool worthy of further development. Currently, the major challenge of UMF is the low modulation depth (the ratio of modulated signal to unmodulated signal) due to the incoherent property of fluorescence and the insensitivity of most fluorophores to ultrasonic waves.1 Microbubbles have been investigated to improve the modulation depth of UMF.2,5,19 Theoretically, because a microbubble can significantly oscillate in size when activated by an ultrasonic wave, the surface concentration of the fluorophores can be dramatically modulated. Thus, the quenching efficiency and the fluorescence intensity can be modulated at the ultrasound frequency, which generates the UMF signal.33 Experimentally, microbubbles have been reported to significantly enhance the UMF signal when simply mixed with a fluorophore solution.2 Recently, a significant UMF signal was also observed from microbubbles whose phospholipid shell was embedded with a type of lipophilic carbocyanine fluorophore (DiI).5 Although significant progress has been made during the past years, there is a great deal of fundamental work that should be investigated to push this technique toward real biomedical applications. For example, (1) the synthesis of UMF contrast agents should be simple, and the selection of fluorophores should be flexible so they can be widely used in the field; (2) how many fluorophores should be labeled on microbubbles to achieve high-modulation efficiency should be quantitatively investigated; (3) how the UMF signal is quantitatively related to microbubble oscillation and therefore ultrasound pressure should be experimentally studied; and (4) sensitive systems should be developed to detect weak UMF signals in optically scattering media. Current studies are attempting to address these challenges by developing a simple microbubble-based UMF contrast agent and a sensitive imaging system that can monitor microbubble oscillation and detect UMF signals. In this study, microbubbles are loaded with fluorophores with different concentrations on the surface via a commonly used chemical reaction between amine and NHS ester. We then quantitatively studied how the UMF and its modulation depth are related to the microbubble oscillation amplitude at different ultrasound pressures and the initial surface fluorophore quenching status. Finally, UMF was demonstrated using a 500 μm polydimethylsiloxane (PDMS) tube filled with the novel contrast agents in water and a scattering medium (intralipid solution). 2.Principle of UMF via Fluorophore-Labeled MicrobubblesFigure 1 schematically illustrates the principle of UMF based on a fluorophore-labeled microbubble. It is well known that fluorescence quenching depends highly on the fluorophore concentration or intermolecular distance.34–37 By manipulating the space distribution or the proximity of the fluorophores, the quenching depth and fluorescence intensity can be changed. The proposed fluorophore-labeled microbubble takes advantage of the size change in response to ultrasound.38 When a microbubble is initially loaded with fluorophores on the surface and insonified by an ultrasound wave, the surface concentration of the fluorophores can be accordingly modulated. As the microbubble is compressed in a positive ultrasonic pressure cycle, the surface concentration of the fluorophores increases, causing significant quenching and, therefore, an obvious reduction of the fluorescence intensity. On the contrary, as the microbubble is expanded during a negative ultrasonic pressure cycle, the surface concentration of the fluorophores decreases, weakening the quenching and leading to an obvious increase in the fluorescence intensity. 3.Material and Methods3.1.Preparation of Fluorophore-Labeled MicrobubblesMicrobubbles were formulated with a lipid suspension of 90 mol % DSPE (1,2-Distearoyl-sn-glycero-3-phosphoethanolamine, ME-8080, NOF America Corp., New York) and 10 mol % DSPE-PEG [N-(carbonyl-methoxypolyethyleneglycol 2000)-1,2-distearoyl-sn-glycero-3-phosphoethanolamine, DSPE-020CN, NOF America Corporation, New York] at in 100 mL of phosphate-buffered saline (PBS, pH 7.2). Perfluorobutane (APF-N2HP, FluoroMed, Texas) gas was encapsulated as the gas core.39 Microbubbles with sizes distributed between and were selected for use. The size distribution of the microbubbles was determined by laser light obscuration and scattering (Accusizer 780A, NICOMP Particle Sizing Systems, Santa Barbara, California). To conjugate fluorophores on the microbubble surface, an ATTO532-NHS (Sigma-Aldrich, Missouri) dye solution was added to a diluted microbubble solution. To control the initial surface concentration of the dye on the microbubbles, several NHS-to-amine molar ratios were adopted; they are listed in Table 1. The mixture was reacted in a pH 8.5 PBS buffer (adjusted pH with 0.1 M NaOH) for 1 h at room temperature with constant gentle agitation. After that, the unreacted ATTO532-NHSs were removed through three rounds of centrifugal washing. The purified fluorophore-labeled microbubbles were diluted and injected into a glass chamber at the bottom of a water tank for imaging, as shown in Fig. 2. The chamber was made with two cover glasses (12-548-B, Fisher Scientific, Pittsburgh) stuck together by double-sided Scotch tape, creating a space distance of . Note that this fluorophore was selected because of its high quantum yield and high photon stability and because our picosecond (ps) laser for fluorescence lifetime image has a wavelength of 532 nm. Table 1Fluorophore-labeled microbubble (MB) solution.
3.2.Characterization of Fluorescence Intensity and Lifetime of Fluorophore-Labeled MicrobubblesAll experiments were conducted with a Nikon inverted microscope (Ti-U, Nikon), as shown in Fig. 3(a). A 532-nm ps laser (Katana, Onefive, Zurich, Switzerland) was synchronized with a gated and intensified charge-coupled camera (ICCD) system (Picostar HR, LaVision, Goettingen, Germany) (a minimum gate width is 200 ps) as a fluorescence lifetime imaging microscope system (FLIM). This FLIM system was used to measure the fluorescence intensity and lifetime of the fluorophore-labeled microbubbles. The ps pulsed laser was coupled into a multimode optical fiber ( core diameter). The output light from the fiber was collimated and delivered to a filter cube where an excitation filter, a dichroic mirror, and an emission filter were installed. The dichroic mirror reflected the light into a oil immersion objective [, working distance ] to illuminate the sample. The emitted fluorescence from the microbubbles was collected by the same objective lens and was detected by the gated ICCD camera system after passing through the same dichroic filter, an emission filter, and a flip mirror. In the filter cube, a 525/40-nm band pass filter (FF02-525/40-25, Semrock, New York), a 552-nm dichroic filter (FF552-Di02, Semrock, New York), and a 578/28-nm band pass filter (FF01-572/28-25, Semrock, New York) were used as the excitation, dichroic, and emission filters for dye ATTO532-NHS, respectively. Note that the excitation filter was not necessary when the ps-pulsed laser (532 nm) was used for lifetime imaging. However, it was necessary to select the appropriate light to excite the fluorophores when a lamp was used for UMF signal detection (see the next paragraph). The ICCD camera system incorporated a high-rate imager (Kentech Instruments Ltd., Oxfordshire, United Kingdom) and a ps delay unit, which enabled it to generate a time gate as short as 200 ps that could be temporally scanned with a step size down to . Here, we chose a gate width of 300 ps and a temporal step size of 100 ps, which was narrow enough to image fluorescence lifetime in a range of nanoseconds (ns). Images were saved in the computer and processed later with MATLAB. In order to calculate the fluorescence lifetime, the acquired images were fitted to a single exponential decay function pixel by pixel. An iterative numerical procedure was done until the best agreement between the experimental decay curve and the theoretical model decay curve was achieved. For each microbubble, the fluorescence lifetime of every pixel was calculated; therefore, the fluorescence lifetime image of the microbubble was obtained. The fluorescence intensity image of the same microbubble was obtained by selecting the image with the highest intensity in the sequences. For simplicity, the fluorescence lifetime and intensity of a bubble were defined as the mean lifetime and intensity of all the pixels in that bubble image. For statistical analysis, at least 10 microbubbles were randomly selected in the population. The averaged lifetime and intensity with standard deviation were calculated based on those microbubbles. Fig. 3(a) A schematic diagram showing the imaging system for characterization of a single microbubble’s oscillation and its UMF signal; PA: power amplifier; FG: function generator; PDG: pulse delay generator; UST: ultrasound transducer; OS: oscilloscope. (b) An example to show the microbubble oscillation measured by the ICCD camera system, and the synchronization between the bubble oscillation and the ultrasound-driven UMF signal. Note that the images displayed were selected from the actually collected images and the delay time between two sequential images is .  3.3.Detection of Ultrasound-Driven Microbubble Oscillations and UMF Signal from Individual MicrobubblesFigure 3(a) was designed to study the ultrasound-driven microbubble oscillation and the corresponding UMF signal. In the acoustic part [see the green blocks on Fig. 3(a)], a 1-MHz single element ultrasound transducer (UST, V314-SU-F-1.00-IN-PIT, Olympus NDT, Texas) with a focal length of 25.4 mm was mounted onto a three-dimensional translational stage (PT1, Thorlabs) and focused on the microbubble sample. The driving signal was generated by an arbitrary function generator (FG, Agilent 33220A, Agilent Tech., California) and amplified by a radio-frequency power amplifier (PA, 2100L, Electronics & Innovation Ltd., New York). In this study, the driving signal was a three-cycle 1-MHz sinusoidal electronic wave with a repetition rate of 5 Hz. It generated an ultrasonic pressure oscillation with a cycle number slightly larger than 3 (or a duration time slightly longer than ) due to the finite bandwidth of the ultrasound transducer [see Fig. 3(b)]. In the optical part, the ICCD camera was employed to detect microbubble oscillation [see the blue blocks on Fig. 3(a)]. The principle was introduced in our previous publication.40 Briefly, to observe the fast bubble oscillation, a bright xenon strobe light source (AC-4020-C, Electromatic Equip’t Co., Inc., New York) was used to illuminate the oscillating bubble via a fiber bundle (40-644, Edmund Optics, New Jersey). The strobe light source illuminated a light pulse when receiving a trigger signal from the pulse delay generator (PDG) that was used to synchronize the strobe light, ultrasound pulse, and ICCD camera recording. In each ultrasound pulse (slightly longer than ), the strobe light was triggered on ( and the ICCD camera was gated on with a window width of 20 ns to capture a frame image of the oscillating bubble. To reconstruct the entire bubble oscillation event during the period of the ultrasound pulse, the above procedure was repeated (with a repetition rate of 5 Hz). Compared with each previous step, the time to trigger on the ICCD camera for 20 ns was delayed by 100 ns in each repeated ultrasound pulse. Thus, each frame image acquired by the ICCD camera had a time interval of 100 ns. Eventually, a total of 44 ultrasound pulses were repeated, and the ICCD camera captured a total of 44 frames of images, which covered a total duration of (). Those frames were saved and processed with MATLAB. In each frame, the contour of the microbubble was delineated, and the bubble diameter was calculated. By repeating this procedure for all 44 frames, a diameter versus time curve was generated and shown on Fig. 3(b). After the oscillation measurement, the UMF signal from the same microbubble was detected with the system shown in Fig. 3(a) (see the orange blocks). The light source was switched to a lamp (Lumen 200, Prior Scientific, Massachusetts) to excite the fluorophores on the microbubbles (note that a lamp provided a large and relatively uniform illumination area compared with the laser). An adjustable iris was positioned in front of the lamp and used to control the illumination area in such a way that only one microbubble was illuminated in the field of view. The fluorescent emission was detected by a cooled photomultiplier (PMT, H7422-20, Hamamatsu, New Jersey). After that, the electronic signal from the PMT was amplified by a broadband amplifier (SR445A, Stanford Research Systems, California), filtered by a low-pass filter (, Mini-Circuits), and finally acquired by a high-speed digital oscilloscope. The oscilloscope was synchronized with the ultrasound pulse via the PDG so that it acquired and displayed the UMF signal when the microbubble was oscillating [see Fig. 3(b)]. The PDG with multiple channels (DG645, Stanford Research Systems, California) was used as the master clock to trigger the function generator, xenon light, ps laser, ICCD camera system, and oscilloscope. 3.4.UMF Measurement from a Microbubble PopulationFollowing the characterization of individual microbubbles, the UMF signal from a microbubble population was investigated. Specifically, a microchannel was filled with the solution of the UMF contrast agents, and the UMF signal was collected using an imaging system as shown in Fig. 4. The channel was covered by a slab phantom that was made of either a clear medium (water) or an optically scattering medium (intralipid solution). The major difference of this imaging system from the one shown in Fig. 3 was that a gated boxcar integrator (SR250, Stanford Research Systems, California) was used to increase detection sensitivity to the UMF signal. The contrast agents were injected into a PDMS microchannel (SynVivo, CFD Research Corporation, Alabama) with a concentration of , measured by a hemacytometer (bright-line, Hausser Scientific, Pittsburgh). A continuous-wave (CW) 532-nm laser (MGLII532, Dragon Lasers, Jilin, China) was used as the excitation light source. A objective (CFI Plan Achro, , Nikon, New York) with a WD of 30 mm was adopted to deliver the excitation light and to collect the emission light. The same optical filters used for Fig. 3 were employed here. In comparison with the single microbubbles, a bulk solution of the microbubbles has a relatively strong background fluorescence because of the large illumination area and the existing residue of the free fluorophores in the volume. To extract the UMF signal from the strong background, the gated integrator was employed after the (electronic) low-pass filter and before the oscilloscope. The gate window of the integrator was set to , which was precisely controlled to be overlapped with a two-cycle UMF signal in response to the ultrasound wave [see Fig. 4(b)]. The UMF signal within the gate window was integrated, and the integrator output a voltage that was proportional to the average of the input signal. An asymmetric input signal relative to the baseline was desired to avoid a zero output. A moving exponential average of 300 samples was selected to increase the signal-to-noise ratio. (A moving exponential average is formed by putting more weight to the recent values, therefore, it has less time lag. The signal-to-noise ratio is increased by the square root of the number of samples in the average in the case of random white noise background.) The 1-MHz transducer mounted on the translational stages was scanned across the tube with a step size of 0.635 mm, and the UMF signal acquired by the gated integrator was displayed on the oscilloscope. In the phantom experiment, a 0.5% intralipid slab phantom with a thickness of 2 mm (, and was positioned between the microchannel sample and the objective lens to mimic a scattering tissue. Fig. 4(a) A schematic diagram showing the imaging system for UMF scanning across a tube; PA: power amplifier; FG: function generator; PDG: pulse delay generator. (b) A diagram showing the gate window of the integrator that was overlaid with the signal.  As a short summary, four light sources were used in the imaging system according to their unique features. The ps-pulsed laser was used for ns-lifetime imaging of the fluorescent contrast agents. The strobe light source was used to provide strong illumination in a 20-ns exposure window for imaging the oscillating bubbles. The lamp was used to provide preferred large and relatively uniform illumination under a objective for measuring the UMF from individual microbubbles. The 532-nm CW laser was employed to provide a stronger illumination under a objective for measuring the UMF from a microbubble population. 4.Results and Discussion4.1.Quantification of Self-Quenching on Individual Fluorescent MicrobubblesAs listed in Table 1, six groups of fluorophore-labeled microbubble solutions were prepared by mixing the solutions of the ATTO532-NHS dye and the amine-attached microbubble solutions with an NHS-to-amine mole ratio of 0.01, 0.03, 0.1, 0.3, 1, and 3, respectively. Figure 5(a) shows a set of the representative fluorescence lifetime images of the six groups of microbubbles. Averaged lifetime and intensity were plotted as a function of the mole ratio. The averaged lifetime decreases as the dye concentration increases, as shown in Fig. 5(b). Using group #6 as an example, it has the highest NHS-to-amine ratio and shows the shortest fluorescence lifetime of , revealing a strong self-quenching. By contrast, group #1 has the lowest NHS-to-amine ratio and shows the longest fluorescence lifetime (), indicating no or little quenching occurs because the 3.8 ns is the lifetime of the free ATTO532-NHS. This is also confirmed by the fluorescence intensity result in Fig. 5(c). Generally, the fluorescence intensity first increases as the surface dye concentration increases and then drops at a higher dye concentration where the self-quenching dominates. Fig. 5(a) Fluorescence lifetime images of individual fluorophore-labeled microbubbles in the six groups, as listed in Table 1. The scale bar is , and the label of the color scale is from 0 to 4 ns. (b) The averaged fluorescence lifetime and (c) the averaged fluorescence intensity with standard deviation (shown as error bar) of 10 randomly chosen microbubbles were plotted as a function of NHS-amine mole ratio.  4.2.Quantification of Individual Fluorescent Microbubble Oscillations under Different Ultrasound PressuresThe amplitude of microbubble oscillation under different ultrasound pressures was measured for all six groups. We use peak–peak pressure in this paper. The oscillation amplitude was calculated as the difference between the maximum diameter during the bubble expansion and the minimum diameter during the bubble contraction. The results are plotted as a function of the ultrasound pressure in Fig. 6. The results show that the oscillation amplitude increases almost linearly with ultrasound pressure. An averaged maximum of oscillation amplitude is observed at 675 kPa, indicating a 33% size change when considering that the average bubble size is . No significant difference was observed among the six groups, which implies that the bubble oscillations are independent of the surface dye concentrations. In this study, the ultrasound pressure was controlled to be no larger than 675 kPa to minimize bubble translation or fragmentation. When the ultrasound pressure was further increased, microbubbles were moved from their resting positions and became difficult to track with the gated ICCD camera system. Some of the observed microbubbles still underwent translation even at the pressure of 675 kPa. The results displayed in Fig. 6 are based on at least 10 randomly selected microbubbles; bubbles that experienced moving, shrinking, or breaking during experiments were discarded from the analysis. 4.3.Quantification of the UMF Signal from Individual Fluorescent MicrobubblesFigure 7(a) shows a typical UMF signal acquired from a single fluorescent microbubble in group #5. A clear fluorescent oscillation was observed when the ultrasound was applied. With the absence of ultrasound pulse, the fluorescent emission was nearly constant. The asymmetric oscillation around the baseline is related to the microbubble’s initial quenching status. In group #5, the bubbles initially presented a strong quenching. When ultrasound was applied, the bubble compression increased the quenching effect to a limited degree and caused a relatively small fluorescence decrease. Conversely, the bubble expansion caused a significant signal increase. The strength of the UMF intensity was calculated as the peak-to-peak voltage. As Fig. 7(b) illustrates, the UMF intensity was strongly dependent on the surface dye concentration. Groups #4 and #5 showed the strongest UMF signal, followed by group #6 and then groups #3, #2, and #1. Note that nonzero voltage noise () was observed when the ultrasound pressure was 0 kPa. The noise was mainly due to the baseline fluctuation and was calculated as a peak-to-peak value in the same time window of the UMF presence. Therefore, any signal below or around was considered to be noise. Thus, group #1 showed almost no UMF signal and can be neglected. To better compare the results, the UMF modulation depth was calculated and is shown in Fig. 5(c). The modulation depth is a relative value and is defined as the ratio of the UMF strength to the corresponding unmodulated fluorescence (i.e., the baseline of the fluorescence or the DC fluorescence signal when there is no ultrasound). Group #1 is not compared here since it presents a negligible UMF signal. As shown in Fig. 7(c), the UMF modulation depth was proportional to the surface dye concentration. Group #6 had the highest dye concentration and exhibited the highest UMF modulation depth, followed by groups #5, #4, #3, and #2. This can be interpreted as follows: when the initial dye concentration is high and the quenching is significant, the bubble fluorescence intensity (i.e., the baseline of the fluorescence) is weak. Thus, even a small UMF caused a significant modulation depth. The results in Figs. 7(b) and 7(c) also imply that the UMF signal strength and modulation depth have a strong correlation to the applied ultrasound pressure. A larger oscillation induced a stronger UMF signal strength and modulation depth. An averaged maximum modulation depth of was observed at a pressure of 675 kPa with the microbubbles in group #6. We believe that the modulation depth () is mainly limited by the small oscillation of the microbubbles (). At the risk of destroying microbubbles, a higher ultrasound pressure may be applied to induce an even higher UMF signal. It has been shown that a microbubble diameter can be expanded approximately three times before collapse.41 We observed an approximately four times expansion under a high acoustic pressure of 1 MPa (results not shown). However, the bubbles were quickly broken. To get a stable UMF signal, repeatable oscillations of bubbles were desired. Therefore, the applied ultrasound pressure in this section was maintained for investigating more stable microbubble oscillations and the corresponding UMF signals. 4.4.UMF Signal from a Population of Fluorescent MicrobubblesIn the first experiment, the slab phantom shown in Fig. 4 was made of water (a clear medium). The group #5 contrast agents were employed and injected into the PDMS microchannel tube. We chose those contrast agents because they have strong UMF modulation depth and relatively bright fluorescent emission. When the ultrasound transducer was focused onto the tube, the UMF signal was measured under different ultrasound pressures. The results were normalized and displayed on Fig. 8(a). The UMF signal increased as the applied pressure increased until it reached the maximum at 405 kPa. After that, the UMF signal decreased due to bubble breakage caused by the strong ultrasound pressure. At 765 kPa, the signal decreased to 0, and no bubbles remained in the solution, as observed under the microscope. These results were averaged based on three repeated experiments. After each experiment, the transducer was moved to a different location along the tube direction where microbubbles were intact, as shown in the inset on Fig. 8(a). Compared to the previous results in Figs. 6 and 7, bubbles in the tube presented a lower fragmentation threshold (). This can be explained as follows: the cover glasses used in the individual microbubbles experiments (Figs. 6 and 7) had a larger acoustic impedance than the PDMS used in the microbubble population studies (Fig. 8).42 Thus, the boundaries formed between the cover glasses and the surrounding water reflected more acoustic energy than the boundaries formed by the PDMS and the surrounding water. Therefore, a larger acoustic energy was needed to oscillate bubbles. After testing, the energy transfer efficiency is through the cover glass and through PDMS. After calculation, the actual energy applied to the microbubbles sample was after the cover glass and 390 kPa after the PDMS medium. It shows that the actual pressure applied to the bubble solution was a little smaller than that applied for oscillating individual bubbles. This difference can be induced by other factors, such as the tube geometry and microbubble concentration. Fig. 8(a) Normalized UMF signal from fluorescent microbubbles filled in a microtube through water as a function of ultrasound pressure. The arrows in the inset indicate that the ultrasound transducer was focused on three different locations on the tube. (b) Normalized UFM signal from fluorescent microbubbles filled in a microtube through a 2-mm-thick intralipid slab phantom as a function of the lateral location of the 1-MHz ultrasound transducer. The dotted square line shows ultrasonic echo data that were recorded based on the conventional pulse-echo method. The solid diamond line shows the UMF signal. The arrow in the inset indicates that the transducer was scanned across the tube repeatedly for three times.  In the second experiment, the slab phantom shown in Fig. 4 was replaced with the intralipid phantom. The ultrasound pressure was fixed to 405 kPa. Figure 8(b) displays the UMF signal strength when scanning the ultrasound transducer across the tube; the inset of Fig. 8(b) shows the measurement configuration. The dotted square line shows ultrasonic echo data from the empty PDMS tube that were recorded based on the conventional pulse-echo method. The solid diamond line shows the UMF signal from the tube through a 2-mm-thick intralipid slab phantom. The two data sets were normalized and displayed together. The results show a similar FWHM of , which indicates the feasibility of detecting UMF signal using microbubble contrast agents in scattering media. Generally, the UMF modulation efficiency in the bulk solution deteriorated because of the increase in the unmodulated fluorescent emissions from the large illuminated area and unattached fluorophores. In addition, microbubble oscillation behavior could be constrained by the nearby boundaries in the surrounding environment,43–45 which could also affect the overall modulation efficiency. The employment of a gated integrator greatly increased the detection sensitivity and system signal-to-noise ratio. It is worth mentioning that when choosing contrast agents, some factors need to be taken into consideration: (1) strong modulation efficiency is necessary to extract UMF from background; (2) asymmetric UMF oscillation is required for the gated integration detection; and (3) relatively strong fluorescent signals are necessary for the UMF detection in the scattering media. 4.5.Further Discussions about the Fluorescent Microbubbles and the Imaging SystemsThe previously developed UMF contrast agent5 has several limitations because the fluorophores were attached to the microbubble shell via the lipophilicity. First, the fluorophores can only be selected from the family of lipophilic dyes that have high affinity to the microbubble phospholipid shell. Unfortunately, the number of lipophilic dyes is limited. Second, the shell material of the adopted microbubbles has to be lipid. These limitations prevent the majority of fluorophores (not lipophilic) and microbubbles (with nonlipid shells) from being used as UMF contrast agents. The strategy of labeling fluorophores on the surface of a microbubble via different chemical or biochemical interactions, such as amine-NHS and biotin-streptavidin, can significantly broaden the selection of fluorophores and microbubbles. Currently, fluorophores and microbubbles attached with various functional groups have been widely reported in the literature and many of them are available commercially.39,46–48 Thus, the synthesis of microbubble-based UMF contrast agents become straightforward, which is necessary for bringing this technique into practical application. More importantly, simultaneous multimolecule targeted imaging becomes straightforward by using fluorophores with different excitation and emission wavelengths, which will be investigated in the future. The two imaging systems shown in Figs. 3(a) and 4(a) are unique in the following respects: (1) the combination of the ultrasonic and optical systems enables us to optically investigate the ultrasound-induced microbubble oscillation and UMF signal; (2) the high temporal ( or ) and spatial () resolutions enable us to investigate the fast oscillation of individual microbubbles at a megahertz ultrasound frequency and the fluorescence lifetime on an individual microbubble’s surface at a level of nanoseconds; (3) the capability of both white light and fluorescent detections enables us to investigate the bubble oscillation, fluorescence lifetime, and UMF signal from the same individual microbubble; and (4) the high (optical and electronic) sensitivity enables us to detect the weak UMF signal from the scattering medium. 5.ConclusionsIn this study, fluorophore-labeled microbubble-based UMF contrast agents were developed via a commonly used amine-NHS reaction. They are characterized by using unique imaging systems. The results showed that excellent UMF modulation efficiency was achieved. The initial concentration of fluorophores on the microbubble surface was optimized to balance fluorescence intensity and quenching. The fluorophore-labeled microbubbles demonstrated a strong quenching effect with a high surface loading of fluorophores. UMF signals were demonstrated in response to ultrasound pressure, and the UMF modulation depth was proven proportional to the microbubble oscillation amplitude. A UMF modulation depth of was detected corresponding to a size change of from individual microbubbles. Further, UMF signals from a tube in water and a scattering medium were observed with an ultrasound resolution. The observed UMF intensity was enhanced with stronger ultrasound pressure first and then decreased due to bubble fragmentation at an ultrasound pressure of . The obvious UMF signal and high modulation depth indicate that those contrast agents can be potentially used for multicolor molecular imaging in the future. AcknowledgmentsThis work was supported in part by funding from the NIH/NIBIB 7R15EB012312-02 (B. Y.), the CPRIT RP120052 (B. Y.), the NSF CBET-1253199 (B. Y.), and the NSF CBET-1133687 (M. B.). ReferencesB. H. YuanY. Liu,
“Ultrasound-modulated fluorescence from rhodamine B aqueous solution,”
J. Biomed. Opt., 15
(2), 021321
(2010). http://dx.doi.org/10.1117/1.3333546 JBOPFO 1083-3668 Google Scholar
B. H. Yuanet al.,
“Microbubble-enhanced ultrasound-modulated fluorescence in a turbid medium,”
Appl. Phys. Lett., 95
(18), 181113
(2009). http://dx.doi.org/10.1063/1.3262959 APPLAB 0003-6951 Google Scholar
M. Kobayashiet al.,
“Fluorescence tomography in turbid media based on acousto-optic modulation imaging,”
Appl. Phys. Lett., 89
(18), 181102
(2006). http://dx.doi.org/10.1063/1.2364600 APPLAB 0003-6951 Google Scholar
B. H. YuanJ. GamelinQ. Zhu,
“Mechanisms of the ultrasonic modulation of fluorescence in turbid media,”
J. Appl. Phys., 104
(10), 103102
(2008). http://dx.doi.org/10.1063/1.3021088 JAPIAU 0021-8979 Google Scholar
M. J. Benchimolet al.,
“Phospholipid/carbocyanine dye-shelled microbubbles as ultrasound-modulated fluorescent contrast agents,”
Soft Matter, 9
(8), 2384
–2388
(2013). http://dx.doi.org/10.1039/c2sm26900g 1744-683X Google Scholar
Y. Z. Liet al.,
“Pulsed ultrasound-modulated optical tomography using spectral-hole burning as a narrowband spectral filter,”
Appl. Phys. Lett., 93
(1), 011111
(2008). http://dx.doi.org/10.1063/1.2952489 APPLAB 0003-6951 Google Scholar
C. KimR. J. ZempL. H. V. Wang,
“Intense acoustic bursts as a signal-enhancement mechanism in ultrasound-modulated optical tomography,”
Opt. Lett., 31
(16), 2423
–2425
(2006). http://dx.doi.org/10.1364/OL.31.002423 OPLEDP 0146-9592 Google Scholar
T. W. Murrayet al.,
“Detection of ultrasound-modulated photons in diffuse media using the photorefractive effect,”
Opt. Lett., 29
(21), 2509
–2511
(2004). http://dx.doi.org/10.1364/OL.29.002509 OPLEDP 0146-9592 Google Scholar
G. RousseauA. BlouinJ. P. Monchalin,
“Ultrasound-modulated optical imaging using a photorefractive interferometer and a powerful long pulse laser,”
Proc. SPIE, 7177 71771D
(2009). http://dx.doi.org/10.1117/12.807954 PSISDG 0277-786X Google Scholar
S. SakadzicL. V. Wang,
“Advances in high-resolution ultrasound-modulated optical tomography in biological tissues,”
Proc. SPIE, 5697 174
–178
(2005). http://dx.doi.org/10.1117/12.589432 Google Scholar
L. H. V. Wang,
“Theoretical study on the mechanisms of ultrasonic modulation of multiply scattered light,”
Proc. SPIE, 4256 208
–212
(2001). http://dx.doi.org/10.1117/12.429309 Google Scholar
W. LeutzG. Maret,
“Ultrasonic modulation of multiply scattered-light,”
Phys. B, 204
(1–4), 14
–19
(1995). http://dx.doi.org/10.1016/0921-4526(94)00238-Q PHYBE3 0921-4526 Google Scholar
A. LevB. Sfez,
“In vivo demonstration of the ultrasound-modulated light technique,”
J. Opt. Soc. Am. A, 20
(12), 2347
–2354
(2003). http://dx.doi.org/10.1364/JOSAA.20.002347 JOAOD6 0740-3232 Google Scholar
L. H. V. Wang,
“Ultrasound-mediated biophotonic imaging: a review of acousto-optical tomography and photo-acoustic tomography,”
Dis. Markers, 19
(2–3), 123
–138
(2004). http://dx.doi.org/10.1155/2004/478079 DMARD3 0278-0240 Google Scholar
M. Kempeet al.,
“Acousto-optic tomography with multiply scattered light,”
J. Opt. Soc. Am. A, 14
(5), 1151
–1158
(1997). http://dx.doi.org/10.1364/JOSAA.14.001151 JOAOD6 0740-3232 Google Scholar
N. T. Huynhet al.,
“Ultrasound modulated imaging of luminescence generated within a scattering medium,”
J. Biomed. Opt., 18
(2), 020505
(2013). http://dx.doi.org/10.1117/1.JBO.18.2.020505 JBOPFO 1083-3668 Google Scholar
T. S. Leunget al.,
“Light propagation in a turbid medium with insonified microbubbles,”
J. Biomed. Opt., 18
(1), 015002
(2013). http://dx.doi.org/10.1117/1.JBO.18.1.015002 JBOPFO 1083-3668 Google Scholar
H. RuanM. L. MatherS. P. Morgan,
“Pulse inversion ultrasound modulated optical tomography,”
Opt. Lett., 37
(10), 1658
–1660
(2012). http://dx.doi.org/10.1364/OL.37.001658 OPLEDP 0146-9592 Google Scholar
D. J. Hallet al.,
“Detection of ultrasound-modulated photons and enhancement with ultrasound microbubbles,”
Proc. SPIE, 7177 71771L
(2009). http://dx.doi.org/10.1117/12.808603 PSISDG 0277-786X Google Scholar
D. J. HallU. SunarS. Farshchi-Heydari,
“Quadrature detection of ultrasound-modulated photons with a gain-modulated, image-intensified, CCD camera,”
Open Optics J., 2
(1), 75
–78
(2008). http://dx.doi.org/10.2174/1874328500802010075 OOJPC6 1874-3285 Google Scholar
Y. M. Wanget al.,
“Deep-tissue focal fluorescence imaging with digitally time-reversed ultrasound-encoded light,”
Nat. Commun., 3 928
(2012). http://dx.doi.org/10.1038/ncomms1925 NCAOBW 2041-1723 Google Scholar
K. SiR. FiolkaM. Cui,
“Fluorescence imaging beyond the ballistic regime by ultrasound pulse guided digital phase conjugation,”
Nat. Photonics, 6
(10), 657
–661
(2012). http://dx.doi.org/10.1038/nphoton.2012.205 1749-4885 Google Scholar
T. F. MassoudS. S. Gambhir,
“Molecular imaging in living subjects: seeing fundamental biological processes in a new light,”
Gene Dev., 17
(5), 545
–580
(2003). http://dx.doi.org/10.1101/gad.1047403 GEDEEP 0890-9369 Google Scholar
A. R. HsuX. Y. Chen,
“Advances in anatomic, functional, and molecular imaging of angiogenesis,”
J. Nucl. Med., 49
(4), 511
–514
(2008). http://dx.doi.org/10.2967/jnumed.107.050179 JNMEAQ 0161-5505 Google Scholar
K. GlundeA. P. PathakZ. M. Bhujwalla,
“Molecular-functional imaging of cancer: to image and imagine,”
Trends Mol. Med., 13
(7), 287
–297
(2007). http://dx.doi.org/10.1016/j.molmed.2007.05.002 TMMRCY 1471-4914 Google Scholar
B. M. SeddonP. Workman,
“The role of functional and molecular imaging in cancer drug discovery and development,”
Br. J. Radiol., 76 S128
–S138
(2003). http://dx.doi.org/10.1259/bjr/27373639 BJRAAP 0007-1285 Google Scholar
R. M. StephenR. J. Gillies,
“Promise and progress for functional and molecular imaging of response to targeted therapies,”
Pharm. Res., 24
(6), 1172
–1185
(2007). http://dx.doi.org/10.1007/s11095-007-9250-3 PHREEB 0724-8741 Google Scholar
M. RudinR. Weissleder,
“Molecular imaging in drug discovery and development,”
Nat. Rev. Drug Discov., 2
(2), 123
–131
(2003). http://dx.doi.org/10.1038/nrd1007 NRDDAG 1474-1776 Google Scholar
W. CaiX. Chen,
“Multimodality molecular imaging of tumor angiogenesis,”
J. Nucl. Med., 49
(Suppl. 2), 113S
–128S
(2008). http://dx.doi.org/10.2967/jnumed.107.045922 JNMEAQ 0161-5505 Google Scholar
F. KiesslingJ. HuppertM. Palmowski,
“Functional and molecular ultrasound imaging: concepts and contrast agents,”
Curr. Med. Chem., 16
(5), 627
–642
(2009). http://dx.doi.org/10.2174/092986709787458470 CMCHE7 0929-8673 Google Scholar
M. Palmowskiet al.,
“Molecular profiling of angiogenesis with targeted ultrasound imaging: early assessment of antiangiogenic therapy effects,”
Mol. Cancer Ther., 7
(1), 101
–109
(2008). http://dx.doi.org/10.1158/1535-7163.MCT-07-0409 MCTOCF 1535-7163 Google Scholar
G. Korpantyet al.,
“Monitoring response to anticancer therapy by targeting microbubbles to tumor vasculature,”
Clin. Cancer Res., 13
(1), 323
–330
(2007). http://dx.doi.org/10.1158/1078-0432.CCR-06-1313 CCREF4 1078-0432 Google Scholar
B. H. Yuan,
“Ultrasound-modulated fluorescence based on a fluorophore-quencher-labeled microbubble system,”
J. Biomed. Opt., 14
(2), 024043
(2009). http://dx.doi.org/10.1117/1.3120493 JBOPFO 1083-3668 Google Scholar
R. F. ChenJ. R. Knutson,
“Mechanism of fluorescence concentration quenching of carboxyfluorescein in liposomes - energy-transfer to nonfluorescent dimers,”
Anal. Biochem., 172
(1), 61
–77
(1988). http://dx.doi.org/10.1016/0003-2697(88)90412-5 ANBCA2 0003-2697 Google Scholar
S. Hamannet al.,
“Measurement of cell volume changes by fluorescence self-quenching,”
J. Fluoresc., 12
(2), 139
–145
(2002). http://dx.doi.org/10.1023/A:1016832027325 JOFLEN 1053-0509 Google Scholar
X. W. Zhuanget al.,
“Fluorescence quenching: a tool for single-molecule protein-folding study,”
Proc. Natl. Acad. Sci. U. S. A., 97
(26), 14241
–14244
(2000). http://dx.doi.org/10.1073/pnas.97.26.14241 PNASA6 0027-8424 Google Scholar
P. B. Tarsaet al.,
“Detecting force-induced molecular transitions with fluorescence resonant energy transfer,”
Angew Chem. Int. Ed. Engl., 46
(12), 1999
–2001
(2007). http://dx.doi.org/10.1002/(ISSN)1521-3773 ACIEF5 1433-7851 Google Scholar
S. IbsenC. E. SchuttS. Esener,
“Microbubble-mediated ultrasound therapy: a review of its potential in cancer treatment,”
Drug Des. Dev. Ther., 7 375
–388
(2013). http://dx.doi.org/10.2147/DDDT DDDTAQ 1177-8881 Google Scholar
J. A. Feshitanet al.,
“Theranostic Gd(III)-lipid microbubbles for MRI-guided focused ultrasound surgery,”
Biomaterials, 33
(1), 247
–255
(2012). http://dx.doi.org/10.1016/j.biomaterials.2011.09.026 BIMADU 0142-9612 Google Scholar
Y. LiuB. H. Yuan,
“An optical system for detecting 3D high-speed oscillation of a single ultrasound microbubble,”
Biomed. Opt. Express, 4
(9), 1559
–1570
(2013). http://dx.doi.org/10.1364/BOE.4.001559 BOEICL 2156-7085 Google Scholar
C. F. Caskeyet al.,
“Direct observations of ultrasound microbubble contrast agent interaction with the microvessel wall,”
J. Acoust. Soc. Am., 122
(2), 1191
–1200
(2007). http://dx.doi.org/10.1121/1.2747204 JASMAN 0001-4966 Google Scholar
L. Johanssonet al.,
“Surface acoustic wave induced particle manipulation in a PDMS channel-principle concepts for continuous flow applications,”
Biomed. Microdevices, 14
(2), 279
–289
(2012). http://dx.doi.org/10.1007/s10544-011-9606-7 BMICFC 1387-2176 Google Scholar
C. F. Caskeyet al.,
“Microbubble oscillation in tubes with diameters of 12, 25, and 195 microns,”
Appl. Phys. Lett., 88
(3), 033902
(2006). http://dx.doi.org/10.1063/1.2164392 APPLAB 0003-6951 Google Scholar
H. R. Zhenget al.,
“Ultrasound-driven microbubble oscillation and translation within small phantom vessels,”
Ultrasound Med. Biol., 33
(12), 1978
–1987
(2007). http://dx.doi.org/10.1016/j.ultrasmedbio.2007.06.007 USMBA3 0301-5629 Google Scholar
S. P. QinD. E. KruseK. W. Ferrara,
“Transmitted ultrasound pressure variation in micro blood vessel phantoms,”
Ultrasound Med. Biol., 34
(6), 1014
–1020
(2008). http://dx.doi.org/10.1016/j.ultrasmedbio.2007.11.021 USMBA3 0301-5629 Google Scholar
C. R. Andersonet al.,
“Ultrasound molecular imaging of tumor angiogenesis with an integrin targeted microbubble contrast agent,”
Invest. Radiol., 46
(4), 215
–224
(2011). http://dx.doi.org/10.1097/RLI.0b013e3182034fed INVRAV 0020-9996 Google Scholar
J. M. Warramet al.,
“A triple-targeted ultrasound contrast agent provides improved localization to tumor vasculature,”
J. Ultrasound Med., 30
(7), 921
–931
(2011). JUMEDA 0278-4297 Google Scholar
L. L. Zhanget al.,
“Multifunctional microbubbles for image-guided antivascular endothelial growth factor therapy,”
J. Biomed. Opt., 15
(3), 030515
(2010). http://dx.doi.org/10.1117/1.3457669 JBOPFO 1083-3668 Google Scholar
BiographyYuan Liu received her BS degree from the Huazhong University of Science and Technology, Wuhan, China, in 2008 and MS degree from the Catholic University of America, Washington, DC, USA, in 2010. She is currently working toward a PhD degree in bioengineering at the University of Texas at Arlington, Texas, USA. Since 2010, she has been a research assistant in the Ultrasound and Optical Imaging Laboratory, the University of Texas at Arlington. Her research interests include developing ultrasound-mediated fluorescence imaging techniques and microbubble-based contrast agents for early cancer detection. Jameel A. Feshitan received his BS degree from the University of Missouri, Columbia, in 2007 and a PhD degree from Columbia University, New York, in 2012, both in chemical engineering. He completed postdoctoral research at University of Colorado, Boulder, Colorado where he developed oxygen microbubbles to treat acute respiratory failure caused by severe lung injury. In 2014, he founded the Biotech company Advanced Microbubbles Laboratories, which develops microbubble ultrasound contrast agents for research use. Ming-Yuan Wei received his PhD degree in environment science from the Chinese Academy of Science in 2009. He worked as a postdoctoral research associate in West Virginia University, and then in the Department of Bioengineering, University of Texas at Arlington. His current research interests include the development of contrast agents for ultrasound-switchable fluorescence imaging with thermoresponsive polymer or nanoparticles and environment-sensitive fluorophores. Mark A. Borden received his PhD in chemical engineering from the University of California Davis in 2003. He is currently an associate professor of mechanical engineering at the University of Colorado, Boulder. His research focus is the physicochemical microbubbles and their applications in biomedical imaging, drug delivery and oxygenation. Baohong Yuan received his PhD degree in biomedical engineering from the University of Connecticut, Storrs, Connecticut, USA, in 2006. He is currently an associate professor of biomedical engineering at the University of Texas at Arlington, Arlington, Texas, USA. His research interest is to explore and develop new imaging technology, including contrast agents and instruments, for understanding cancer mechanisms, early detecting and diagnosing cancers, and monitoring cancer treatment efficiency. |