|
|
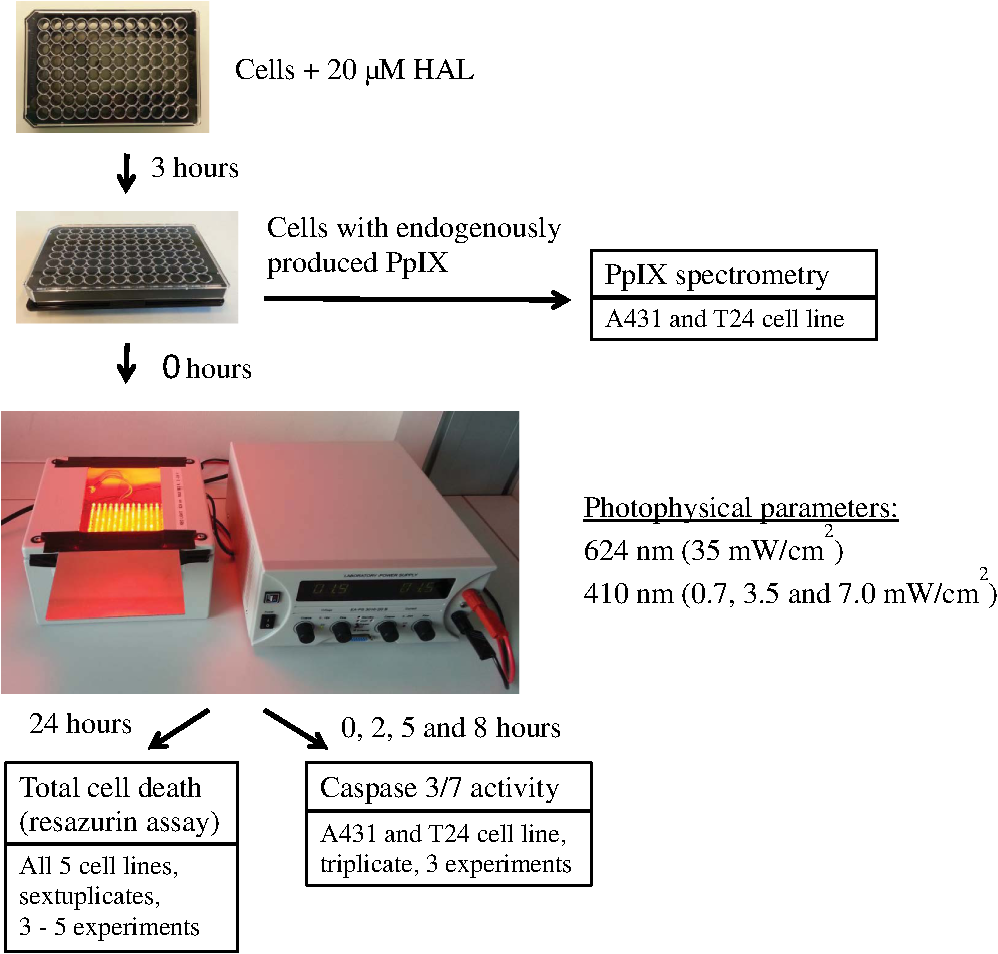
1.IntroductionPresently, 5-aminolevulinate (ALA) and two of its derivatives [methyl 5-aminolevulinate and hexyl 5-aminolevulinate (HAL)] are in routine clinical use as photosensitizer precursors in photodynamic therapy (PDT) and photodiagnosis.1,2 HAL shows improved tissue penetration3–5 and cellular uptake6–8 compared to ALA. Following conversion of HAL to ALA by cellular esterases, the molecule enters the heme synthesis pathway and induces increased intracellular levels of the photosensitizer protoporphyrin IX (PpIX), the direct precursor of heme. PpIX features a typical absorption spectrum for porphyrins with a high Soret peak around 410 nm and Q-bands in the green and red wavelength ranges.9 For PDT or photodiagnosis based on ALA or its esters, both blue and red light lamps are used. Red light offers the advantage of deeper penetration into tissue (about 6 mm).2,10–12 By contrast, blue light penetrates only about 1 mm into tissue,13 but has much higher efficiency for PpIX activation. Protocols for PDT treatment in research and in the clinic vary widely, probably at least in part because there is no strong scientific basis for choosing one protocol over another. A solution to this problem will require comparative analyses of biological effects of different photophysical parameters, such as light wavelength, irradiance, and total dose. In addition, general conclusions can only be made by analyzing the effects of the same protocol applied to different tissues and cancer cells. While treatment by chemotherapy and radiation largely kill cells by apoptosis, apparently PDT may work through apoptosis, necrosis, autophagy, and even mitotic catastrophe.2,14–18 In general, the death mode may depend on several factors, including cell-specific properties, type of photosensitizer, light wavelength, total light dose, and irradiance.17,19–21 Interestingly, the irradiance also modulates immunological responses which are likely to affect treatment outcome. Thus, high irradiance was found to be immunosuppressive, whereas a similar total dose administered using lower irradiance was not immunosuppressive.22 In the present study, we have used five different human cancer cell lines and compared the overall PDT efficiency when using HAL-induced PpIX as photosensitizer activated by light of either 410 or 624 nm. We observed substantial differences among the cell types in their sensitivities to light. More importantly, the death mode, here measured as apoptosis, was not only influenced by the light source and total light dose but also by irradiance. From a perspective of treatment efficacy, our results may contribute to a better fundament for understanding the biological effects of the photophysical parameters in PDT. 2.Materials and Methods2.1.Cell LinesFive human cancer cell lines were used in this study, all of them representative of a cancer type suitable for clinical HAL-PDT. The cell line A431 (ATCC CRL‐1555) is an epidermoid carcinoma and serves as a model system for skin cancer. The A549 cell line (ATCC CCL-185) is a lung carcinoma and HeLa S3 (ATCC CCL-2.2) is a cervical adenocarcinoma. WiDr (ATCC CCL-218) is a colorectal adenocarcinoma and T24 (ATCC HTB-4) is a transitional cell carcinoma from urinary bladder. 2.2.Light SourcesTo obtain a homogenous light field at appropriate wavelengths and within a range of irradiance values, light sources based on a light emitting diode (LED) array were used for this study.23 Each lamp consists of an array containing 247 ( diodes, 624 nm, illumination field ) or 260 ( diodes, 410 nm, illumination field ) LEDs (Roithner LaserTechnik, Vienna, Austria) connected in parallel. The irradiance of these LEDs is adjusted by the current applied as described by Pieslinger et al.23 The assembly of the LEDs and the distance from the LEDs to the illumination field are optimized to achieve a homogenous light field (maximal variation 10%). The LED light source for blue light illumination (LED type VL410-5-15, dominant wavelength 410 nm, spectral half-wave width 18 nm) allows for irradiance values up to , and the red light illumination source (LED type R5CA5111P, dominant wavelength 624 nm, spectral half-wave width 20 nm) delivers up to . The emittance spectra can be found in Ref. 24 and the light viewing angle is 15 deg. Irradiance was measured in a grid pattern (covering the whole light field) by an LI-189 light meter equipped with a PY pyranometer detector (LI-COR, Lincoln, Nebraska, diameter 7.5 mm) and a LabMaster Ultima laser measurement system with a vis-sensor (Coherent Inc., Wilsonville, California, diameter 8 mm). Both light meters had a typical accuracy of for the total system. The light transmission of the microplates used is reported to be close to 100% at wavelengths according to information from the manufacturer. The transmission spectrum should, therefore, be close to that of the lamp itself. 2.3.Cell CultureAll growth media were supplemented with 10% (v/v) fetal bovine serum, 2 mM l-glutamine, streptomycin, amphothericin B (), and 10 mM 4-(2-hydroxyethyl)-1-piperazineethanesulfonic acid (HEPES), all obtained from Sigma (Oslo, Norway). For culture of T24 and A431, 1-mM Na pyruvate (BioWhittaker, Lonza, Belgium) was also added to the media. All cell lines used Dulbecco's modified eagle medium (DMEM) as a basic medium except for WiDr cells which were cultured in RPMI 1640 medium. Subcultivation was done by rinsing the cells twice with phosphate buffered saline (PBS) (37°C) before detachment by trypsinization. For all experiments, cells were seeded in appropriate cell culture dishes the day before treatment. Cell numbers (total, live, and dead) were determined by using the Countess™ system (Invitrogen™, Oslo, Norway) and the number of live cells was used for calculating the seeding. 2.4.Hexyl 5-Aminolevulinate Photodynamic TherapyA stock solution of 10 mM HAL dissolved in PBS (adjusted to pH 6.0) was freshly prepared on the day of the experiment and sterilized by filtration ( filter). The growth medium was carefully removed from the dishes and replaced by medium without serum containing HAL. After 3 h of incubation (dark conditions, 37°C, 5% , humidified atmosphere), the HAL medium was replaced by growth medium without HAL (with serum). The samples were illuminated from below using either of the LED arrays described above immediately after HAL removal and were subsequently placed in the incubator until further processing. All experimental steps after adding of HAL to the cells were done under subdued light conditions. 2.5.Dose-ResponseCells were seeded (1 day before treatment) in 96-well cell culture microplates (black walls, clear bottom, Optilux, Falcon, VWR, Norway, see picture in Fig. 1) at the following densities, resulting in 50% to 60% confluency at the day of treatment: A431: 10,000 cells/well, A549: 10,000 cells/well, HeLa S3: 11,000 cells/well, T24: 9000 cells/well and WiDr: 11,000 cells/well. The standard filling volume was . Six wells in each row contained cells while the outer ones only contained medium to minimize evaporation. Every experiment was accompanied by a “control” [no Photosensitizer (PS), no light], a “light-only” sample (no PS, maximal light dose), and a “HAL-only” sample (PS, kept in the dark). Please notice that all doses and controls necessary for the one dose–response curve were on the same microplate to ensure identical conditions except those of the varied photophysical parameters. 2.6.Resazurin AssayThe resazurin assay is based on the conversion of the nonfluorescent resazurin to the fluorescing resorufin in viable cells. Approximately 22 h after illumination, 20-μl resazurin (2.5 mM, Sigma) was added into each well and incubated for 2 h in the dark incubator. Subsequently, resorufin fluorescence was determined using a microplate reader (BMG Labtech FluoStar Omega, Oslo, Norway, excitation wavelength 544 nm, emission wavelength 590 nm). 2.7.PpIX Absorbance and EmissionApproximately 95% confluent cell culture bottles of T24 and A431 cells were incubated with HAL for 3 h. Cells were then rinsed once with PBS (37°C) and 5 ml of accutase (Sigma) was added. After a few minutes in the incubator, the detached cells were transferred into tubes. From each cell suspension, were taken for cell counting by Bürker chamber. The suspensions were then centrifuged at 450 g (4°C, 5 min). The supernatants were removed and the pellets were resuspended in PBS to a final concentration of . All samples were kept on ice until spectra were read using a Fluorolog III fluorometer (Jobin Yvon-Spex, Horiba Group, Kjeller, Norway). For the fluorescence-excitation spectra, an LP700 filter was placed in front of the detector, the excitation slit was 3 nm, and the emission slit was 4 nm. Fluorescence emission was measured at 710 nm and excitation was performed in 1-nm steps from 350 to 700 nm in a signal/reference mode to make it comparable to absorption spectra. Emission spectra (550 to 750 nm, 1-nm step width) were excited at 405 nm with an excitation slit at 4 nm and an emission slit at 3 nm. 2.8.Caspase 3/7 ActivityThe lethal dose (LD) values as determined from the dose–response curves for A431 and T24 cells in Figs. 2 and 3 were used for this part of the study. For determination of the caspase activity, cells were seeded the day before treatment in Optilux-microplates (cell density: 9000/well for T24 10,000/well for A431). HAL-PDT was done as described above, but the cells were covered with only medium (with serum) per well after illumination. At 0, 2, 5, and 8 h post illumination, a microplate was allowed to equilibrate to room temperature before of Caspase-Glo® 3/7 Reagent (Promega, Oslo, Norway, room temperature, in accordance with the manufacturers’ protocol) was added to each well. The samples were mixed on a plate-shaker at 500 rpm for about 30 s and were subsequently incubated at room temperature for 1 h before luminescence was measured in the plate reader (BMG Labtech FluoStar Omega). Fig. 2Dose–response curves for five human cancer cell lines treated with blue light (410 nm) HAL-PDT (, 3 h, serum free). Three different irradiance values (0.7, 3.5 and ) were used for all cell lines. Cell viability is relative to an untreated control in the same microplate (no HAL, no light) and the point is the “HAL no light” value. Each point is the average of two to five experiments (each in sextuplicate) with standard error of the mean (SEM) indicated by error bars.  Fig. 3Dose–response curves for five human cancer cell lines treated with red light (624 nm) HAL-PDT (, 3 h). In (a) all five cell lines were illuminated at and in (b) A431 cells were illuminated with in addition (, small SEMs on error bars). Cell viability is relative to an untreated control in the same microplate (no HAL, no light) and the point is the “HAL no light” value. Each point in (a) is the average of two to five experiments (each in sextuplicate) with standard error of the mean (SEM) indicated by error bars.  2.9.Calculations and StatisticsAll calculations for LD values are based on Figs. 2 and 3. The LD’s are simply read out, such as equals the dose needed to obtain 25% cell death, equals the dose needed to obtain 50% cell death and so on. Unfortunately, the exact same doses were not used for all experiments. This made it difficult to make a statistical comparison between the curves in Figs. 2 and 3. The reason that doses were sometimes slightly altered between the independent experiments was to improve the measurement points in order to show the expected sigmoidal shape of the curve. Normally one expects an experimental error of 10% to 15% in MTT and resazurin assays. For calculating the mean and standard error of the means (SEMs) in Figs. 2 and 3, the values from sextuplicate measurements in all three to five biological replicates were added together and used to calculate mean values and SEMs. 3.Results3.1.Dose–Response Curves of Five Human Cancer Cell Lines after Blue Light HAL-PDTTo address the question of whether the cytotoxicity of blue light illumination of HAL-induced PpIX (abbreviated as is dependent only on total light dose or on total light dose and irradiance, we measured dose–response curves of five human cancer cell lines using three different irradiance values (0.7, 3.5 or ) under otherwise identical PDT procedures. As shown in Fig. 2, the overall light dose required to kill close to 100% of the cells varies from 0.2 to , depending on the cell line. The most sensitive cell line is A431 both in terms of the irradiance and light dose required for complete cell killing, whereas the other cell lines are substantially more resistant. The shape of the dose–response curves differs among the different cell lines. The viability of T24 cells drops rapidly with increasing light dose, while the dose–response curve for HeLa S3 cells has a slight slope (depending on the irradiance) with a near complete cell kill at . WiDr displays a notable similarity to T24 cells regarding curve characteristics, excluding the HAL-only measurement. Unexpectedly, a less steep dose–response curve was observed when using a lower irradiance () compared to a 10-fold higher irradiance (). This was observed for all five cell lines. The dark toxicity of HAL varied from 35% (A549) to negligible (A431, T24). Blue light illumination without PS using the maximal light dose resulted in up to 40% cell death for A549 cells, and almost no cell killing for A431 and WiDr cells. Hyperthermia from illumination could potentially cause some of the differences between high and low irradiance. However, the temperature in growth medium did not change measurably for 410 nm (, 30 min) illumination and increased only 2 deg for 624 nm (, 30 min), data not shown. Since illumination is carried out at room temperature, the cells will consequently not be exposed to hyperthermia during the PDT protocols employed. 3.2.Dose–Response Curves of Five Human Cancer Cell Lines after Red Light HAL-PDTRed light is commonly used for ALA-based PDT in the clinic. As a result of PpIX’s low absorption of red light compared to blue light and the irradiance range of the lamp, only the highest lamp output irradiance () was used for red light HAL-PDT (). An exception is the A431 cells which required the lowest light doses. Therefore it was possible to establish a dose–response curve for illumination as well. For an irradiance of , the illumination time required to achieve near complete cell destruction was below 30 min for all cell lines tested. Except for irradiance and wavelength, the PDT parameters were identical to those in the experiments. Dose–response curves for all five cell lines after are presented in Fig. 3(a). Similar to the dose–response curves for , the dose–response curves of the individual cell lines to differ in both shape and the light doses needed to achieve close to 100% cell killing. The required light doses for near complete cell kill varied from for A431 to for WiDr and A549. Interestingly, the order of sensitivity of the cell lines to PDT estimated from values ( ) is comparable for and . Furthermore, A549 cells showed a biphasic response to (and not a biphasic response to ): a rapid drop in viability below is followed by a plateau up to . At an even higher light dose (), the viability of A549 cells drops to nearly zero. For the cell line with highest sensitivity to , A431, the influence of irradiance on the overall cytotoxicity was tested. The results from this experiment are presented again in Fig. 3(b), where lower irradiance () results in less efficient cell destruction for intermediate doses when compared to the fivefold higher irradiance (). As expected, the dark toxicity of HAL in these experiments was about the same as in the experiments. Furthermore, red light illumination without PS using the maximal light dose for each cell line induced no cell death within the experimental error, except for A549, which showed about a 30% drop in viability. To make comparison between the different cell lines and photophysical parameters easier, we have assembled the values from Figs. 2 and 3 in Table 1. We have tabulated the values resulting in 25%, 50%, 75%, and 90% cell death, for , , , and , respectively. Since the slope of the dose–response curves is very flat when approaching 100% cell death, the definition of is somewhat subjective, and we chose to use the term “” instead. At , close to 100% of the cells were dead in all experiments when measured by resazurin assay and there were no signs of viability on visual inspection of the cells. Table 1Calculated LD values based on Fig. 2 and Fig. 3, LD values are given in J/cm2. In the upper part of the table, LD values for HAL-PDT410 are presented and the corresponding LD-values for HAL-PDT624 are presented in the lower part of the table. For a few measurements, the dark toxicity was too high to make a LD25-calculation, the missing values are denoted “–”.
3.3.Spectra of Intracellular HAL-Induced PpIXIn order to identify PpIX and possible its derivatives by spectroscopy, fluorescence excitation [Fig. 4(a)] and emission spectra [Fig. 4(b)] of HAL-induced intracellular PS were recorded in A431 and T24 cells. Fig. 4Spectra of intracellular HAL-induced (, 3 h) PpIX and possible derivatives thereof in A431 and T24 cells (). The spectra from untreated cells are subtracted from the presented PpIX spectra. (a) Fluorescence at 710 nm was measured for excitation wavelengths from 350 to 700 nm at 1 nm steps in signal/reference mode, making the spectra equivalent to absorption spectra. (b) Cells were excited at 410 nm and emission measured at 1 nm steps from 550 to 750 nm.  A431 and T24 were chosen as models for a PDT sensitive and a more resistant cell line, respectively. A431 is the most sensitive to HAL-PDT of all tested cell lines for both blue and red light illumination, while T24 is one of the most resistant cell lines when one compares doses required to achieve close to 100% cell killing. Both fluorescence excitation and emission spectra of untreated cells were measured (negligible values) and subtracted from the spectra measured from the incubated cells [Figs. 4(a) and 4(b)]. For both cell lines, the Soret peak is clearly visible at 410 nm and the maximum of the Q-band in the red wavelength range is close to 633 nm under the conditions used [Fig. 4(a)]. The ratio of the fluorescence excitation peaks (equivalent to absorption peaks) at 410 and 633 nm between the two cell lines A431 and T24 is 0.6 (T24:A431). At 624 nm, the red light fluorescence excitation peak has dropped to 55% from its maximum at 633 nm. Therefore, the overall illumination period could be reduced by roughly one half if a light source with a maximum at 633 nm was used for illumination instead of the 624 nm as used in the present experiments. The ratio between the peak heights of 410 and 624 nm is 56.3 for A431 and 56.4 for T24 cells, under the conditions used in this study [Fig. 4(a)]. T24 cells had lower fluorescence emission than A431 cells [Fig. 4(b)]. Red light fluorescence emission peaks at 636 nm for both cell lines, while a smaller maximum was determined at 706 nm. For both peaks, the overall fluorescence from T24 cells is about half of the fluorescence value from A431 cells. 3.4.Caspase 3/7 Activity in A431 and T24 Cells Induced by HAL-PDT410 and HAL-PDT624To test whether different illumination parameters influence apoptosis induction in A431 and T24 cells, caspase 3/7 activity was measured at 2, 5 and 8 h post HAL-PDT. These time points were chosen according to the results of a pilot study. Caspase 3/7 activity is considered a hallmark of apoptosis. Both cell lines were selected due to their property to show the full apoptotic phenotype, clear caspase induction, and comparable susceptibility toward HAL-PDT [see Figs. 2 and 3(a)]. A431 and T24 cells were again used to represent sensitive and more resistant cell lines to HAL-PDT, respectively. All LD values in this study are based on interpolated data from Figs. 2 and 3, therefore, biological and technical variations in these experiments are carried on into the LD values. In addition, the caspase measurements were first done based on the LD values from one dose-response experiment. The light doses were kept fixed in all three independent experiments, but it turned out after all dose-response experiments were done for Figs. 2 and 3 that the light doses used to obtain the bars in Figs. 5 and 6 did not result in identical LD values for all different photophysical parameters. As a result, the doses are assembled in subranges in Figs. 5 and 6. All values shown in Figs. 5 and 6 are relative to an untreated control (no light, no PS) set as 100%. Fig. 5Caspase 3/7 activity of A431 and T24 cells following HAL-PDT with 410-nm light and (a) and (b) . Values are related to an untreated control, set as 100%. Caspase 3/7 activity was measured for different light doses at 2, 5, and 8 h after completed illumination. Bars represent averages from three independent experiments with triplicates in each experiment and SEMs are indicated.  Fig. 6Caspase 3/7 activity in A431 and T24 cells following HAL-PDT with 624 nm light at . Values are related to an untreated control, set as 100%. Caspase 3/7 activity was measured for different light doses at 2, 5, and 8 h after completed illumination. Bars represent averages from three independent experiments with triplicates in each experiment and SEMs are indicated.  3.4.1.HAL-PDT410In order to determine the effect of varying irradiance, was performed using irradiance values of either 0. [Fig. 5(a)] or [Fig. 5(b)]. In Fig. 5(a), a low dose corresponds to about , a sub-low to , a sub-full to , and a full dose close to 100% cell death. In Fig. 5(b), the variance in the dose ranges is somewhat larger: the low dose corresponds to about (A431) and (T24), the sub-low to (A431) and (T24), the sub-full to , and the full dose close to 100% cell death. Among the light doses tested, sub-full doses generally induced the highest caspase 3/7 activity in A431 cells at all three time points for both irradiance values. The results are similar for T24 cells but the less pronounced and for the lowest irradiance for the sub-low doses seem to induce the highest caspase 3/7 activity. Furthermore, caspase 3/7 activity increases with increasing time post HAL-PDT in the time range tested. A431 generally shows higher caspase 3/7 activity when compared to T24. 3.4.2.HAL-PDT624In Fig. 6, a low dose corresponds to about (A431) and (T24), a sub-low to (A431) and (T24), a sub-full to (A431) and (T24), and a full dose close to 100% cell death. Following red light illumination, T24 cells show almost no increased caspase 3/7 activity for any of the light doses and time points tested in this study (Fig. 6). Only a marginal increase was observed at 5 and 8 h for sub-low and sub-full doses. By contrast, A431 displayed increasing caspase 3/7 activity with increasing light doses at 5 and 8 h post . Interestingly, when comparing to , the most pronounced differences of caspase 3/7 activity are that (i) blue light induces the highest activity at sub-full doses (except for T24 ) but red light does so at full doses (except for T24 which showed only minor caspase 3/7 activity after ) and (ii) blue light induces a maximum threefold increase in the activity when compared to untreated controls while red light induces a maximum fourfold increase. 4.DiscussionAlthough the basic principle of PDT is simple, a number of physical, chemical and biological parameters may influence its efficacy. Different light sources with diverse characteristics are used both in research and in clinical applications.25,26 By altering the illumination period, different irradiance values can be used to deposit one specific light dose. However, the tumor response may not solely depend on the light dose but may also depend on the irradiance. In clinical application, lower irradiances turned out to be more effective than higher ones (above a specific threshold) due to a limitation of the (tissue) oxygen supply.27–30 This effect is assumed not to be the case for in vitro experiments, where the oxygen supply is much better than in tissues. In HAL-PDT, the effective photosensitizer is endogenous PpIX, which has its largest absorption around 410 nm and a smaller peak of absorption around 630 nm. Red light is commonly used in PDT due to its longer penetration depth in tissue. In the present study, all cells were monolayer cells and were irradiated from below. Hence, scattering, depth of penetration, and cell density would not make a large impact on light delivery. The significance of these parameters is, however, of great importance in clinical treatment. In a study from 2011, the efficacies of different light sources used in the clinic to activate PpIX were compared and demonstrated that blue light sources were the most efficient.31 Blue light was also used successfully in several dermatological conditions.32–35 We have used two in-house made lamps to examine whether there is a difference in the outcome of HAL-PDT with red and blue light and after illumination with different irradiances in five different human cancer cell lines. The following discussion is divided into three main topics: irradiance and wavelength, cell-line specific response, and apoptosis induction. 4.1.Irradiance and WavelengthInterestingly, our cell survival studies indicate that when using blue light and identical total light doses, high irradiance is more efficient in cell killing than low irradiance. This tendency is most strongly pronounced for A431 and HeLa S3 cells. In addition, at least for A431 cells, high irradiance red light induces a higher cytotoxicity than low irradiance at an identical total light dose. This observation may be (at least partially) ascribed to the counteracting effect of the cellular reactive oxygen species (ROS) defense systems, which have been shown to antagonize PDT when fractionated illumination is applied.36 It seems likely that during longer illumination at lower irradiance, the ROS defense may have sufficient capacity to partially detoxify the PDT-induced oxidants. By contrast, high-irradiance PDT might overwhelm the antioxidative mechanisms. The absorption ratios between 410 and 624 nm were for both cell lines, A431 and T24 [Fig. 4(a)]. This generally correlates quite well with killing efficiencies (Table 1), although there is some variation at different LD values. Wavelength-dependent light absorption by PpIX is probably a major parameter in PDT, but probably not the only one. Other factors likely to contribute are ROS detoxification, such as superoxide dismutase, as well as DNA repair and autophagy. A difference in killing dependent on irradiance but with a constant dose has also been studied when using another sensitizer. Thus, a photofrin II PDT study on A549 cells demonstrated lower efficacy at lower irradiance values.37 Although a lower irradiance may reduce killing in PDT treatment, that reduction might then to some extent be compensated by an improved oxygenation.38 4.2.Cell-Line Specific ResponsesEssentially, the response to PDT treatment differs notably between cell lines, both regarding sensitivity and shape of survival curves (Figs. 2 and 3). Similar observations were made by others using different cell lines and PDT protocols.39 Obviously, generation of increased amounts of PpIX is essential for efficient PDT. However, T24 has only half the amount of total PpIX when compared to A431 (Fig. 4), but is more than twice less sensitive to light (at least at wavelength 410 nm) than A431, again pointing to a complex basis for sensitivity to PDT treatment. Difference in the survival of different cell lines could possibly be explained by different intracellular distributions of PpIX. However, confocal microscopy of HAL-incubated cells (, 3 h) co-stained with MitoTracker Green performed in this study indicated that PpIX is mainly localized in mitochondria in all cell lines used here. After another hour of HAL-incubation, some PpIX is redistributed to the cell membrane, without notable differences between the cell lines (data not shown). To explore the basis for the different sensitivities would require substantial efforts beyond the scope of the present paper, but it is likely that cell-specific differences in response of cancer cell lines also apply to tumors. 4.3.Apoptosis InductionApoptosis and necrosis are two major modes of cell death. We have specifically examined apoptosis and have assigned cell death that was not clearly apoptotic to most likely be necrotic. We consequently assume that the difference between the resazurin results and the caspase 3/7 activity measurements is caused by necrosis. However, there are additional mechanisms of cell death, including mitotic catastrophe and autophagy, both of which may, in fact, have a role in PDT.21,40 The cell death mode apparently may depend both on the type of sensitizer and properties of the cells being treated. Apoptosis and mitotic catastrophe have some common and some unique properties.41,42 PDT was shown to trigger immune suppression at high irradiances but immune stimulation at low irradiances in normal skin.22 This is interesting from the perspective of different death modes observed at high and low irradiance in our study. Stimulation of antitumor immunity after PDT is recognized, but the details/trigger mechanisms are still discussed.43–46 Exploration of the effect of different illumination protocols on cell death mode in vitro may help in establishing a better basis for the choice of illumination parameters. To examine the influence of different illumination parameters on the cell death mode, caspase 3/7 activity was measured at 2, 5 and 8 h post-illumination. These results demonstrate that the cellular response depends on the target cells as well as illumination protocol. The most pronounced difference in caspase 3/7 activity between blue and red light PDT was that showed maximal caspase 3/7 activity at sub-full doses and maximum at full doses, which appears to be quite unique. For comparison, an ALA-PDT study on five different cell lines showed that the time course of apoptosis varied between the different cell lines and that the amount of apoptosis and necrosis varied with the cell line and dose, which is in line with the results presented in our study.47 In conclusion, the shape of the dose survival curve, the LD values, and the amount of apoptotic cells vary significantly between the different cell lines examined. When comparing blue and red light illumination, the light absorbance of the respective wavelength corresponds well to the light sensitivity of the cells. Furthermore, there has been some uncertainty as to whether one could make a direct comparison or not between studies when different wavelengths or irradiances have been used. This study shows that if one compares results between studies with either different irradiances or wavelengths, one should be especially aware of the differences at sublethal doses. AcknowledgmentsWe would like to thank Prof. Thor Bernt Melø for his contribution to Fig. 4 and fruitful discussions, the Group of applied optics and laser physics by Prof. Mikael Lindgren for support and lending of the laser measurement system, and Aloys Munyeshyaka for contributing to the pilot experiments. L. Helanders work was funded by the Functional Genomics Program of Research Council of Norway, and the Svanhild and Arne Must fund for medical research. PhotoCure has kindly provided hexyl 5-aminolevulinate powder for this study. ReferencesB. KrammerK. Plaetzer,
“ALA and its clinical impact, from bench to bedside,”
Photochem. Photobiol. Sci., 7
(3), 283
–289
(2008). http://dx.doi.org/10.1039/b712847a PPSHCB 1474-905X Google Scholar
P. Agostiniset al.,
“Photodynamic therapy of cancer: an update,”
CA Cancer J. Clin., 61
(4), 250
–281
(2011). http://dx.doi.org/10.3322/caac.20114 CAMCAM 0007-9235 Google Scholar
N. Fotinoset al.,
“5-Aminolevulinic acid derivatives in photomedicine: characteristics, application and perspectives,”
Photochem. Photobiol., 82
(4), 994
–1015
(2006). http://dx.doi.org/10.1562/2006-02-03-IR-794 PHCBAP 0031-8655 Google Scholar
N. Dognitzet al.,
“Comparison of ALA- and ALA hexyl-ester-induced PpIX depth distribution in human skin carcinoma,”
J. Photochem. Photobiol. B, 93
(3), 140
–148
(2008). http://dx.doi.org/10.1016/j.jphotobiol.2008.07.012 JPPBEG 1011-1344 Google Scholar
A. Martiet al.,
“Comparison of aminolevulinic acid and hexylester aminolevulinate induced protoporphyrin IX distribution in human bladder cancer,”
J. Urol., 170
(2 Pt 1), 428
–432
(2003). http://dx.doi.org/10.1097/01.ju.0000075054.38441.2d JOURDD 0248-0018 Google Scholar
L. Rodriguezet al.,
“Porphyrin synthesis from aminolevulinic acid esters in endothelial cells and its role in photodynamic therapy,”
J. Photochem. Photobiol. B, 96
(3), 249
–254
(2009). http://dx.doi.org/10.1016/j.jphotobiol.2009.07.001 JPPBEG 1011-1344 Google Scholar
C. Perottiet al.,
“Porphyrin synthesis from ALA derivatives for photodynamic therapy. In vitro and in vivo studies,”
Br. J. Cancer, 90
(8), 1660
–1665
(2004). http://dx.doi.org/10.1038/sj.bjc.6601722 BJCAAI 0007-0920 Google Scholar
V. ZenzenH. Zankl,
“Protoporphyrin IX-accumulation in human tumor cells following topical ALA- and h-ALA-application in vivo,”
Cancer Lett., 202
(1), 35
–42
(2003). http://dx.doi.org/10.1016/j.canlet.2003.07.001 CALEDQ 0304-3835 Google Scholar
J.-L. Soret,
“Analyse spectrale: Sur le spectre d’absorption du sang dans la partie violette et ultra-violette,”
Comptes rendus de l’Académie des sciences, 97
(2), 1269
–1270
(1883). DBANAD 0861-1459 Google Scholar
H. W. Wanget al.,
“Broadband reflectance measurements of light penetration, blood oxygenation, hemoglobin concentration, and drug concentration in human intraperitoneal tissues before and after photodynamic therapy,”
J. Biomed. Opt., 10
(1), 014004
(2005). http://dx.doi.org/10.1117/1.1854679 JBOPFO 1083-3668 Google Scholar
K. Plaetzeret al.,
“Photophysics and photochemistry of photodynamic therapy: fundamental aspects,”
Lasers Med. Sci., 24
(2), 259
–268
(2008). http://dx.doi.org/10.1007/s10103-008-0539-1 LMSCEZ 1435-604X Google Scholar
L. O. Svaasand,
“Optical dosimetry for direct and interstitial photoradiation therapy of malignant tumors,”
Prog. Clin. Biol. Res., 170 91
–114
(1984). PCBRD2 0361-7742 Google Scholar
P. Juzenaset al.,
“Noninvasive fluorescence excitation spectroscopy during application of 5-aminolevulinic acid in vivo,”
Photochem. Photobiol. Sci., 1
(10), 745
–748
(2002). http://dx.doi.org/10.1039/b203459j PPSHCB 1474-905X Google Scholar
S. H. KaufmannW. C. Earnshaw,
“Induction of apoptosis by cancer chemotherapy,”
Exp. Cell Res., 256
(1), 42
–49
(2000). http://dx.doi.org/10.1006/excr.2000.4838 ECREAL 0014-4827 Google Scholar
R. Baskaret al.,
“Cancer and radiation therapy: current advances and future directions,”
Int. J. Med. Sci., 9
(3), 193
–199
(2012). http://dx.doi.org/10.7150/ijms.3635 IJMSGZ 1449-1907 Google Scholar
M. RebucciC. Michiels,
“Molecular aspects of cancer cell resistance to chemotherapy,”
Biochem. Pharmacol., 85
(9), 1219
–1226
(2013). http://dx.doi.org/10.1016/j.bcp.2013.02.017 BCPCA6 0006-2952 Google Scholar
K. Plaetzeret al.,
“Apoptosis following photodynamic tumor therapy: induction, mechanisms and detection,”
Curr. Pharm. Des., 11
(9), 1151
–1165
(2005). http://dx.doi.org/10.2174/1381612053507648 CPDEFP 1381-6128 Google Scholar
T. Kushibikiet al.,
“Responses of cancer cells induced by photodynamic therapy,”
J. Healthcare Eng., 4
(1), 87
–108
(2013). http://dx.doi.org/10.1260/2040-2295.4.1.87 2040-2295 Google Scholar
A. C. Moor,
“Signaling pathways in cell death and survival after photodynamic therapy,”
J. Photochem. Photobiol. B, 57
(1), 1
–13
(2000). http://dx.doi.org/10.1016/S1011-1344(00)00065-8 JPPBEG 1011-1344 Google Scholar
P. Agostiniset al.,
“Regulatory pathways in photodynamic therapy induced apoptosis,”
Photochem. Photobiol. Sci., 3
(8), 721
–729
(2004). http://dx.doi.org/10.1039/b315237e PPSHCB 1474-905X Google Scholar
P. Mrozet al.,
“Cell death pathways in photodynamic therapy of cancer,”
Cancer, 3
(2), 2516
–2539
(2011). http://dx.doi.org/10.3390/cancers3022516 60IXAH 0008-543X Google Scholar
G. A. FrostG. M. HallidayD. L. Damian,
“Photodynamic therapy-induced immunosuppression in humans is prevented by reducing the rate of light delivery,”
J. Invest. Dermatol., 131
(4), 962
–968
(2011). http://dx.doi.org/10.1038/jid.2010.429 JIDEAE 0022-202X Google Scholar
P. K. Pieslingeret al.,
“Characterization of a simple and homogenous irradiation device based on light-emitting diodes: a possible low cost supplement to conventional light sources for photodynamic treatment,”
Med. Laser Appl., 21
(4), 277
–283
(2006). http://dx.doi.org/10.1016/j.mla.2006.07.004 1615-1615 Google Scholar
Roithner Lasertechnik, Vienna, Austria, ”Properties of diverse LEDs,”
(2014) http://www.roithner-laser.com/led_diverse.html July ). 2014). Google Scholar
M. A. CalinS. V. Parasca,
“Light sources for photodynamic inactivation of bacteria,”
Lasers Med. Sci., 24
(3), 453
–460
(2009). http://dx.doi.org/10.1007/s10103-008-0588-5 LMSCEZ 1435-604X Google Scholar
L. BrancaleonH. Moseley,
“Laser and non-laser light sources for photodynamic therapy,”
Lasers Med. Sci., 17
(3), 173
–186
(2002). http://dx.doi.org/10.1007/s101030200027 LMSCEZ 1435-604X Google Scholar
T. M. SitnikB. W. Henderson,
“The effect of fluence rate on tumor and normal tissue responses to photodynamic therapy,”
Photochem. Photobiol., 67
(4), 462
–466
(1998). http://dx.doi.org/10.1111/php.1998.67.issue-4 PHCBAP 0031-8655 Google Scholar
B. W. HendersonT. M. BuschJ. W. Snyder,
“Fluence rate as a modulator of PDT mechanisms,”
Lasers Surg. Med., 38
(5), 489
–493
(2006). http://dx.doi.org/10.1002/(ISSN)1096-9101 LSMEDI 0196-8092 Google Scholar
H. W. Wanget al.,
“Effect of photosensitizer dose on fluence rate responses to photodynamic therapy,”
Photochem. Photobiol., 83
(5), 1040
–1048
(2007). http://dx.doi.org/10.1111/php.2007.83.issue-5 PHCBAP 0031-8655 Google Scholar
S. Iinumaet al.,
“In vivo fluence rate and fractionation effects on tumor response and photobleaching: photodynamic therapy with two photosensitizers in an orthotopic rat tumor model,”
Cancer Res., 59
(24), 6164
–6170
(1999). CNREA8 0008-5472 Google Scholar
R. M. SayreJ. C. DowdyR. W. Gottschalk,
“Comparative effectiveness of clinically used light sources for cutaneous protoporphyrin IX-based photodynamic therapy,”
J. Cosmetic Laser Ther., 13
(2), 63
–68
(2011). http://dx.doi.org/10.3109/14764172.2011.564628 1476-4172 Google Scholar
A. F. Taub,
“Photodynamic therapy for the treatment of acne: a pilot study,”
J. Drugs Dermatol., 3
(6 Suppl), S10
–S14
(2004). JDDOBA 1545-9616 Google Scholar
S. L. MarcusW. R. McIntyre,
“Photodynamic therapy systems and applications,”
Expert Opin. Emerg. Drugs, 7
(2), 321
–334
(2002). http://dx.doi.org/10.1517/emd.2002.7.issue-2 EOEDA3 1472-8214 Google Scholar
J. E. Laneet al.,
“Unilateral Basal cell carcinomas: an unusual entity treated with photodynamic therapy,”
J. Cutan. Med. Surg., 9
(6), 336
–340
(2005). http://dx.doi.org/10.1007/s10227-005-0118-z JCMSFU 1203-4754 Google Scholar
A. M. ChapasB. A. Gilchrest,
“Broad area photodynamic therapy for treatment of multiple basal cell carcinomas in a patient with nevoid basal cell carcinoma syndrome,”
J. Drugs Dermatol., 5
(2 Suppl), 3
–5
(2006). JDDOBA 1545-9616 Google Scholar
C. B. Oberdanneret al.,
“Photodynamic treatment with fractionated light decreases production of reactive oxygen species and cytotoxicity in vitro via regeneration of glutathione,”
Photochem. Photobiol., 81
(3), 609
–613
(2005). http://dx.doi.org/10.1562/2004-08-23-RN-284.1 PHCBAP 0031-8655 Google Scholar
W. Matthewset al.,
“In vitro photodynamic therapy of human lung cancer: investigation of dose-rate effects,”
Cancer Res., 49
(7), 1718
–1721
(1989). CNREA8 0008-5472 Google Scholar
T. M. SitnikJ. A. HamptonB. W. Henderson,
“Reduction of tumour oxygenation during and after photodynamic therapy in vivo: effects of fluence rate,”
Br. J. Cancer, 77
(9), 1386
–1394
(1998). http://dx.doi.org/10.1038/bjc.1998.231 BJCAAI 0007-0920 Google Scholar
J. V. MooreC. M. L. WestC. Whitehurst,
“The biology of photodynamic therapy,”
Phys. Med. Biol., 42
(5), 913
–935
(1997). http://dx.doi.org/10.1088/0031-9155/42/5/012 PHMBA7 0031-9155 Google Scholar
S. Rello-Varonaet al.,
“Mitotic catastrophe induced in HeLa cells by photodynamic treatment with Zn(II)-phthalocyanine,”
Int. J. Oncol., 32
(6), 1189
–1196
(2008). http://dx.doi.org/10.3892/ijo_32_6_1189 IJONES 1019-6439 Google Scholar
M. Castedoet al.,
“Cell death by mitotic catastrophe: a molecular definition,”
Oncogene, 23
(16), 2825
–2837
(2004). http://dx.doi.org/10.1038/sj.onc.1207528 ONCNES 0950-9232 Google Scholar
I. Vitaleet al.,
“Mitotic catastrophe: a mechanism for avoiding genomic instability,”
Nat. Rev. Mol. Cell Biol., 12
(6), 385
–392
(2011). http://dx.doi.org/10.1038/nrm3115 NRMCBP 1471-0072 Google Scholar
P. MrozY.-Y. HuangM. R. Hamblin,
“Photodynamic therapy for cancer and activation of immune response,”
Biophotonics and Immune Responses, SPIE, San Francisco, California
(2010). Google Scholar
A. P. CastanoP. MrozM. R. Hamblin,
“Photodynamic therapy and anti-tumour immunity,”
Nat. Rev. Cancer, 6
(7), 535
–545
(2006). http://dx.doi.org/10.1038/nrc1894 NRCAC4 1474-175X Google Scholar
P. MrozM. R. Hamblin,
“The immunosuppressive side of PDT,”
Photochem. Photobiol. Sci., 10
(5), 751
–758
(2011). http://dx.doi.org/10.1039/c0pp00345j PPSHCB 1474-905X Google Scholar
A. D. Garget al.,
“Photodynamic therapy: illuminating the road from cell death towards anti-tumour immunity,”
Apoptosis, 15
(9), 1050
–1071
(2010). http://dx.doi.org/10.1007/s10495-010-0479-7 APOPFN 1360-8185 Google Scholar
L. WyldM. W. ReedN. J. Brown,
“Differential cell death response to photodynamic therapy is dependent on dose and cell type,”
Br. J. Cancer, 84
(10), 1384
–1386
(2001). http://dx.doi.org/10.1054/bjoc.2001.1795 BJCAAI 0007-0920 Google Scholar
BiographyLinda Helander received her MSc degree in Trondheim at NTNU (Norwegian University of Science and Technology) in 2004. She studied biophysics and after her degree she worked as a staff engineer within molecular biology at University of Tromsø and is currently working as head of laboratory of NTNU Nanolab and finishing her PhD within the program of molecular medicine at NTNU. Hans E. Krokan received his MD and PhD degrees in Oslo and Tromsø. He was a postdoctoral fellow at Harvard University and guest scientist at the National Cancer Institute, NIH. He is now a professor in molecular medicine at Norwegian University of Science and Technology and has authored approximately 200 scientific papers. He is an EMBO member and has been awarded prestigious national and international prizes for his research within DNA repair and cancer. Anders Johnsson received his PhD at Lund University, Sweden. He has spent research periods in USA and Germany, specializing in physics and biophysics. He is now professor em. in the Department of Physics, Norwegian University of Science and Technology, Trondheim, Norway. His research interest focuses on oscillatory physiological processes in organisms, on photobiology and PDT of bacteria, and on balance system of plants. He has authored /coauthered about 190 papers and book chapters. Odrun A. Gederaas is a senior research scientist who obtained her Dr. Philos degree in medical technology from the Norwegian University of Science and Technology, in collaboration with the University of Leiden, The Netherlands, and the Norwegian Radium Hospital in Oslo, Norway. The interdisciplinary field in photodynamic therapy has been developed during her postdoctoral fellow periods in Ohio, Irvine, Salzburg, and Lyon; together with two pharmacology companies in Oslo (Photo Cure AS and PCI Biotech AS). Kristjan Plaetzer earned his PhD and venia docendi in biophysics at the University of Salzburg, Austria. He is interested in the cell death modes induced by PDT and cellular energetics of photo-treated cells and acquired expertise in application of photodynamic procedures based on natural substances as photosensitizers against microorganisms. He is now head of the Laboratory of Photodynamic Inactivation at the University of Salzburg (PDI-PLUS). |
||||||||||||||||||||||||||||||||||||||||||||||||||||||||||||||||||||||||||||||||||||||||||||||||||||||||||||||||||||||||||||||||||||||||||||||||||||||||||||||||||||||||||||||||||||||||||||||||||||||||||||||||||||||||||||||||