
|
|
1.IntroductionThe primary function of the red blood cells (RBCs) is the transport of oxygen from the lungs to tissues, which requires diffusion of oxygen into RBCs and their binding with intracellular hemoglobin (Hb). The intracellular Hb concentration determines the maximum amount of oxygen that can diffuse into the cell. While a high concentration of Hb as found in RBCs ()1 ensures a large oxygen storage capacity, the resulting interactions between the neighboring Hb molecules strongly decrease Hb mobility. When compared with Hb in solution, the rotational and the translation diffusion coefficients for the intracellular Hb are lower by a factor of and , respectively.2–4 This reduction in Hb mobility inside the cells can lead to a reduction in the intracellular “Hb-facilitated diffusion of oxygen”5,6 and consequently the oxygen transport through the cell. It has, therefore, been hypothesized that the intracellular Hb may be ordered to facilitate the diffusion of oxygen. Indeed, studies on low-angle scattering of x-rays from RBCs7 showed some evidence of ordering of Hb. Similarly, Perutz8 has shown that the high-intracellular concentration () of Hb molecules requires some ordering of these molecules inside the RBCs. However, there are no confirmatory studies showing the ordering of Hb within the RBCs. Polarized Raman spectroscopy is a powerful technique to investigate the orientation of molecules in organized environments, such as crystal lattices, liquid crystals, and polymer samples,9–13 and thus can be useful for investigating the intracellular Hb ordering. The molecular orientation effects originating from the tensorial nature of the polarizability are reflected in the dependence of Raman bands’ intensities on the orientation of the electric field vectors of the incident and scattered light with respect to the molecular axes. Previously, some attempts14,15 have been made to understand the intracellular Hb ordering using this technique. In one of the studies,14 Raman spectra were recorded for two populations of RBCs; one having their equatorial planes normal to the beam propagation direction (population 1) and the other having their equatorial planes parallel to the beam propagation direction (population 2). These populations were observed to form spontaneously when a RBC suspension was poured onto a poly-l-lysine-coated substrate. In population 1, the RBCs had their equatorial planes parallel to the excitation beam polarization direction. However, in population 2, the equatorial planes of the RBCs could take any orientation relative to the beam polarization direction, while remaining parallel to the beam propagation direction. Hence, the mean spectrum taken over population 2 presented an averaged response taken over all possible orientations of the RBCs in the above-mentioned configuration. Although some orientation dependence of the RBC’s spectra was reported, the lack of precise control over the individual RBCs’ orientation limited the scope of this study. Raman optical tweezers16 are an attractive tool for addressing this issue. Because Raman measurements are made on a cell optically trapped in buffer media away from the substrate, the artifacts arising due to the immobilization of the cells on the substrate as well as due to the background originating from the substrate are avoided, leading to an improvement in the signal-to-noise ratio (SNR) of the Raman spectra. Dual trap tweezers have been used to simultaneously investigate two optically trapped cells to probe the dynamics and heterogeneity of interacting microbial cells17 and also to translate the trapped cell relative to the Raman excitation beam and thus acquire spatially resolved Raman spectrum18 etc. Rao et al.15 made use of a dual optical trap to orient the RBC with their equatorial planes parallel to the excitation beam polarization and to investigate the change in depolarization ratio of various Raman bands upon stretching the cells. The observed changes in the depolarization ratio were interpreted as an indication of an increase in Hb ordering inside the RBCs upon stretching. A more thorough investigation of the anisotropic response of the Raman spectrum from the trapped RBC, which would help in gaining insight into the Hb ordering inside the cell, requires that the spectrum be acquired for different orientations of the equatorial plane of the RBC with respect to the polarization direction of the Raman excitation beam. This can be done using holographic optical tweezers, where the dynamic control on the traps can be used to rotate the trapped RBC about the Raman excitation beam in real time. We report the results of a study conducted to record Raman spectra of an optically trapped RBC, where its equatorial plane was oriented at angles ranging from 0 deg to 180 deg with respect to the polarization direction of the excitation beam using a dual trap generated by holographic optical tweezers. We observed significant angular dependence for intensities of various Raman peaks. These experimental results and the theoretical simulations carried out to comprehend these results suggested that the Hb molecules within the cells may be present in an ordered arrangement, such that the heme-porphyrin planes acquire a preferential orientation parallel to the RBCs’ equatorial plane. 2.Materials and MethodsAn integrated Raman-holographic optical tweezer was used to perform polarized Raman studies on single-trapped cells. Figure 1 shows a schematic of the experimental setup. A plane-polarized diode laser XTRA, TOPTICA Photonics AG, Graefelfing (Munich), Germany at 785 nm was used as the Raman excitation beam. For all experiments, the Raman spectra were recorded with an excitation power of 2 mW and an acquisition time of 30 s. The 785-nm laser beam was reflected off of a notch filter (NF) (Semrock Inc., Rochester, New York) and coupled into the back aperture of a microscope objective [, 1.42 numerical aperture (NA), Olympus, Shinjuku-ku, Tokyo, Japan]. A back-scattered Raman signal collected by the objective was passed through the NF and a confocal pinhole and coupled onto the entrance slit of an imaging spectrometer (Shamrock SR-303i, Andor Technology Ltd., Belfast, United Kingdom). The spectrometer was equipped with a grating and coupled to a back-illuminated thermoelectrically cooled () CCD camera (iDus 401-BRDD, Andor Technology Ltd., Belfast, United Kingdom). Fig. 1(a) Schematic of the experimental setup. SLM: spatial light modulator, NF: notch filter, F: 1064-nm blocking filter, PH: pin hole, DM1 and DM2: dichroic mirrors 1 and 2, Obj: objective lens, P: polarizer, and A: analyzer. (b) A rendering showing the side view of a trapped RBC. The two holographic 1064-nm beams present near the edge of the cell trap and rotate the cell, whereas a 785-nm beam passing through the center of the cell excites the Raman spectrum. (c) An image of the trapped RBC captured by the CCD (Video 1, MPEG, 0.5 MB) [URL: http://dx.doi.org/10.1117/1.JBO.19.8.087002.1]. The red dots represent the 1064-nm beams, and the orange dot and arrow represent the Raman excitation beam and its electric field vector direction, respectively.  A holographic optical tweezer was used to control the orientation of the RBC with respect to the Raman excitation beam polarization direction. For this, an expanded and collimated 1064-nm beam was diffracted by a spatial light modulator (SLM) (PLUTO, HOLOEYE Photonics AG, Berlin-Adlershof, Germany). The SLM was used to imprint a computer-designed phase-only hologram, encoding the desired pattern of traps onto the collimated 1064-nm laser beam’s wavefront. Lenses L4 and L5 imaged the SLM plane onto the input pupil of the objective lens through a dichroic mirror DM1. A change in the displayed hologram allowed changing the trap pattern in real time. Using this setup, two traps having an intertrap separation of were generated and symmetrically placed on either side of the Raman excitation beam. Power at each of the trap beams was . It may be noted that a RBC, when trapped in dual traps having an intertrap separation less than the RBC diameter, orients itself such that its equatorial plane becomes parallel to the plane containing the dual trap beams as this maximizes its overlap with the highest intensity region of the trap beams. The RBC so trapped could be rotated in a controlled manner about the axis of the central Raman excitation beam by rotating the two trapping beams together around the Raman excitation beam. Thus, a trapped RBC could be oriented such that its equatorial plane made angles ranging from 0 deg to 180 deg, in steps of 45 deg, relative to Raman excitation beam polarization direction. Both parallel as well as perpendicular polarized measurements were made at each orientation angle. For the polarized measurement, a combination of a half-wave plate and polarizer placed before the spectrometer was used. To switch between parallel and perpendicular measurements, the half-wave plate was rotated by 45 deg. Sequential measurements were made on the two polarization components, because use of additional optics to separate the two polarization components19 for simultaneous measurements would require larger Raman excitation beam power, raising a concern for optically induced damage20 in the trapped cell. With the use of a high NA objective, induced depolarization effects are a concern.21 Therefore, we coupled the Raman excitation beam directly into the objective and did not utilize the full NA of the objective. Nevertheless to check the possible depolarization arising from the use of a high NA objective, the depolarization ratio of a chloroform line was measured using the , 1.42, and 0.4 NA objectives. With the 1.42 NA objective, the depolarization ratio of the chloroform line at was found to increase by when compared with the ratio obtained with the 0.4 NA objective. These results are consistent with the previous report,22 where an objective of NA 1.2 was used and depolarization effects were measured to be 1 to 2%. Raman spectra were recorded from the cell in the spectral range of to with a spectral resolution of about . The background was subtracted from each raw spectrum to obtain the actual cell spectrum. All Raman spectra were smoothed using Savitzky–Golay filters and the background was corrected using Lieber and Mahadevan–Jansen iterative polynomial fitting method.23 Blood was collected by venipuncture from three healthy volunteers in glass tubes containing EDTA () as an anticoagulant. RBCs were separated from these blood samples by centrifugation at 3000 rpm for 3 min, and the separated RBCs were washed twice with phosphate buffer saline (PBS) by centrifugation at 3000 rpm for 3 min. A dilute suspension of RBCs in PBS containing 2% bovine serum albumin was used in the experiments. 3.TheoryThe Raman spectrum of the RBCs is mostly contributed by the Hb molecules, the main cytoplasmic constituents of RBCs. Hb protein is an assembly of four globular protein subunits, each of which is composed of a protein chain tightly associated with a nonprotein heme group. A heme group is an iron-porphyrin complex in which an iron ion () lies in the center of a porphyrin macrocycle. Four of the six coordination sites around the iron are occupied by nitrogen atoms from the planar porphyrin ring. The fifth (axial) coordination site is occupied by a nitrogen atom from a histidine side chain on one of the amino acids in the protein. The last (axial) coordination site is available for binding with an molecule. Due to its planar and symmetric structure, the heme group has been approximated by point group symmetry in literature and its vibrational modes have been accordingly assigned.24–26 It may be noted that, due to the presence of heme charge transfer absorption band in the near-infrared region (NIR),27 some nontotally symmetric modes of symmetry are more enhanced in the NIR-excited Raman spectrum of the RBCs. Table 1 lists the band assignments, local coordinates, and symmetry terms for the prominent oxyhemoglobin Raman bands25,26 observed with 785-nm excitation. In this table, the bands to which a symmetry term is assigned are due to the porphyrin ring vibrations and the bands with which no symmetry term is associated are due to the contribution from the porphyrin peripheral substituents such as vinyl group vibrations at and as well as the contribution from the surrounding globin proteins such as the phenylalanine peak at and bending vibrations of groups at . Table 1Band positions, assignments, local coordinates, and symmetry terms for the prominent oxyhemoglobin Raman bands.25,26
To gain insight into the RBCs’ orientation-dependent changes in the Raman spectra, we consider a hypothetical RBC which is packed with Hb molecules such that the planes of all the heme groups are oriented parallel to the RBCs’ equatorial plane. Although this hypothesis is a bit crude, the experimental observations indicate that this hypothesis may serve as a helpful starting point for analyzing the experimental results. In Fig. 2, we show the chemical structure of the heme group and the set of axes used for the Raman tensors and intensity calculations. , , and are the molecular axes, and , , and are the laboratory axes. The Raman excitation beam is polarized along the -direction. The -axis is the direction of propagation of the Raman excitation beam. is the angle between the RBC equatorial plane and the Raman polarization direction. Fig. 2(a) Left: Chemical structure of a heme molecule. Right: Heme-porphyrin skeleton plane with axes in the molecular frame. (b) Left: Schematic showing the orientation angle which the equatorial plane of the trapped RBC made with the polarization direction of the Raman excitation beam. Right: Hypothetical stacking of heme-porphyrin molecules with their planes parallel to the RBCs’ equatorial plane. 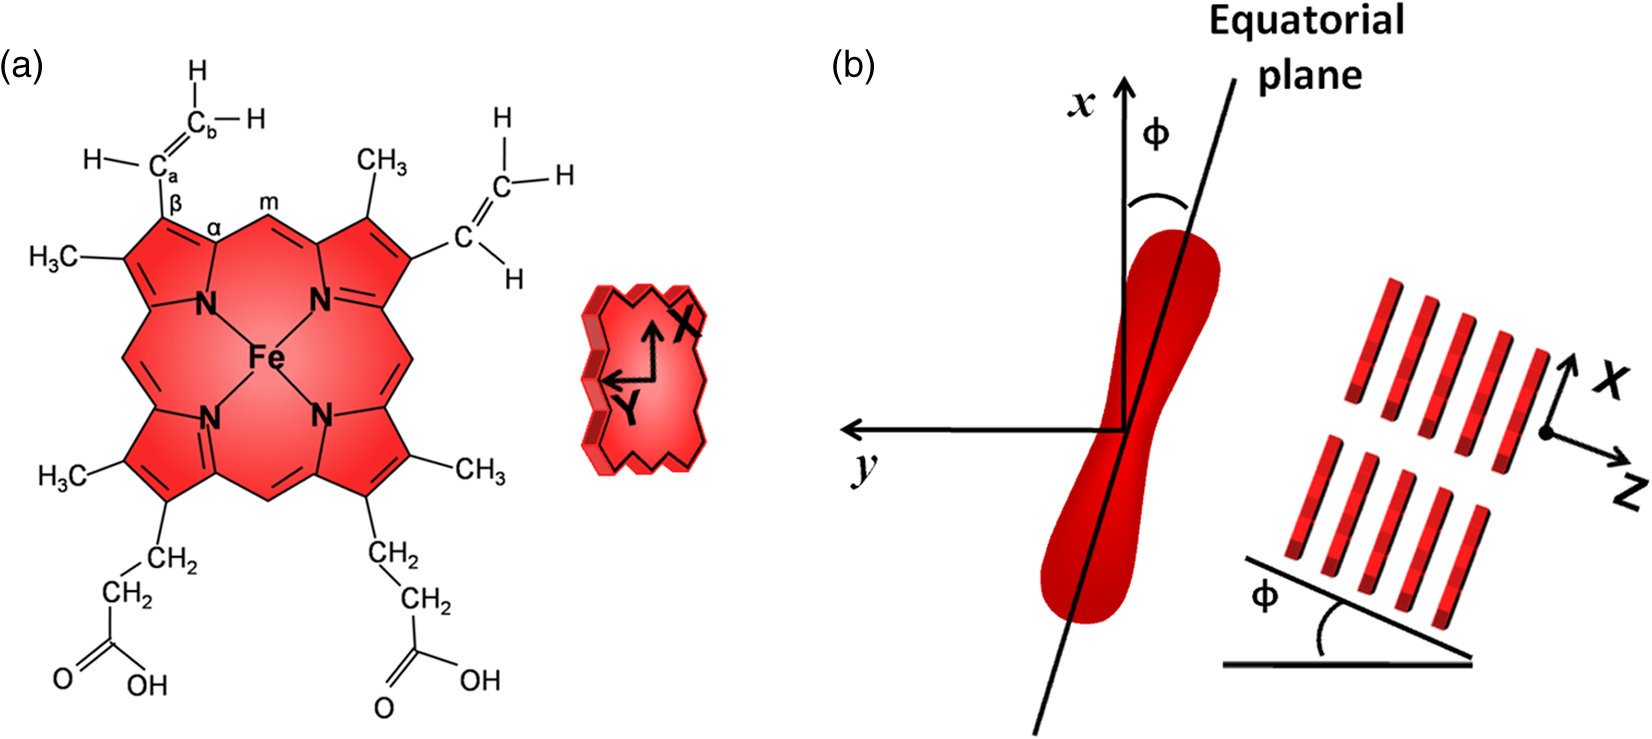 The intensity of a Raman band depends on the orientation of the molecule and the polarization geometry of the optical configuration and can be expressed as28 where and are the unit polarization vectors of the electrical field of the incident and scattered laser beams, respectively, and is the Raman scattering tensor of the particular band under consideration. In our experiment, the polarization of the incident light was fixed in the -direction and Raman scattered light polarized parallel and perpendicular to the excitation beam polarization was detected. The unit polarization vectors can then be expressed as where the superscript symbols and refer to parallel and cross configurations, respectively. is the Raman scattering tensor of the particular band under consideration. In our experimental results, the significant orientation-dependent intensity changes were observed for the bands at , 1547, 1563, and . Out of these, the bands at and belong to the symmetry and the band at belongs to the symmetry. The band at is due to stretching vibrations of the porphyrin peripheral vinyl group substituents and does not belong to the porphyrin skeleton to which the point group symmetry has been assigned. Therefore, this band, not having any symmetry assignment, is excluded from our theoretical treatment. The second rank Raman tensor for and vibrational modes of a porphyrin ring having a point group symmetry can be expressed as29These tensors are referred to the principal molecular axes , , and , as has already been defined, and can be expressed in the laboratory axes system as follows: where is an orthogonal transformation matrix, and is the inverse, with direction cosines expressed in terms of Euler’s angles. These matrices transform the Cartesian system of coordinates associated with the molecular frame into that of the laboratory frame. For our experimental geometry,From Eqs. (1)–(5), the Raman intensities pertaining to the and bands in parallel configuration can be expressed as a function of the angle as follows: Similarly, for a perpendicular configuration, The proportionality sign in Eqs. (6) and (7) arises from the dependence of the Raman intensity on the instrumental configuration used in the experimental setup. 4.ResultsA total of 60 cells (20 cells each from the three blood samples) were investigated. Figures 3(a) and 3(b) present a mean spectrum of these cells for their different orientations. The orientation angle was measured as the angle between the RBCs’ equatorial plane and the excitation beam electric field vector. It can be seen from the figures that the intensity of various bands in the spectra shows the orientation-dependent changes. The most prominent orientation-dependent intensity changes occur in the band at , which is due to the breathing vibrations of the pyrrole rings, and in the spectral region 1500 to , which arises from the C─C bonds’ vibrations in the porphyrin ring and side chains. The intensities of these bands decreased as the RBC’s orientation angle was changed from 0 deg to 45 deg and was lowest at a 90 deg orientation angle. Upon further rotation, these changes reversed and the intensity of the bands again became highest at the 180 deg orientation. The spectra at 0 deg and 180 deg were observed to be similar to each other as was expected. Further, the similarity of the spectra at the 0 deg and 180 deg orientations also ensures that the cell was not photodamaged during the course of these measurements. Fig. 3(a and b) Parallel-polarized mean Raman spectra at different orientation angles of the trapped RBCs. The shaded regions highlight the spectral region, which showed most significant orientation-dependent intensity changes. 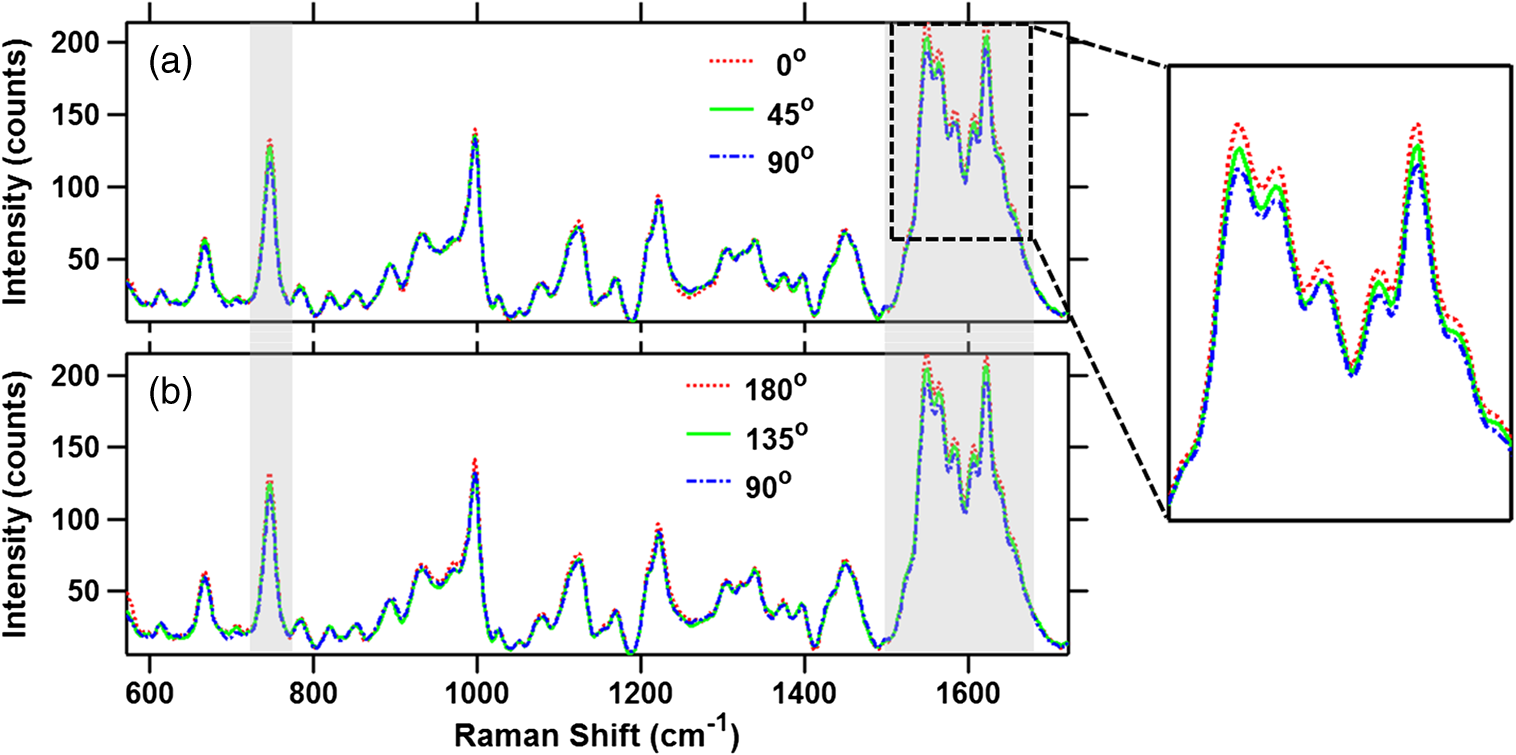 Another interesting observation was that while all the cells showed a decrease in the intensity of the above-mentioned Raman bands, a large number (39 cells, ) of the cells showed a relatively greater decrease in the intensity of the band at as compared with its adjacent band at at a 90 deg orientation. This is shown in Fig. 4, where the Raman spectrum from a representative cell exhibiting this feature is presented. The reason for the differential response of the cells may be the inherent intercell variability in the cell age, shape, and Hb concentrations and oxygenation level. Figures 5(a) and 5(b) plot the average parallel-polarized Raman spectra of these 39 cells at the different orientations, and the differences between the spectra of these 39 cells and the total 60 cells are shown in Figs. 5(c) and 5(d). It can be noted that, while in the spectra shown in Fig. 4, almost all the bands show some orientation-dependent intensity changes, the average spectra shown in Figs. 5(a) and 5(b) show the prominent orientation-dependent changes only in the spectral region 1500 to and in the band at . The absence of the orientation-dependent changes in the relatively weaker bands may be due to their poor SNR not allowing inferring any reliable information from these bands. Fig. 4Parallel-polarized Raman spectra from a representative cell for its different orientations. The shaded region highlights that the band at exhibits relatively more decrease in the intensity as compared with its adjacent band at when the cell was rotated by 90 deg.  Fig. 5(a and b) Parallel-polarized mean Raman spectra of the 39 cells, which showed a relatively larger decrease in the intensity of the band at as compared with its adjacent band at at 90-deg orientation. The shaded regions highlight the spectral region which showed most significant orientation-dependent intensity changes. Differences between the spectra of these 39 cells and the total 60 cells [shown in Fig. 3(a)] are shown in (c) and (d) for 0-deg and 90-deg cell orientations, respectively.  To quantify the orientation-dependent changes observed in the Raman spectra, the peak intensities of the bands showing a prominent orientation-dependent change were calculated. Since the Raman band at is a well-isolated band [Fig. 6(a)], the peak intensities of this band were measured directly from the spectrum. However, the region 1500 to is composed of eight bands:26,30 (), (), (), (), , , (), and (amide I). Since these bands are closely spaced and strongly overlapped, their intensity cannot be directly determined from the spectra. To determine the peak positions and intensities of these bands, spectral deconvolution was performed. For this, eight Lorentzian peaks with intensity, width, and position as fitting parameters were used to obtain the best fit profile for the experimental spectral data. The value of , which is an estimate of goodness of fit, was . The fitted trace and the mean spectral data corresponding to 0 deg and 90 deg orientations are shown in Figs. 6(b) and 6(c). It can be seen that the fitted trace fit the observed data quite well. In Figs. 6(d)–6(g), the peak heights of the band at and some of the deconvoluted bands in the 1500 to region, which showed statistically significant orientation-dependent intensity changes, are plotted as a function of the cell-orientation angle. To check for the statistical significance of the intensity changes observed for different orientation angles, a two-sample student t-test was performed. The bands at and showed significant differences () between the peak intensities observed for consecutive orientation angles [Figs. 6(d) and 6(e)]. However, the bands at and showed a significant difference () only between the peak intensities observed for 0 deg (180 deg) and 90 deg orientations [Figs. 6(f) and 6(g)]. It may be noted here that no normalization was performed on the Raman spectra and the inherent intercell variation in Hb concentration as well as oxygenation level may be the reason for the large spread of the peak intensity values around their mean peak intensities present in Figs. 6(d)–6(g). Table 2 lists the mean peak intensities of the Raman bands whose angular dependence is plotted in Figs. 6(d)–6(g). It can be noted that of the four bands, the bands at and undergo the largest change in intensity as the cells rotate from 0 deg to 90 deg orientation. Fig. 6(a) Magnified view of the band at in mean Raman spectra at 0- and 90-deg cell orientations. (b and c) The mean Raman spectra in the to region and the fitted trace as well as the deconvoluted bands for 0-deg and 90-deg cell orientations, respectively. (d–g) Box plots of the cell orientation-dependent variation in peak heights of the bands at 754, 1547, 1563, and . The solid line within each box represents the median, the bottom and top borders indicate the 25th and 75th percentiles, the notches represent the 95% confidence intervals, and dot inside the box indicates the mean (*, **, *** indicate -values , , , respectively). 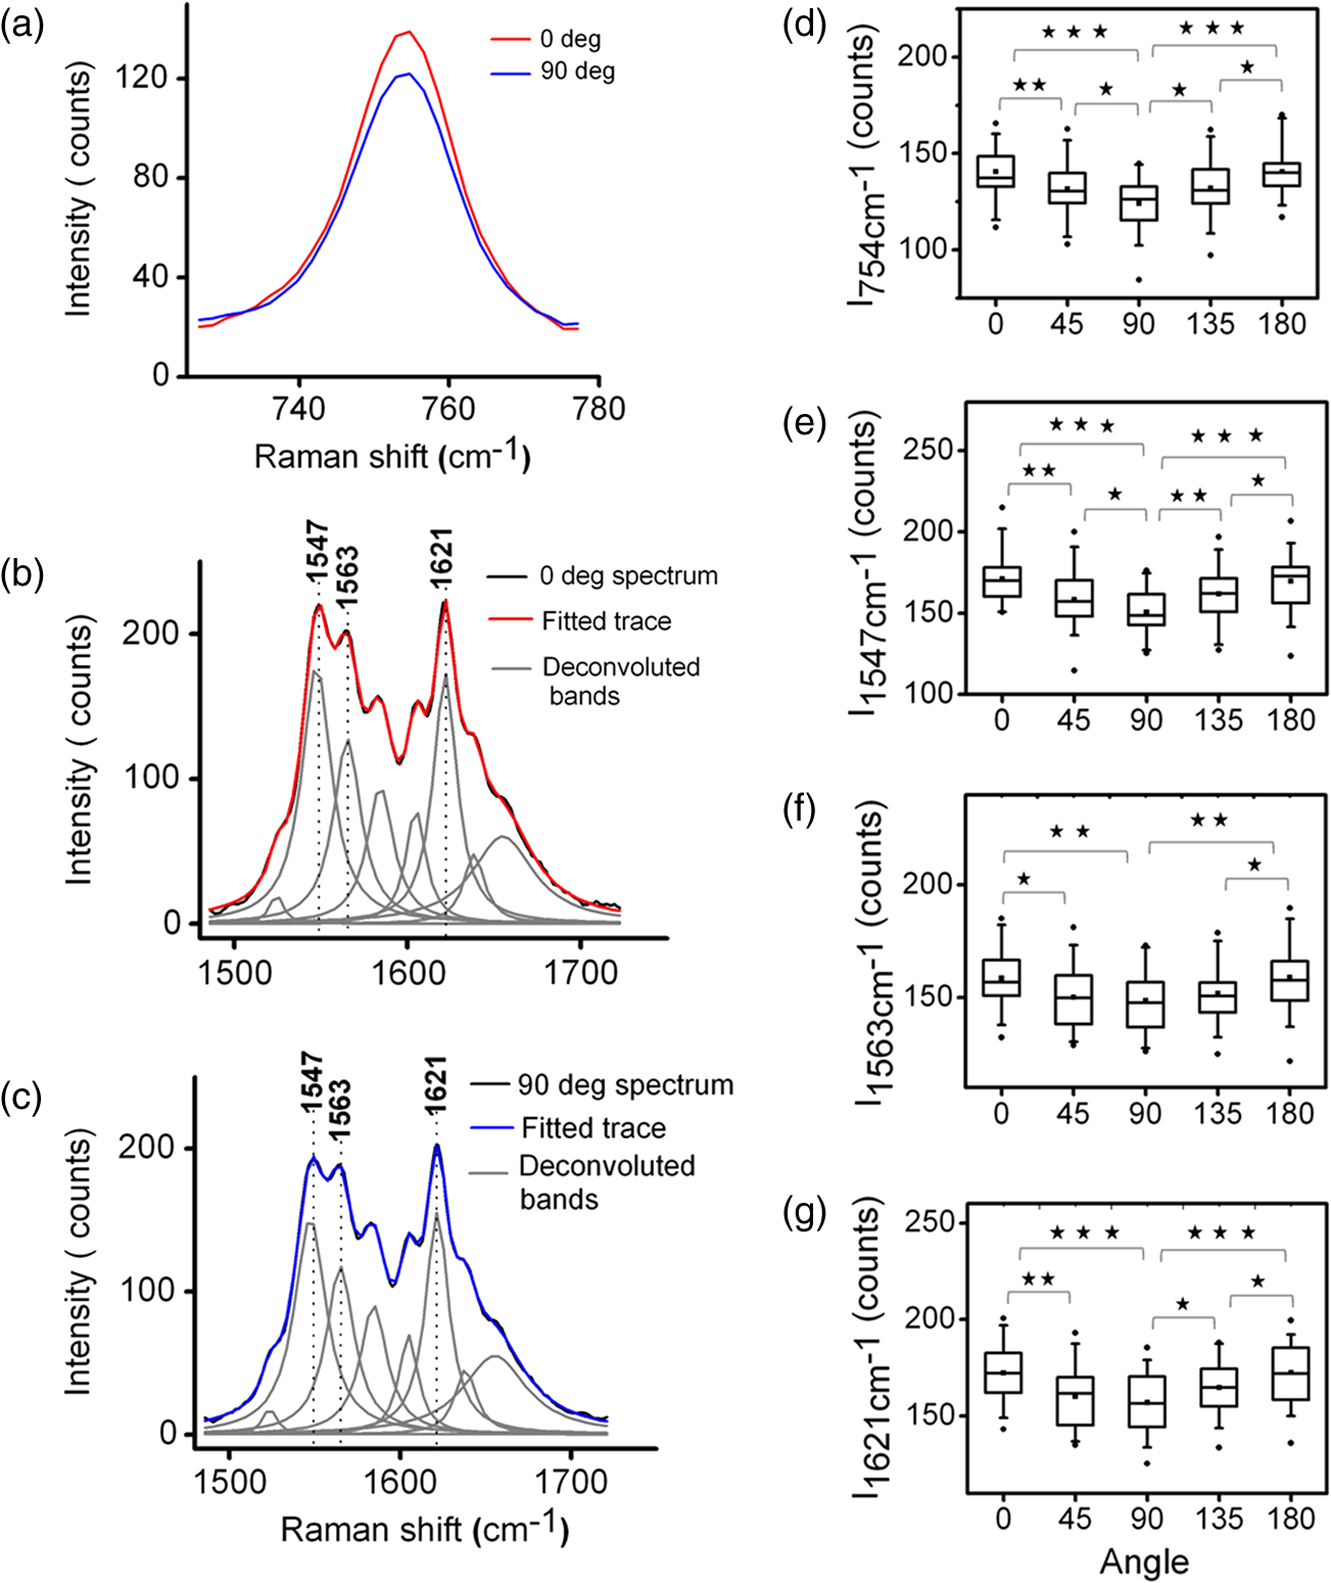 Table 2Mean peak heights for various Raman bands at different orientation angles of the trapped RBC relative to the excitation beam polarization direction.
Next, we present the results of perpendicular-polarized Raman measurements performed on RBCs in their different orientations. It may be noted here that to avoid any photodamage effects that may occur due to prolonged laser irradiation, the parallel and perpendicular polarization measurements were made on different populations of the RBCs from the same blood samples. Figure 7 shows the perpendicularly-polarized Raman spectra at different cell orientations averaged over 60 cells (20 cells investigated from each blood sample). It can be seen from the figure that for this polarization, there are no significant orientation-dependent intensity changes in the spectra. 5.DiscussionsFrom the results presented in Figs. 4Fig. 5–6, it can be noted that the intensities of the various bands in the parallel-polarized Raman spectra undergo significant changes as the cell is rotated to make different orientation angles relative to the excitation beam polarization direction. In particular, the intensity of the bands in the spectral region 1500 to and at become highest when the RBCs’ equatorial plane is parallel to the excitation beam polarization direction, i.e., 0 deg and 180 deg orientation, and lowest when the RBC plane is perpendicular to the excitation beam polarization direction, i.e., 90 deg orientation. If the Hb molecules inside the RBCs are in totally disordered arrangement as in a solution, then the Raman spectrum of the RBC should not have any dependence on its orientation relative to the excitation beam polarization direction. Thus, the anisotropic behavior of Raman spectra provides strong evidence that the Hb molecules inside the cell must be in some ordered arrangement. It is pertinent to note here that the bands showing orientation-dependent intensity changes are the ones arising out of heme vibrations, whereas the bands contributed by the surrounding protein, such as the bending vibration band at and the very prominent phenylalanine band at , do not show any significant orientation-dependent changes. This suggests that it is the arrangement of heme groups within the RBCs that is responsible for the anisotropic spectral response of the RBCs. Because a heme molecule is planar, it is highly anisotropic and is expected to have maximum polarizability when the Raman excitation polarization direction is parallel to its plane. The experimental observation that the intensity of the prominent heme bands become highest when the RBCs’ equatorial plane is parallel to the excitation beam polarization, i.e., 0 deg and 180 deg orientation, and lowest when it is perpendicular to the excitation beam polarization direction, i.e., 90 deg orientation, suggests that the heme molecules may have some preferential orientation parallel to the RBCs’ equatorial plane. Since the heme groups are embedded within the globin subunits of the Hb, any ordering of the heme group would also imply the ordering of Hb molecules. For such an ordered Hb arrangement, one would expect an anisotropic response from globin units as well. However, the molecular subgroups in the globin contributing to the Raman spectra, such as phenylalanine rings, are present in relatively high abundance, phenylalanine residues per globin subunit,31 and at different orientations with respect to the porphyrin plane32 (Protein Data Bank ID: 1HHO) within the quite complex structure of the globin folds, which might have resulted in randomization of the anisotropic response of individual phenylalanine rings and hence the isotropic response. It is worthwhile to compare the results of our study with the polarized Raman spectrscopy (PRS) study carried out by Wood et al.14 They compared the average unpolarized spectra recorded from the two populations: population 1 and population 2 (as described in Sec. 1) and analyzed the spectral changes using principal components (PC) analysis. They observed that the PC1, which explained 75% of the variance, mainly reflected the differences related to laser-induced effects and oxygen saturation levels of various RBCs and PC2 accounting for 13% of the variance exhibited for differences related to the orientation of the cell. From PC2, they suggested that the bands at , 1561, 1588, 1605, 1619, and were most sensitive to the RBC orientation. The bands at , 1588, 1561, and were found to be more intense in population 2, while the bands at 1634 and were more intense in population 1. It may be noted here that these bands belong to the porphyrin skeletal vibration modes spectral region, i.e., 1500 to , and in our study most prominent changes were observed in this spectral region, too. A more direct comparison between the two studies is not possible mainly because of two reasons: (1) Wood et al. made a comparison between the unpolarized averaged spectra recorded from the two populations of RBCs, whereas we have investigated the polarized Raman spectra as a function of cell orientation. Although Wood et al. also performed polarized measurements, they did not make a comparison between the polarized spectra observed for the two populations. (2) In population 1, the RBCs had their equatorial planes parallel to the excitation beam polarization direction. However, in population 2, the equatorial planes of the RBCs could take any orientation relative to the beam polarization direction while remaining parallel to the beam propagation direction. Therefore, the spectral response of a fraction of the cells from population 2 could overlap with the response of cells from population 1, whereas in our study there was no such overlapping between the spectra recorded at different orientations of the RBCs. It may be noted here that the arguments presented in the preceding paragraphs to relate the experimentally observed anisotropic Raman response of the RBCs to the heme ordering within the RBC are very qualitative and cannot explain the subtle differences observed in the magnitude of the intensity modulation for the adjacent bands at () and at () and also the observation of no significant orientation-dependent intensity change in the perpendicularly polarized Raman spectra (Fig. 7). To explain these observations, a more quantitative approach may be required. Since the heme molecules can be approximated by point group symmetry, a theoretical model based on this symmetry was used to comprehend the experimental observations. In the model, a hypothetical RBC consisting of the planes of all heme molecules oriented parallel to the RBCs’ equatorial plane was considered. The cue for adopting such a configuration of heme molecules was taken from the observed experimental results, where the maximum intensity of heme bands was obtained when the RBC equatorial plane was parallel to the excitation beam polarization direction. In this modeling, only the bands showing significant orientation-dependent intensity modulation and having symmetry assignment, i.e., bands at , 1547, and , were considered. It can be noted from Table 1 that the bands appearing at and belong to and the band at belongs to the symmetry species. For the hypothetical RBC, the dependence of intensity of the bands belonging to these symmetry species on the RBCs’ orientation angle would be governed by Eq. (6). For modes, the intensity varies as , where is the orientation angle, and thus these modes exhibit a periodicity of 180 deg with a maximum intensity at 0 deg and 180 deg orientations and a minimum intensity at 90 deg. The experimental and theoretical results for orientation-dependent intensity variation for the band are shown in Fig. 8. The theoretical results predict a minimum intensity value of zero at a 90 deg orientation, which can only be true in the case of perfectly orientated molecules. The agreement between the theoretical and experimental values appears to be very good. Fig. 8Theoretical (normalized intensity) and experimental observed dependences of the intensity of the band at on the orientation of RBC relative to the excitation beam polarization direction.  For modes, the intensity is predicted to vary as , where and are the in-plane and out-of-plane components of the Raman tensor. For a perfectly planar molecule, ratio is expected to be very small and can be ignored.29 However, for heme molecules to be perfectly planar molecules, the requirement is that both the axial ligands should be same and of perfect axial symmetry and the porphyrin macrocycle should be symmetrically substituted. None of these conditions are fulfilled exactly for the heme molecules and therefore the -component cannot be neglected. Since the angle-dependent variations of the - and -components tend to cancel each other, the presence of a small -component will act to reduce the magnitude of the intensity change that would have occurred if only the -component was present. Therefore, we may expect the modes to show a similar angle-dependent behavior as that for modes, but with a reduced amplitude modulation. This may be the reason for the experimental observation of a smaller change in the intensity at () as compared with the band at (). Further, it can be noted from the Eq. (7) that for both and modes, the intensity of the Raman scattered light polarized perpendicular to the excitation beam polarization direction varies as , i.e., with a periodicity of 90 deg and become maximum at 45 deg and minimum at 0 deg and 90 deg orientations. However, the magnitude of variation is only of that for the parallel-polarized case. This may be the reason for not observing any significant orientation-dependent intensity changes in the perpendicularly polarized Raman spectra. Thus, the results of the measurement on the orthogonal-polarized component of Raman scattered light provide strong evidence that the heme molecules within the RBC have a preferential orientation parallel to the RBCs’ equatorial plane. However, a smaller amplitude modulation () observed for experimental data (Fig. 7) as compared with the theoretical prediction (100%) suggests that the degree of orderedness may be very small. The fact that the four heme groups within each oxyhemoglobin tetramer are approximately parallel to each other33 further strengthens the possibility that for some arrangement of Hb molecules, the heme groups of neighboring Hb molecules may become parallel to each other. Thus, the neighboring Hb molecules inside the RBCs may frequently acquire an arrangement which makes the heme molecules parallel to RBCs’ equatorial plane. To conclude, we have observed that the parallel-polarized Raman spectrum of an RBC depends upon its orientation relative to the excitation beam polarization direction. Theoretical simulations carried out to comprehend these observations suggest that in RBC, the Hb molecules within the cells must be present in an ordered arrangement, such that heme-porphyrin planes become preferentially orientated parallel to the RBCs’ equatorial plane, although the degree of orderness appears to be very small. ReferencesW. DosterS. Longeville,
“Microscopic diffusion and hydrodynamic interactions of hemoglobin in red blood cells,”
Biophys. J., 93
(4), 1360
–1368
(2007). http://dx.doi.org/10.1529/biophysj.106.097956 BIOJAU 0006-3495 Google Scholar
D. Wanget al.,
“Myoglobin and hemoglobin rotational diffusion in the cell,”
Biophys. J., 73
(5), 2764
–2770
(1997). http://dx.doi.org/10.1016/S0006-3495(97)78305-X BIOJAU 0006-3495 Google Scholar
C. H. EverhartC. S. Johnson,
“The determination of tracer diffusion coefficients of proteins by means of pulsed field gradient NMR with applications to hemoglobin,”
J. Magn. Reson., 48
(3), 466
–474
(1982). http://dx.doi.org/10.1016/0022-2364(82)90078-6 JOMRA4 0022-2364 Google Scholar
P. W. KuchelB. E. Chapman,
“Translational diffusion of hemoglobin in human erythrocytes and hemolysates,”
J. Magn. Reson., 94
(3), 574
–580
(1991). http://dx.doi.org/10.1016/0022-2364(91)90144-I JOMRA4 0022-2364 Google Scholar
J. B. Wittenberg,
“The molecular mechanism of hemoglobin facilitated oxygen diffusion,”
J. Biol. Chem., 241
(1), 104
–114
(1966). JBCHA3 0021-9258 Google Scholar
V. Riveros-MorenoJ. B. Wittenberg,
“The self diffusion coefficients of myoglobin and hemoglobin in concentrated solutions,”
J. Biol. Chem., 247
(3), 895
–901
(1972). JBCHA3 0021-9258 Google Scholar
D. G. DervichianG. FournetA. Guinier,
“Mise en evidence d’une structure submicroscopique dans les globules rouges par la diffusion des rayons X aux petits angles,”
C. R. Acad. Sci. Paris, 224 1848
–1850
(1947). CRSPEA 1251-8050 Google Scholar
M. F. Perutz,
“Submicroscopic structure of the red cell,”
Nature, 161 204
(1948). http://dx.doi.org/10.1038/161204a0 NATUAS 0028-0836 Google Scholar
J. C. Heckelet al.,
“Polarized Raman spectroscopy of oligothiophene crystals to determine unit cell orientation,”
J. Phys. Chem. A, 116
(25), 6804
–6816
(2012). http://dx.doi.org/10.1021/jp304192v JPCAFH 1089-5639 Google Scholar
A. B. Kudryavtsevet al.,
“Polarized Raman spectroscopic studies of tetragonal lysozyme single crystals,”
Acta. Crystallogr. D Biol. Crystallogr., 54
(Pt 6–Pt 2), 1216
–1229
(1998). http://dx.doi.org/10.1107/S0907444998001486 ABCRE6 0907-4449 Google Scholar
S. Jenet al.,
“Polarized Raman scattering studies of orientational order in uniaxial liquid crystalline phases,”
J. Chem. Phys., 66
(10), 4635
–4661
(1977). http://dx.doi.org/10.1063/1.433720 JCPSA6 0021-9606 Google Scholar
H. M. Liemet al.,
“Raman anisotropy measurements: an effective probe of molecular orientation in conjugated polymer films,”
Adv. Funct. Mater., 13
(1), 66
–72
(2003). http://dx.doi.org/10.1002/adfm.200390008 AFMDC6 1616-3028 Google Scholar
G. J. Thomaset al.,
“Polarized Raman spectra of oriented fibers of ADNA and B DNA: anisotropic and isotropic local Raman tensors of base and backbone vibrations,”
Biophys. J., 68
(3), 1073
–1088
(1995). http://dx.doi.org/10.1016/S0006-3495(95)80282-1 BIOJAU 0006-3495 Google Scholar
B. R. WoodL. HammerD. McNaughton,
“Resonance Raman spectroscopy provides evidence of heme ordering within the functional erythrocyte,”
Vib. Spectrosc., 38
(1–2), 71
–78
(2005). http://dx.doi.org/10.1016/j.vibspec.2005.02.016 VISPEK 0924-2031 Google Scholar
S. Raoet al.,
“Polarization Raman study of protein ordering by controllable RBC deformation,”
J. Raman Spectrosc., 40
(9), 1257
–1261
(2009). http://dx.doi.org/10.1002/jrs.v40:9 JRSPAF 0377-0486 Google Scholar
D. V. Petrov,
“Raman spectroscopy of optically trapped particles,”
J. Opt. A: Pure Appl. Opt., 9 S139
–S156
(2007). http://dx.doi.org/10.1088/1464-4258/9/8/S06 JOAOF8 1464-4258 Google Scholar
Y. Liet al.,
“Dual-trap Raman tweezers for probing dynamics and heterogeneity of interacting microbial cells,”
J. Biomed. Opt., 15
(6), 067008
(2010). http://dx.doi.org/10.1117/1.3526357 JBOPFO 1083-3668 Google Scholar
S. Ahlawatet al.,
“Raman spectroscopic investigations on optical trap induced deoxygenation of red blood cells,”
Appl. Phys. Lett., 103
(18), 183704
(2013). http://dx.doi.org/10.1063/1.4828706 APPLAB 0003-6951 Google Scholar
P. ZhangP. SetlowY. Li,
“Characterization of single heat-activated Bacillus spores using laser tweezers Raman spectroscopy,”
Opt. Express, 17
(19), 16480
–16491
(2009). http://dx.doi.org/10.1364/OE.17.016480 OPEXFF 1094-4087 Google Scholar
R. Dasguptaet al.,
“Hemoglobin degradation in human erythrocytes with long-duration near-infrared laser exposure in Raman optical tweezers,”
J. Biomed. Opt., 15
(5), 055009
(2010). http://dx.doi.org/10.1117/1.3497048 JBOPFO 1083-3668 Google Scholar
C. Bremardet al.,
“The effect of high-numerical-aperture objectives on polarization measurements in micro-Raman spectrometry,”
Appl. Spectrosc., 39
(6), 1036
–1039
(1985). http://dx.doi.org/10.1366/0003702854249754 APSPA4 0003-7028 Google Scholar
B. L. N. Salmasoet al.,
“Resonance Raman microspectroscopic characterization of eosinophil peroxidase in human eosinophilic granulocytes,”
Biophys. J., 67
(1), 436
–446
(1994). http://dx.doi.org/10.1016/S0006-3495(94)80499-0 BIOJAU 0006-3495 Google Scholar
C. A. LieberA. Mahadevan-Jansen,
“Automated method for subtraction of fluorescence from biological Raman spectra,”
Appl. Spectrosc., 57
(11), 1363
–1367
(2003). http://dx.doi.org/10.1366/000370203322554518 APSPA4 0003-7028 Google Scholar
S. HuK. M. SmithT. G. Spiro,
“Assignment of protoheme resonance Raman spectrum by heme labeling in myoglobin,”
J. Am. Chem. Soc., 118
(50), 12638
–12646
(1996). http://dx.doi.org/10.1021/ja962239e JACSAT 0002-7863 Google Scholar
M. AbeT. KitagawaY. Kyogoku,
“Resonance Raman spectra of octaethylporphyrinato-Ni (II) and meso-deuterated and 15N substituted derivatives. II. A normal coordinate analysis,”
J. Chem. Phys., 69
(10), 4526
–4534
(1978). http://dx.doi.org/10.1063/1.436450 JCPSA6 0021-9606 Google Scholar
B. R. Woodet al.,
“Resonance Raman spectroscopy of red blood cells using near infrared excitation,”
Anal. Bioanal. Chem., 387
(5), 1691
–1703
(2007). http://dx.doi.org/10.1007/s00216-006-0881-8 ABCNBP 1618-2642 Google Scholar
S. FranzenS. E. Wallace-WilliamsA. P. Shreve,
“Heme charge-transfer band III is vibronically coupled to the Soret band,”
J. Am. Chem. Soc., 124
(24), 7146
–7155
(2002). http://dx.doi.org/10.1021/ja0172722 JACSAT 0002-7863 Google Scholar
D. J. GardinerP. R. Graves, Practical Raman spectroscopy, Springer-Verlag, Berlin
(1989). Google Scholar
T. V. BasovaB. A. Kolesov,
“Raman polarization studies of the orientation of molecular thin films,”
Thin Solid Films, 325
(1–2), 140
–144
(1998). http://dx.doi.org/10.1016/S0040-6090(98)00485-4 THSFAP 0040-6090 Google Scholar
B. R. WoodD. McNaughton,
“Raman excitation wavelength investigation of single red blood cells in vivo,”
J. Raman. Spectrosc., 33
(7), 517
–523
(2002). http://dx.doi.org/10.1002/(ISSN)1097-4555 JRSPAF 0377-0486 Google Scholar
R. J. Hillet al.,
“The structure of human hemoglobin,”
J. Biol. Chem., 237
(5), 1549
–1554
(1962). JBCHA3 0021-9258 Google Scholar
B. Shaanan,
“Structure of human oxyhaemoglobin at 2.1 A resolution,”
J. Mol. Biol., 171
(1), 31
–59
(1983). http://dx.doi.org/10.1016/S0022-2836(83)80313-1 JMOBAK 0022-2836 Google Scholar
M. F. Perutz,
“Absorption spectra of single crystals of hemoglobin in polarized light,”
Nature, 143 731
–733
(1939). http://dx.doi.org/10.1038/143731b0 NATUAS 0028-0836 Google Scholar
|


