
|
|
1.IntroductionIdiopathic pulmonary fibrosis (IPF) is a chronic interstitial lung disease with unknown pathological etiology. It accounts for 34,000 deaths in the United States each year and the daily lives of thousands more are affected by its symptoms, including dyspnea, daily cough, limited exercise capacity, and fear of shortness of breath. Generally, the prognosis of IPF patients is poor in the aggregate with a median survival of three to four years postdiagnosis, whereas a lower percentage of patients (10 to 15%) live five or more years, highlighting the heterogeneity of disease progression.1,2 Prognosis is poor due to both the lack of effective therapeutic options and also due to limited knowledge of the disease pathology and underlying molecular and temporal changes associated with disease progression. Currently, IPF is thought to be due to alveolar injury leading to focal activation and proliferation of fibroblasts accompanied with mild inflammation followed by the accumulation of new extracellular matrix (ECM) and its subsequent destruction.3 Areas of dense collagen accumulation (old scar) are juxtaposed with fibroblastic foci (new scar formation). Collagen I and other minor isoforms (type III, V) are the primary components of the new abnormal matrix,3–6 where the balance changes during progression. For example, previous studies have found that collagen III is characteristic of early IPF, whereas collagen I dominates in late-stage disease.4,7,8 Changes in elastin also contribute to the ECM remodeling, where the proportion of collagen/elastin determines the elastic recoil of the lungs and airway patency.9,10 Elastin in normal alveolar septa is found as an organized epithelial layer of mature elastin fibers providing the elasticity required for proper lung function; however, in early IPF, these fibers are degraded by MMP-9 and elastase that are released from the inflammatory cells and compromise lung patency. As IPF progresses and elastin is degraded, fibroblasts respond through synthesis not only of collagen but also elastin; however, the new elastin is highly disordered and results in poor mechanical properties of the new lung matrix.9,10 High-resolution computed tomography (HRCT) scans can be used to diagnose IPF when a classic radiographic pattern is present;11 however, in many cases, the appearance may not be sufficient to establish a positive diagnosis. In these cases, the gold-standard for IPF diagnosis still remains surgical biopsy followed by pathology. However, this surgery procedure carries significant morbidity due to typical IPF patient characteristics [i.e., older patient population, and often with multiple medical ailments (diabetes, heart disease, etc.)] along with the risk of worsening of the disease in the postoperative period.12,13 Despite the diagnostic utility of HRCT, the resolution is not sufficient to probe the remodeling of collagen and elastin components of the matrix, further limiting its ability to understand the disease pathology. Nonlinear microscopy techniques, including second harmonic generation (SHG) and two-photon excited fluorescence (TPEF), are attractive solutions to this problem as they are able to probe the collagen and elastin, respectively, of the matrix in a label-free manner. Here, we posit that their combined use may contribute to enhanced diagnosis/prognosis of IPF and also further the understanding of the disease etiology and progression. SHG directly probes the structure of collagen and has been used to describe ECM alterations in several diseases, such as cancers, fibroses, and connective tissue disorders.14–27 Multiphoton microscopy of elastin has also been used for several applications, including imaging skin and cardiovascular tissues, often in conjunction with SHG and coherent anti-Stokes Raman scattering.28–30 SHG and TPEF microscopy has not yet been used extensively for lung tissues and has been limited to mouse models. For example, Abraham and Hogg31 and Pena et al.32 both have used SHG and TPEF to study the remodeling in the lung matrix in chronic obstructive pulmonary disease (COPD) and a bleomycin-mouse model of IPF, respectively. Both these studies were successful in differentiating diseased-remodeled lungs from normal lungs using a pixel-based measure of collagen coverage and a voxel ratio of the collagen/elastin balance. However, additional structural information is encoded within the collagen SHG signal that was not utilized. For example, the fiber pattern observed in the SHG images in normal and IPF tissues can be used as a machine learning classification system, enabling the collagen fibrillar pattern to be used as a label-free biomarker for IPF. This is important as, surprisingly, the fibrotic changes in the IPF matrix are considerably less characterized than the cellular aspects. In this study, we take a step in this direction by using a combination of wavelet transform, principle component analysis (PCA), and K-nearest-neighbor algorithm (KNN) to more specifically probe the alterations of the collagen structure observed by SHG in IPF diseased tissues from normal lung ECM architecture. The wavelet/PCA/KNN classifier algorithm is able to accurately delineate normal from IPF diseased lung tissues, potentially ushering in a noninvasive clinical technique to probe the remodeling of the ECM in this disease. We also characterized the change in elastin/collagen balance as an additional biomarker and found that the optical method is consistent with the mechanical consequences of IPF on breathing. Understanding the remodeling process may enhance our ability to differentiate patients who will have rapid progression from those with slow progression and, thus, provide patients with a better prognosis. 2.Materials and Methods2.1.TissuesAll lung tissues were obtained from lung transplant recipients at UW Hospital Madison, Wisconsin, under a current IRB approved protocol. The normal tissues were from pathologist-defined normal adjacent tissue from biopsies of patients without fibrotic lung disease. Tissues were fixed in formalin and sectioned using a vibratome (Leica VT1200) to thickness. After sectioning, the tissues were stored in phosphate buffered saline (PBS) at 4°C until they were imaged. During imaging, they were mounted on glass slides in PBS with #1.5 coverslips and Vaseline to seal the slide while imaging. A total of six normal and three IPF independent patient samples were prepared and imaged. 2.2.Microscope SystemThe imaging system has been described in detail elsewhere33 and is only described briefly here. The instrument is built around an upright microscope stand (BX61, Olympus, Center Valley, Pennsylvania) with a laser scanning unit (Fluoview 300; Olympus) that is coupled to a mode-locked titanium sapphire femtosecond laser (Mira; Coherent, Santa Barbara, California). All imagings (SHG and TPEF) were performed with an excitation wavelength of 890 nm and an average power of at the specimen using a water immersion objective. This configuration resulted in lateral and axial resolutions of and 2.5 microns, respectively. Circular polarization at the focus was used to equally probe all fiber orientations. The microscope has two channels with identically calibrated detectors (7421 GaAsP photon counting modules; Hamamatsu, Hamamatsu, Japan). The two channels permitted simultaneous collection of the SHG wavelength (445 nm) in the forward channel using a 20-nm bandpass filter (Semrock, Lake Forest, Illinois) and the elastin autofluorescence signal in the epifluorescence channel using a 22-nm bandpass filter (583 nm; Semrock). 2.3.Wavelet/PCA/KNN AnalysisWe used a wavelet transform to obtain texture features with PCA and KNN analysis for our classification system.34–36 The wavelet transform decomposition provides both spatial and frequency domain information, which is intricately related to the scale and orientation of the texture features we seek to characterize in the image data. In this process, the wavelet function is placed on a specific location on the image to determine the correlation coefficients between this function and the local morphology. At that location, the shape of the wavelet function is then anisotropically scaled in two dimensions, which then captures (through correlation) both the width and the orientation of the fibers. This process is then translated to different regions in the image and the local wavelet coefficients are calculated. A pictorial diagram of the process going from raw single optical sections to wavelet coefficients is shown in Fig. 1. Fig. 1Flow chart of wavelet/principal component analysis (PCA)/K-nearest-neighbor (KNN) algorithm, beginning with the raw image data, calculating wavelet coefficients, and then performing classification using KNN analysis of the extracted PCAs. DWT, discrete wavelet transform.  Since the study size of six IPF and three normal lungs is small, working with the full set of wavelet coefficients (which characterize the input image in terms of the chosen wavelet basis, here the nine filter Daubechies basis) is problematic. In particular, the number of wavelet coefficients one chooses directly corresponds to the dimensionality of the statistical inference problem that needs to be solved in downstream analysis. If the dimensionality of this space is large, one invariably needs to provide the model with a larger number of images to make the inference well-posed. The solution to this problem is to instead analyze the distribution of the wavelet coefficients in terms of their projections on the principal components (PCs). This corresponds to the axes that explain the maximum variance, describing the full set of images with a low-dimensional representation that is more amenable to traditional statistical analysis. Once these PCs are obtained (via the covariance matrix of the wavelet coefficient distribution), we set up a machine learning task, which constitutes two main steps. First, we use a set of training images, where the class labels of the images are known to learn the pattern that best distinguishes one group from the other (in a space defined by treating the principal axes as the basis). Second, this pattern is used to classify test images whose class label is not known. For classification, we use a simple KNN classifier, a nonparametric method that works under the assumption that the class of each example is similar to the class of its neighbors in the space of PCA axes (see Fig. 1). In other words, for each test image, we consider the majority of votes of its neighbors, which determines the class label of the test image. The images used in the analysis all came from three IPF and six normal patient samples that were available to us. Each patient sample had several imaging locations, providing different optical stacks. Then 15 individual optical sections were selected from the middle 60% from each optical stack. The middle regions were chosen to avoid any edge effects where the surfaces can be uneven, and also to avoid any effects of attenuation on the signal intensity. As a result of the different numbers of normal and diseased patient samples, there were 270 IPF and 495 normal available optical sections for a total of 765 images. For the wavelet/PCA/KNN analysis, the sample size of the normal and IPF tissues were size-matched, where 270 of the 495 normal images were randomly selected for a total of 540 images (i.e., 270 IPF and 270 normal). PCA dimensions resulting from the wavelet transform of 540 images were randomized and partitioned into 10 subgroups, each with 54 images for KNN classification and cross-validation. Ten KNN cross-validation trials were run, in which nine groups served as the training set and one group was the testing set; each subgroup served as the test group once, as is common in cross-validation experiments. The MATLAB® code is freely available upon request. 3.Results3.1.SHG Imaging of Normal and IPF Large Airway and Parenchymal TissuesThe ECM structures of normal and IPF lung display significant visual morphology differences in both the large airway spaces and parenchymal areas (Fig. 2). Figures 1(a) and 1(c) are representative SHG optical sections of the collagen architecture surrounding large airways of IPF and normal lungs, respectively. Figures 2(b) and 2(d) are representative optical sections of the collagen architecture of parenchymal areas of IPF and normal lungs, respectively. By visual inspection, the collagen in the diseased lungs in both the large airway and parenchymal regions is packed into denser regions than in the normal tissue. Images at magnification were also acquired and were not visually different than smaller fields of view. Fig. 2Panels are representative single second harmonic generation (SHG) optical sections of (a) large airway of an idiopathic fibrosis (IPF) lung, (b) parenchymal region of IPF lung, (c) large airway of normal lung, and (d) parenchymal region of normal lung. Field of view is .  For translational purposes, we need to develop objective quantitative methods. The simplest approach is to apply a threshold and calculate the average pixel intensity and collagen area covered, as has been previously reported.26 The threshold used to eliminate the background signal was determined by measuring the background signal in 15 different locations per image stack and finding the average plus the standard deviation. The applied threshold level was specific to each optical section within the image stack and was determined at each optical section to account for signal attenuation at increasing depths. This approach showed that there were no statistical differences in SHG intensity between either normal and IPF parenchyma or large airway. The area covered was statistically different between normal and IPF parenchyma (), where the latter was higher, as might be expected for fibrosis. However, there were no differences in coverage between normal and IPF large airway. 3.2.Wavelet/PCA/KNN Classification of SHG Normal and IPF TissuesThe largely insignificant results in the previous section demonstrate the need for more in-depth quantitative image analysis and classification. The wavelet transform uses the edges of the collagen fibers to provide quantification of the qualitative differences our eyes naturally detect, providing a robust means independent of human visual biases for classifying tissues. The wavelet/PCA/KNN classifier was developed (Sec. 2.3) for this purpose, which reliably differentiates the diseased from normal lung tissues. In this analysis, both large airway and parenchymal regions of the lungs were combined for the classification. Figure 3 shows plots of the receiver operator characteristic (ROC) curves (true positive versus false positive) for the classification of IPF and normal lung tissues for a few combinations of different PCA dimensions and KNN to demonstrate the dependence on PCA and KNN parameters for the classification of tissue. An area under the curve (AUC) of 1.0 is a perfect classification, where 0.5 is a random outcome and provides no discrimination. In practice, values suggest excellent test accuracy in clinical applications. Table 1 lists the area under the ROC curve for all the combinations of PCA dimensions and KNN applied to classify the images. Fig. 3Receiver operator characteristic curves for different combinations of PCA dimensions and KNN used to classify the normal and IPF tissues: (a) varying the number of PCA dimensions from 5 to 300 while constraining , (b) varying the number of PCA dimensions from 5 to 300 while constraining , and (c) varying the number of KNN from 5 to 15 while constraining PCA dimensions to 100.  Table 1Area under the receiver operator characteristic curves for combinations of principal component analysis (PCA) dimensions and nearest neighbors.
The optimal classification was obtained using 20 PCA dimensions and 5 NNs, with a resulting AUC of 0.998. The accuracy of classification is similar using five NNs at all PCA dimensions. As the number of NNs is increased, the accuracy of classification still remains high even at low PCA dimension, but the accuracy increases as the PCA dimensions are increased, noting that as more neighbors are included, the slight changes between the higher-order PCA dimensions allow more accurate classification. We found that all combinations of PCA dimensions and KNN provided excellent classification since the worst obtained accuracy was 94%. In general, it is desirable to use as few PCA dimensions and NNs as possible to avoid overfitting errors, and this is enabled here due to the significant change in collagen fibrillar morphology. 3.3.Determination of Collagen/Elastin Balance in Normal and IPF TissuesElastic fiber formation is also increased in IPF (Ref. 10) and the elastin/collagen ratio may be impacted during disease progression (Ref. 9). Initially, in IPF patients, there is an increase in the collagen deposition, but late-stage IPF is described as having an increased presence of elastin. This balance is important in determining the mechanical properties of the lung matrix, such as ECM stiffness and associated elastic recoil forces. We specifically probed both the collagen (SHG) and elastin (TPEF), where these contrasts were simultaneously excited at the same wavelength (890 nm) and spectrally isolated in separate channels. As the elastin contrast is linearly proportional to the concentration, and SHG is a merged effect of the square of the collagen concentration and its organization, it is not possible to determine their actual molecular ratios. The collected signal of both the collagen and elastin signals is further confounded by the different scattering phenomena when imaging relatively thick tissue samples. However, we analyzed the volumetric ratio of elastin and collagen using the well-documented method: , where and represent elastin and collagen voxel volumes, respectively,31,37 where the limiting cases of this ratio of and correspond to all elastin or collagen in the pixel, respectively. Volume fraction estimates were completed on all imaging stacks taken from the parenchyma of three normal and four IPF patient samples. The TPEF spectrum of elastin is broad and overlaps with other autofluorescence signals (e.g., cellular); therefore, segmentation was required to spatially isolate the elastin signal. The intensity of the autofluorescence cellular components was much weaker than that of elastin, which allows thresholding for successful spatial separation as seen in raw [Fig. 4(a)] and segmented [Fig. 4(b)] images for normal, and raw [Fig. 4(c)] and segmented [Fig. 4(d)] images of IPF tissues. The threshold was set using the average signal intensity of the cellular components for each stack, where all the pixels with gray levels above the threshold value were summed to calculate the volumetric fractional coverage of elastin. Similarly, the background signal of the SHG images was eliminated, allowing all the pixels with a signal above the threshold to be summed to calculate the volumetric fractional coverage of collagen. Fig. 4(a) and (c) are representative individual two-photon excited fluorescence optical sections of a normal and IPF diseased lung, respectively. The triangular arrows delineate cells, and the arrow indicates mucous, which both are removed via thresholding techniques. The corresponding resulting segmented elastin images are shown in (b) and (d). 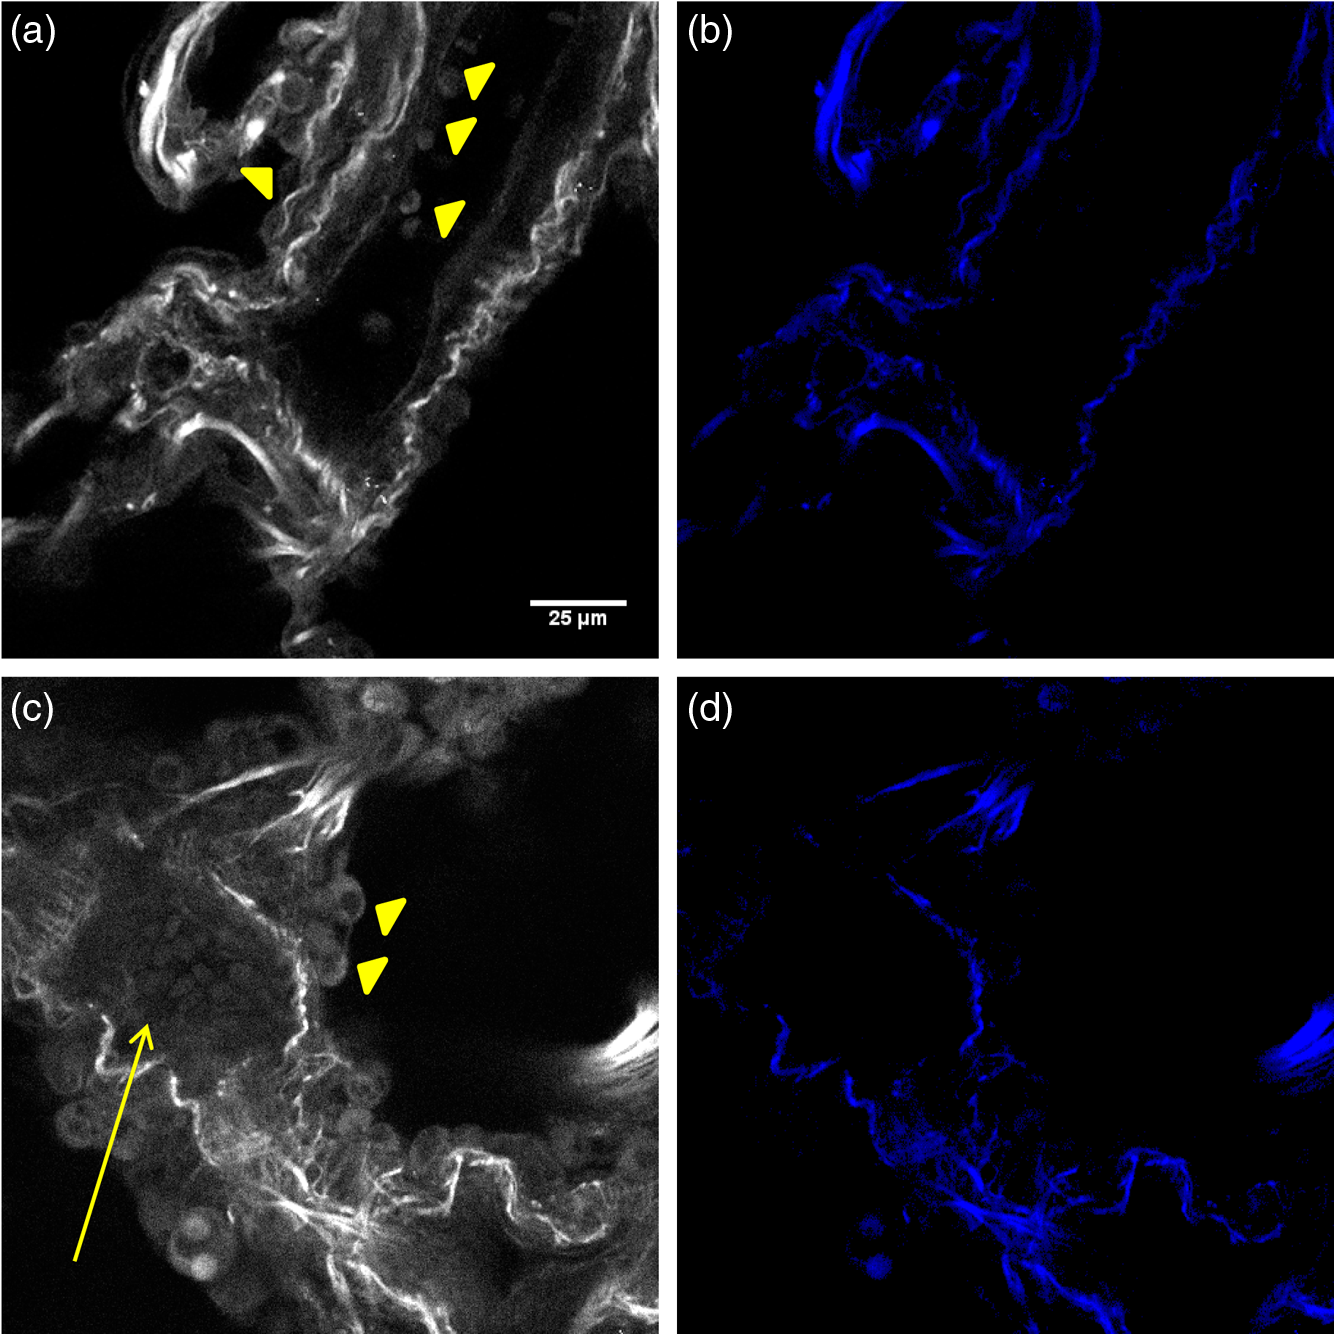 Two representative background-corrected color images of the SHG (green) and elastin (blue) TPEF for normal and IPF tissues are shown in Figs. 5(a) and 5(b), respectively, where the organization of the collagen and elastin are both dramatically different in these cases. Specifically, the elastin in the normal tissues is organized within the confines of collagen, whereas in the diseased tissue, the elastin is disorganized and not exclusively intermingled with the collagen fibers. The elastin/collagen index derived from all parenchymal imaging stacks in normal and IPF tissues is shown in Fig. 5(c), where the resulting ratios were and , respectively, where these values were statistically significant at the level using a student’s paired test. The normal tissues were more elastic relative to collagen than the diseased tissues, indicative of an altered composition of the matrix. This finding, determined by optical microscopy is consistent with known mechanical consequences of the disease. We note that there was no discrimination of large airways through this method. Fig. 5Single optical sections of (a) normal and (b) IPF parenchyma, where blue and green is the two-photon excited autofluorescence from elastin and SHG from collagen, respectively. Field of view is . (c) Averaged collagen/elastin ratio of normal () and IPF () parenchymal tissues where limiting values of are indicative of all elastin and all collagen, respectively. Normal and IPF parenchyma are statistically different ().  4.DiscussionThe operative pathways in IPF and also the concomitant changes in the ECM are poorly understood. However, the combination of SHG and TPEF microscopy affords label-free, submicron resolution probes of the ECM changes. Specifically, this approach may provide insights into the disease pathology and potentially guide the development of more effective therapeutic treatments. Moreover, the methods could ultimately be integrated into a scanning microendoscope.38 The application of standard machine learning techniques commonly used in computer vision has great potential as image classification algorithms of optical microscopy data. Simple image analysis techniques commonly used in optical microscopy, such as FFT, are highly dependent on having well-aligned structures within the imaging field of view, which is rather infrequent in most biological tissues.39–42 Moreover, FFTs provide a global rather than local analysis. As a result, they have found their largest use in analyzing SHG images of highly organized structures like tendon. Other transforms, such as curvelets, have the capability of local analysis and alleviate the limitations of FFT. For example, Keely and colleagues successfully utilized a curvelet transform, a variant of a wavelet transform, in the evaluation of the collagen fiber alignment around tumor boundaries in various stages of breast cancer.43 However, for the current case, we are interested in analyzing the overall collagen in the image, where there is no specific frame of reference such as a tumor boundary. Texture analyses are superior in this regard, as they locally probe slowly statistically, repetitive features that are present within the image. The local analysis using the integrated wavelets/PCA/KNN approach affords the development of a tailored classification scheme based on recurring patterns in known images (although the PCAs do not correspond to visually identifiable features), which can then be used to classify unknown images. This approach is powerful for the classification of overall sparse but locally dense collagen fibers found in both normal and IPF diseased lung tissues. We could consider other texture features as well. For example, a collagen-specific morphological filter could have been designed, but this approach is time-intensive and is not flexible in its application, i.e., it must be customized by trial and error for each application. For example, we have used an implementation of texture analysis using textons44 in other work on ovarian cancer (submitted). This requires creating an extensive library of common features. Still, the textons also do not correlate to specific features. In general, we note that texture approaches have an inherent abstraction as they look at slowly varying statistical patterns rather than tangible features, such as fiber length and alignment. The advantage of this approach is that wavelets are general signal processing tools and are provided in the MATLAB® toolbox, where a great number of different functions are standard and can be tested to get the optimal results. While the patient numbers here were low, the classification system had high accuracy (94 to 99%), based on the area under the computed ROC curves. In contrast, simpler metrics of intensity and area covered provided insufficient discrimination. The robustness of this classification algorithm is preserved across all combinations of PCA dimensions and KNN and is a major strength of the approach. In contrast, simpler techniques, such as the gray-level co-occurrence matrix classification,45 use only the brightness of adjacent pixels rather than patterns and are not always applicable. Moreover, brightness measurements can be misleading due to scattering, change in concentration, and other unknown factors. 5.ConclusionsQuantifying and classifying images of biological tissues using optical microscopy remains challenging. Therefore, development of standard computer vision techniques, such as the current work, for nonlinear optical microscopy image classification is highly beneficial to the community and will enhance our own research findings. Specifically, in this particular study, it has allowed excellent classification accuracy () of normal and IPF diseased tissues, providing the initial step toward the development of additional studies to probe the disease pathology. Additionally, combining the pattern analysis with the collagen/elastin balance yields a more complete picture of the alterations in the ECM in IPF. Given the robustness of this classification tool, it may be feasible in future studies with larger patient numbers to separate data from large airway and parenchymal areas to determine if classification is possible based on the remodeling of large airways alone, potentially allowing for less-invasive imaging studies and diagnostic tools. AcknowledgmentsP.J.C. gratefully acknowledges support under NIH National Cancer Institute R01 CA136590-01A1 and K.T. acknowledges support under 5T32CA009206-34. Support from the Morgridge Institute for Research for B.L.W. is also acknowledged. V.S. is supported in part by an NSF CAREER award and from University of Wisconsin Institute for Clinical and Translation Research (CTSA award 1UL1RR025011). N.S. acknowledges support under NIH 5K08HL093367. We would like to thank the Carbone Cancer Center Translational Science BioCore (supported by NIH P30 CA014520) for their collaboration in obtaining normal and fibrotic lung samples. ReferencesE. R. F. Perezet al.,
“Incidence, prevalence, and clinical course of idiopathic pulmonary fibrosis: a population-based study,”
Chest, 137
(1), 129
–137
(2010). http://dx.doi.org/10.1378/chest.09-1002 CHETBF 0012-3692 Google Scholar
F. J. Martinezet al.,
“The clinical course of patients with idiopathic pulmonary fibrosis,”
Ann. Intern. Med., 142
(12), 963
–967
(2005). http://dx.doi.org/10.7326/0003-4819-142-12_Part_1-200506210-00005 AIMEAS 0003-4819 Google Scholar
M. Selmanet al.,
“Concentration, biosynthesis and degradation of collagen in idiopathic pulmonary fibrosis,”
Thorax, 41
(5), 355
–359
(1986). http://dx.doi.org/10.1136/thx.41.5.355 THORA7 0040-6376 Google Scholar
G. Raghuet al.,
“Extracellular matrix in normal and fibrotic human lungs,”
Am. Rev. Respir. Dis., 131
(2), 281
–289
(1985). ARDSBL 0003-0805 Google Scholar
J. M. Kirket al.,
“Biochemical evidence for an increased and progressive deposition of collagen in lungs of patients with pulmonary fibrosis,”
Clin. Sci. (Lond), 70
(1), 39
–45
(1986). Google Scholar
J. D. Fulmeret al.,
“Collagen concentration and rates of synthesis in idiopathic pulmonary fibrosis,”
Am. Rev. Respir. Dis., 122
(2), 289
–301
(1980). ARDSBL 0003-0805 Google Scholar
E. D. Batemanet al.,
“Cryptogenic fibrosing alveolitis: prediction of fibrogenic activity from immunohistochemical studies of collagen types in lung biopsy specimens,”
Thorax, 38
(2), 93
–101
(1983). http://dx.doi.org/10.1136/thx.38.2.93 THORA7 0040-6376 Google Scholar
J. M. Kirket al.,
“Quantitation of types I and III collagen in biopsy lung samples from patients with cryptogenic fibrosing alveolitis,”
Coll. Relat. Res., 4
(3), 169
–182
(1984). http://dx.doi.org/10.1016/S0174-173X(84)80039-4 CREXDV 0174-173X Google Scholar
N. Enomotoet al.,
“Amount of elastic fibers predicts prognosis of idiopathic pulmonary fibrosis,”
Respir. Med., 107
(10), 1608
–1616
(2013). http://dx.doi.org/10.1016/j.rmed.2013.08.008 RMEDEY 0954-6111 Google Scholar
G. F. Rozinet al.,
“Collagen and elastic system in the remodelling process of major types of idiopathic interstitial pneumonias (IIP),”
Histopathology, 46
(4), 413
–421
(2005). http://dx.doi.org/10.1111/his.2005.46.issue-4 HISTDD 1365-2559 Google Scholar
G. Raghuet al.,
“An official ATS/ERS/JRS/ALAT statement: idiopathic pulmonary fibrosis: evidence-based guidelines for diagnosis and management,”
Am. J. Respir. Crit. Care Med., 183
(6), 788
–824
(2011). http://dx.doi.org/10.1164/rccm.2009-040GL AJCMED 1073-449X Google Scholar
J. P. Utzet al.,
“High short-term mortality following lung biopsy for usual interstitial pneumonia,”
Eur. Respir. J., 17
(2), 175
–179
(2001). http://dx.doi.org/10.1183/09031936.01.17201750 ERJOEI 0903-1936 Google Scholar
C. J. Lettieriet al.,
“Outcomes and safety of surgical lung biopsy for interstitial lung disease,”
Chest, 127
(5), 1600
–1605
(2005). http://dx.doi.org/10.1378/chest.127.5.1600 CHETBF 0012-3692 Google Scholar
P. Campagnola,
“Second harmonic generation imaging microscopy: applications to diseases diagnostics,”
Anal. Chem., 83
(9), 3224
–3231
(2011). http://dx.doi.org/10.1021/ac1032325 ANCHAM 0003-2700 Google Scholar
O. Nadiarnykhet al.,
“Alterations of the extracellular matrix in ovarian cancer studied by second harmonic generation imaging microscopy,”
BMC Cancer, 1094
(2010). http://dx.doi.org/10.1186/1471-2407-10-94 BCMACL 1471-2407 Google Scholar
R. LacombO. NadiarnykhP. J. Campagnola,
“Quantitative SHG imaging of the diseased state Osteogenesis Imperfecta: experiment and simulation,”
Biophys. J., 94
(11), 4504
–4514
(2008). http://dx.doi.org/10.1529/biophysj.107.114405 BIOJAU 0006-3495 Google Scholar
P. P. Provenzanoet al.,
“Collagen reorganization at the tumor-stromal interface facilitates local invasion,”
BMC Med., 438
(2006). http://dx.doi.org/10.1186/1741-7015-4-38 BMMECZ 1741-7015 Google Scholar
K. Kapinaset al.,
“Bone matrix osteonectin limits prostate cancer cell growth and survival,”
Matrix Biol., 31
(5), 299
–307
(2012). http://dx.doi.org/10.1016/j.matbio.2012.03.002 MTBOEC 0945-053X Google Scholar
P. J. CampagnolaC. Y. Dong,
“Second harmonic generation microscopy: principles and applications to disease diagnosis,”
Lasers Photonics Rev., 5
(1), 13
–26
(2011). http://dx.doi.org/10.1002/lpor.v5.1 1863-8880 Google Scholar
R. Cicchiet al.,
“Basal cell carcinoma imaging and characterization by multiple nonlinear microscopy techniques,”
Biophys. J., 157A 054007
(2007). BIOJAU 0006-3495 Google Scholar
E. B. Brownet al.,
“In vivo measurement of gene expression, angiogenesis and physiological function in tumors using multiphoton laser scanning microscopy,”
Nat. Med., 7
(7), 864
–868
(2001). http://dx.doi.org/10.1038/89997 1078-8956 Google Scholar
X. Hanet al.,
“Second harmonic properties of tumor collagen: determining the structural relationship between reactive stroma and healthy stroma,”
Opt. Express, 16
(3), 1846
–1859
(2008). http://dx.doi.org/10.1364/OE.16.001846 OPEXFF 1094-4087 Google Scholar
S. Y. Chenet al.,
“In vivo virtual biopsy of human skin by using noninvasive higher harmonic generation microscopy,”
IEEE J. Sel. Topics Quantum Electron., 16
(3), 478
–492
(2010). http://dx.doi.org/10.1109/JSTQE.2009.2031987 IJSQEN 1077-260X Google Scholar
S. J. Linet al.,
“Discrimination of basal cell carcinoma from normal dermal stroma by quantitative multiphoton imaging,”
Opt. Lett., 31
(18), 2756
–2758
(2006). http://dx.doi.org/10.1364/OL.31.002756 OPLEDP 0146-9592 Google Scholar
J. Aduret al.,
“Recognition of serous ovarian tumors in human samples by multimodal nonlinear optical microscopy,”
J. Biomed. Opt., 16
(9), 096017
(2011). http://dx.doi.org/10.1117/1.3626575 JBOPFO 1083-3668 Google Scholar
M. Strupleret al.,
“Second harmonic imaging and scoring of collagen in fibrotic tissues,”
Opt. Express, 15
(7), 4054
–4065
(2007). http://dx.doi.org/10.1364/OE.15.004054 OPEXFF 1094-4087 Google Scholar
W. Sunet al.,
“Nonlinear optical microscopy: use of second harmonic generation and two-photon microscopy for automated quantitative liver fibrosis studies,”
J. Biomed. Opt., 13
(6), 064010
(2008). http://dx.doi.org/10.1117/1.3041159 JBOPFO 1083-3668 Google Scholar
G. P. Kwonet al.,
“Contribution of macromolecular structure to the retention of low-density lipoprotein at arterial branch points,”
Circulation, 117
(22), 2919
–2927
(2008). http://dx.doi.org/10.1161/CIRCULATIONAHA.107.754614 CIRCAZ 0009-7322 Google Scholar
T. T. Leet al.,
“Label-free molecular imaging of atherosclerotic lesions using multimodal nonlinear optical microscopy,”
J. Biomed. Opt., 12
(5), 054007
(2007). http://dx.doi.org/10.1117/1.2795437 JBOPFO 1083-3668 Google Scholar
S. J. Linet al.,
“Evaluating cutaneous photoaging by use of multiphoton fluorescence and second-harmonic generation microscopy,”
Opt. Lett., 30
(17), 2275
–2277
(2005). http://dx.doi.org/10.1364/OL.30.002275 OPLEDP 0146-9592 Google Scholar
T. AbrahamJ. Hogg,
“Extracellular matrix remodeling of lung alveolar walls in three dimensional space identified using second harmonic generation and multiphoton excitation fluorescence,”
J. Struct. Biol., 171
(2), 189
–196
(2010). http://dx.doi.org/10.1016/j.jsb.2010.04.006 JSBIEM 1047-8477 Google Scholar
A. M. Penaet al.,
“Three-dimensional investigation and scoring of extracellular matrix remodeling during lung fibrosis using multiphoton microscopy,”
Microsc. Res. Tech., 70
(2), 162
–170
(2007). http://dx.doi.org/10.1002/jemt.v70:2 MRTEEO 1059-910X Google Scholar
X. Chenet al.,
“Second harmonic generation microscopy for quantitative analysis of collagen fibrillar structure,”
Nat. Protoc., 7
(4), 654
–669
(2012). http://dx.doi.org/10.1038/nprot.2012.009 NPARDW 1754-2189 Google Scholar
M. Unser,
“Texture classification and segmentation using wavelet frames,”
IEEE Trans. Image Process., 4
(11), 1549
–1560
(1995). http://dx.doi.org/10.1109/83.469936 IIPRE4 1057-7149 Google Scholar
T. ChangC. C. J. Kuo,
“Texture analysis and classification with tree-structured wavelet transform,”
IEEE Trans. Image Process., 2
(4), 429
–441
(1993). http://dx.doi.org/10.1109/83.242353 IIPRE4 1057-7149 Google Scholar
W. H. Kimet al.,
“Multi-resolutional shape features via non-Euclidean wavelets: applications to statistical analysis of cortical thickness,”
Neuroimage, 93 107
–123
(2014). http://dx.doi.org/10.1016/j.neuroimage.2014.02.028 NEIMEF 1053-8119 Google Scholar
M. J. Koehleret al.,
“Morphological skin ageing criteria by multiphoton laser scanning tomography: non-invasive in vivo scoring of the dermal fibre network,”
Exp. Dermatol., 17
(6), 519
–523
(2008). http://dx.doi.org/10.1111/j.1600-0625.2007.00669.x EXDEEY 0906-6705 Google Scholar
Y. C. Wuet al.,
“Scanning all-fiber-optic endomicroscopy system for 3D nonlinear optical imaging of biological tissues,”
Opt. Express, 17
(10), 7907
–7915
(2009). http://dx.doi.org/10.1364/OE.17.007907 OPEXFF 1094-4087 Google Scholar
R. Cicchiet al.,
“Scoring of collagen organization in healthy and diseased human dermis by multiphoton microscopy,”
J. Biophotonics, 3
(1–2), 34
–43
(2010). http://dx.doi.org/10.1002/jbio.200910062 JBOIBX 1864-063X Google Scholar
J. Aduret al.,
“Second harmonic generation microscopy as a powerful diagnostic imaging modality for human ovarian cancer,”
J. Biophotonics, 7
(1–2), 37
–48
(2014). http://dx.doi.org/10.1002/jbio.v7.1/2 JBOIBX 1864-063X Google Scholar
R. Ambekaret al.,
“Quantifying collagen structure in breast biopsies using second-harmonic generation imaging,”
Biomed. Opt. Express, 3
(9), 2021
–2035
(2012). http://dx.doi.org/10.1364/BOE.3.002021 BOEICL 2156-7085 Google Scholar
D. T. Funget al.,
“Second harmonic generation imaging and Fourier transform spectral analysis reveal damage in fatigue-loaded tendons,”
Ann. Biomed. Eng., 38
(5), 1741
–1751
(2010). http://dx.doi.org/10.1007/s10439-010-9976-7 ABMECF 0090-6964 Google Scholar
M. W. Conklinet al.,
“Aligned collagen is a prognostic signature for survival in human breast carcinoma,”
Am. J. Pathol., 178
(3), 1221
–1232
(2011). http://dx.doi.org/10.1016/j.ajpath.2010.11.076 AJPAA4 0002-9440 Google Scholar
M. VarmaA. Zisserman,
“Unifying statistical texture classification frameworks,”
Image Vis. Comput., 22
(14), 1175
–1183
(2004). http://dx.doi.org/10.1016/j.imavis.2004.03.012 IVCODK 0262-8856 Google Scholar
W. Zhenget al.,
“Diagnostic value of nonlinear optical signals from collagen matrix in the detection of epithelial precancer,”
Opt. Lett., 36
(18), 3620
–3622
(2011). http://dx.doi.org/10.1364/OL.36.003620 OPLEDP 0146-9592 Google Scholar
|
|||||||||||||||||||||||||||||||||||||||||||||||||||||


