|
|
1.IntroductionThalassemia comprises a group of genetic disorders of hemoglobin (Hb) synthesis, and it affects individuals from many parts of the world, including South China, where it has a high prevalence and incidence and has caused serious health damage. Conservative estimates show that at least 345 million people around the world carry the genes responsible for this disease.1 In China, the rates of gene carriers are as high as 24.50% and 11.07% in the population of Guangxi and Guangdong provinces, respectively.2,3 This serious disorder is caused by partial or total mutations that reduce or abolish the synthesis of - or -globin chains of the Hb molecule, which will result in hemolytic anemia. At present, the disease cannot be cured, except through hematopoietic stem cell transplantation.4 The most fundamental prevention methods include premarital and prenatal thalassemia screening in a large population. Heterozygote screening and genetic counseling are essential for preventing and controlling severe thalassemia.5 The ultimate diagnosis for the different types of thalassemia depends on DNA analysis using the polymerase chain reaction.6 However, a direct DNA approach without a precise biochemical hematological indication is highly time consuming, is expensive, and often subjects to false-negative results or misinterpretations. The complex relationship between the genotype and phenotype makes diagnosis difficult. Thus, a combination of different tests is required for accurate diagnosis. The fundamental test for thalassemia is hematological phenotype screening.1,7,8 First, two main hematological parameters, the mean corpuscular Hb (MCH) and mean corpuscular volume (MCV), are screened. Following this, Hb analysis is further performed on the basis of the parameters of total Hb, HbF, and to classify the condition into - or -thalassemia. DNA analysis is an accurate and comprehensive method of thalassemia screening, but this approach is relatively complicated and is not suitable for screening large populations. MCH and MCV are preliminary screening parameters for thalassemia that can effectively evaluate microcytic hypochromic anemia in a large population. The discrimination threshold (cut-off value) of the measured MCH or MCV values is determined on the basis of the highest sum of sensitivity and specificity for discriminating phenotype-positive subjects from phenotype-negative subjects. In the conventional method, the cut-off values corresponding to MCH and MCV are 27.0 pg and 80.0 fL, respectively.1,4 Phenotype-positive subjects for thalassemia are those with or . Individuals with low MCH or MCV ( or ) are usually further assessed using Hb and DNA analyses for identifying the type of defect. At present, Hb, MCH, MCV, and other red blood cell indicators are mainly measured by using a blood cell analyzer, which uses an electrical impedance method to perform blood cell count and volume measurement. The blood cell analyzer needs ancillary reagents, such as electrolyte solution and hemolytic agent. Therefore, this procedure is relatively complicated because it requires chemical reagents. Other label-free optical methods like quantitative digital holographic phase microscopy9 also discussed the measurement of thalassemia screening indicators MCH and MCV; however, this method needs sample pretreatment. A rapid, simple, and reagent-free method may help in premarital and prenatal thalassemia screening in population prevention and control programs. The application of spectroscopy for thalassemia screening, particularly in the mid-infrared (MIR) region, was desirable as a high potential implementation. Actually, the MIR spectrum has rich information on the molecular structure and contents of the material, which could be used to determine the molecular structure of a protein. However, the interference caused by the strong absorption of water molecules in the MIR region is the main difficulty in the use of MIR for direct measurement of biological samples (e.g., blood). Therefore, complex preparation and handling of samples are always required; this process is neither rapid nor simple. The described difficulty associated with the handling of biological samples has been circumvented by developing the attenuated total reflection (ATR) technique.10 Incidentally, parallel to the development of Fourier transform infrared (FTIR) spectrometers and the ATR technique,10 the spectroscopic method using FTIR equipped with an ATR accessory (FTIR/ATR) provides substantial potential as a quantitative tool based on the molecular structure and on the interactions between the molecule and its environments. In this case, the MIR absorption of water molecules is greatly reduced, and the MIR spectra generated with the ATR method could be used for direct measurement of samples that contain water molecules. The FTIR/ATR technique has been extensively applied in the areas of life sciences, clinical medicine, and others.11–19 Literature18 first reported a method for infrared spectroscopic identification of -thalassemia based on hemoglobin samples. Literature19 proposed a FTIR/ATR quantitative analysis method of thalassemia screening indicators (MCV, MCH) based on haemolysate samples. Their results show that the MIR spectrum can reflect molecule absorbance information of thalassemia gene mutations. However, both of the above methods need complex sampling and are not direct determination methods. The application of FTIR/ATR spectroscopy for reagent-free direct measurement of hematological parameters for thalassemia screening (i.e., Hb, MCH, and MCV) has not been proposed until date. MCH refers to the average Hb in individual erythrocytes, and it is equivalent to the ratio of the amount of Hb and the number of erythrocytes per unit volume. Combining with chemometric methods, Hb levels can be predicted via FTIR/ATR spectroscopy16; MCH also could be corresponded to FTIR/ATR spectral absorption. MCV, which refers to the average volume of individual erythrocytes, is not directly corresponding to the absorption of FTIR/ATR spectrum. However, clinical examination results show a significant correlation between MCV and MCH (refer to the results presented behind), so MCV could indirectly correspond to the absorption of the FTIR/ATR spectrum. Therefore, the three indicators have the mechanism of quantitative analysis by using the FTIR/ATR method. In the present study, we aimed to confirm the feasibility of quantitative analysis of MCH and MCV with FTIR/ATR spectroscopy. Human blood is a complex system with multiple components; therefore, spectroscopic analysis of some components in human blood must mitigate noise disturbance from its other components. An appropriate spectral wavenumber selection method is important for rapid and chemical-free measurement of a complex system using FTIR/ATR spectroscopy; however, this is a difficult aspect. Therefore, it is essential to improve the effectiveness of spectral prediction, reduce the complexity of the method, and design a specialized spectrometer with a high signal-to-noise ratio (SNR). Furthermore, appropriate chemometric methods must be utilized for optimizing the wavenumber. Partial least squares (PLS) regression is a popular multivariate calibration method that has been widely applied in multicomponent spectral analysis, particularly in vibrational spectroscopy such as MIR. It could be used to comprehensively screen spectroscopic data, extract information variables, and overcome spectral colinearity. The moving window PLS (MW-PLS) method is an effective method of spectral analysis and has a high prediction capability.20–25 In the present study, the MW-PLS method was improved in terms of stability and equivalence. The appropriate MIR wavebands for the reagent-free simultaneous measurement of Hb, MCH, and MCV in human peripheral blood samples were selected, which correspond to the preliminary thalassemia screening. The stability of the spectrum analysis model is very important in actual practice. Numerous experiments have shown that differences in the partitioning of calibration and prediction sets can result in fluctuations in predictions and parameters, thereby generating unstable results.23–25 In the present study, a rigorous process of calibration, prediction, and validation based on randomness and stability was performed to achieve the goal of spectroscopic analysis. Initially, some samples were randomly selected as a validation set and were not subjected to the modeling optimization process. The remaining samples were used as modeling samples and were further divided several times into calibration and prediction sets. Thereafter, to obtain a stable result, optimal models of the MW-PLS method were selected on the basis of different divisions of the calibration and prediction sets in the modeling array. To solve the restrictions of position and size of wavebands caused by costs and material properties in the instrument design, the set that includes various wavebands that are equivalent to the optimal MW-PLS waveband was then proposed for each indicator. Finally, the selected models were revalidated against the validation set. 2.Materials and Methods2.1.Experimental Materials, Instruments, and Measurement MethodsIn total, 380 human peripheral blood samples were collected and placed in 0.2% ethylenediaminetetraacetic acid-containing tubes. Hb, MCH, and MCV values of these samples were measured via a routine clinical method using a BC-3000Plus blood cell analyzer (Shenzhen Mairui Ke Technology Co., Ltd., China). The data measured by the apparatus were used in the calibration, prediction, and validation sets as reference values for spectroscopic analysis. Statistical analysis of the measured values of the 380 samples for the three indicators Hb, MCH, and MCV is shown in Table 1. Based on the cut-off values of MCH and MCV, 200 samples were negative and 180 were positive. Table 1Statistical analysis of measured Hb, mean corpuscular Hb (MCH), and mean corpuscular volume (MCV) values of 380 human peripheral blood samples.
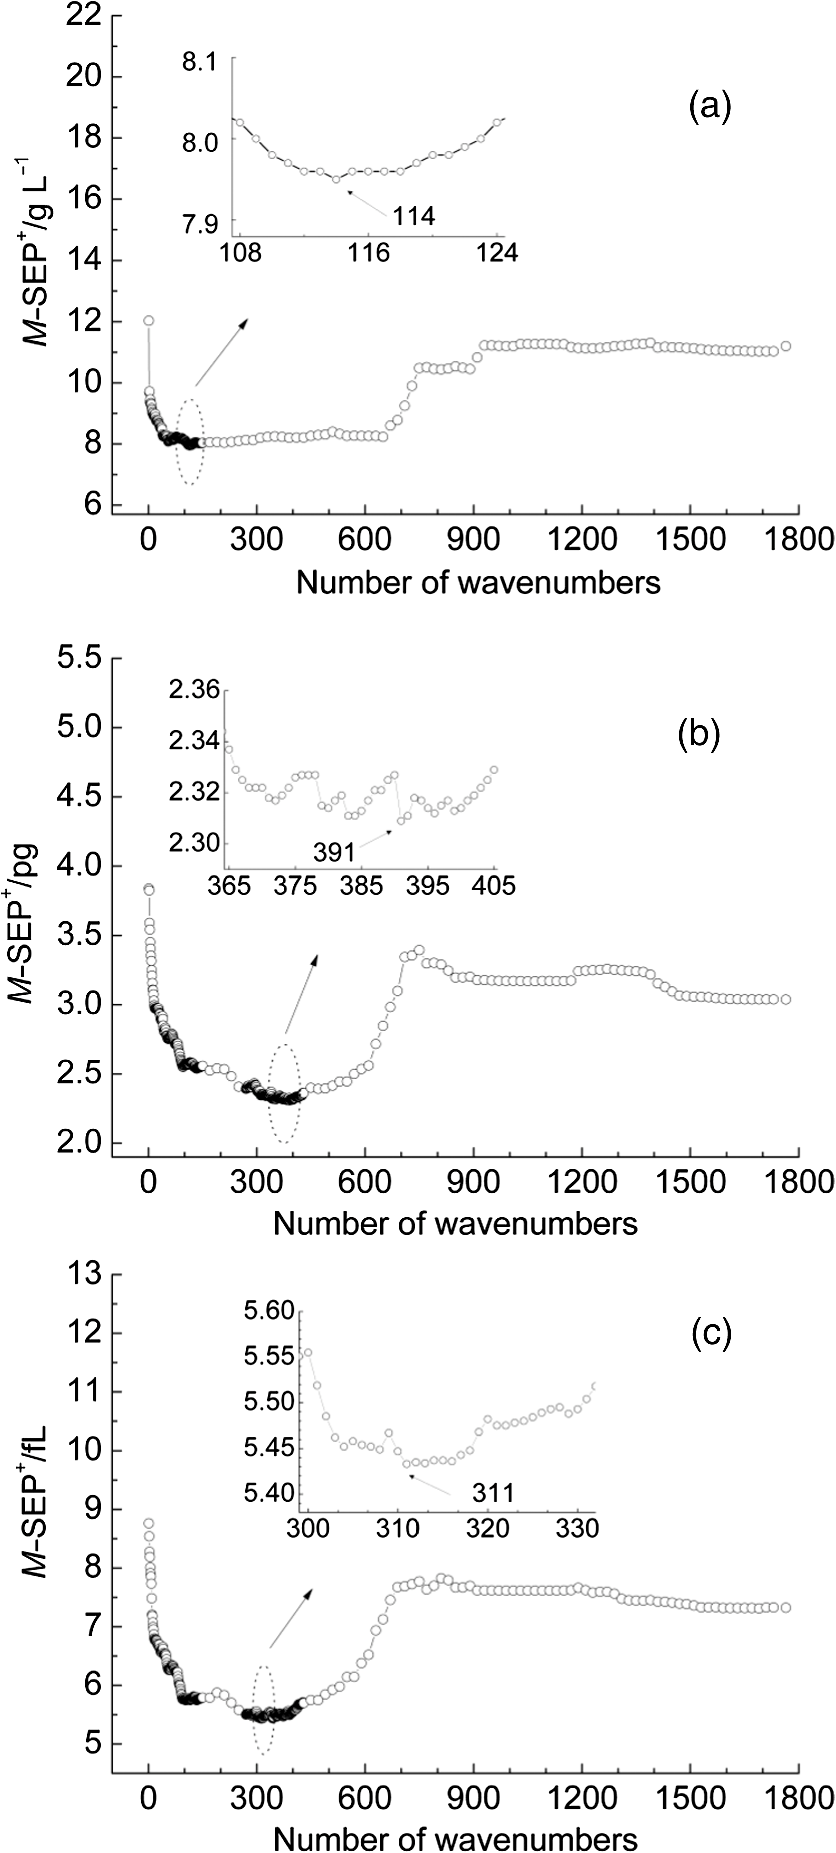
Note: SD is the abbreviation of standard deviation. Spectra were collected using a VERTEX 70 FTIR Spectrometer (BRUKER Co., Germany) equipped with a KBr beam splitter and a deuterated triglycine sulfate KBr detector. The MIR spectra were obtained from 4000 to using a horizontal ATR sampling accessory with a diamond internal reflection element on a zinc selenide crystal (SPECAC Co., UK). Thirty-two scans of symmetrical interferograms at resolution were added to each spectrum. The instrument was allowed to purge for several minutes prior to the acquisition of spectra for minimizing the spectral contribution from atmospheric water vapor. Each peripheral blood sample (0.075 mL) was measured thrice, and the mean value of the measurements was used for modeling and validation. The spectra were measured at and 46% RH; the time of acquisition of an FTIR/ATR spectrum was about 1 min. 2.2.Attenuated Total ReflectionThe design of an ATR accessory is based on the principle of internal reflection of light. Infrared light that is emitted by a light source through a crystal with a large refractive index can be projected onto the sample surface using a small refractive index; total reflection occurs when the angle of incidence is greater than the critical angle. Actually, an attenuated evanescent wave is formed on the contact surface; therefore, not all the infrared light is reflected back; however, it partially penetrates to a certain depth beneath the surface of the specimen and then returns to the surface. During this process, the sample selectively absorbs the resulting incident light frequency region as the intensity of the reflected light is decreased, which then generates a spectrogram that is similar to a transmission absorption spectrogram. The penetration depth of the evanescent wave is significantly less than the optical path of ordinary transmission accessories. As shown in Fig. 1, when the refractive index of medium 1 (reflecting element) is greater than the refractive index of medium 2 (sample) and the incident angle is greater than the critical angle (), the incident light was totally reflected. In fact, infrared light is reflected after penetrated to a certain depth beneath the sample surface. According to Maxwell’s theory, the penetration depth is defined as follows: where is the wavelength of infrared light in the reflected medium. The value depends on the infrared wavelength, the refractive indexes of reflecting element and sample, and the incident angle. From Eq. (1), we can estimate that and have approximately equal magnitude, whereas the commonly used MIR wavelength is ranged from 2.5 to .2.3.Sensitivity and Specificity for ThalassemiaSensitivity and specificity are two evaluation indicators in clinical diagnostic tests that are used for quantitative recognition of patients and nonpatients. In the present study, a new approach for quantitative analysis of thalassemia based on the simultaneous determination of Hb, MCH, and MCV using FTIR/ATR spectra was established. Therefore, the sensitivity and specificity values of the new approach must be evaluated using the existing standard clinical biochemistry method. According to the cut-off values of MCH and MCV for thalassemia, the number of true-positive, false-negative, false-positive, and true-negative samples was , , , and , respectively. Therefore, the sensitivity and specificity values of the spectroscopic analysis method used in this study were calculated as follows: 2.4.Sample Set Division and the Calibration, Prediction, and Validation ProcessA new framework was developed for the calibration, prediction, and validation process and sample division on the basis of randomness and stability. Some samples were randomly selected from all samples as validation samples and were not subjected to the modeling optimization process. The remaining samples were used as modeling samples and were divided multiple times into calibration and prediction sets. For obtaining objective and stable results, calibration and prediction models were established for all divisions of the sample sets, and model parameters were optimized depending on the mean prediction effects of all divisions. All the calibration, prediction, and validation sets must contain negative and positive samples to ensure modeling representativeness and integrity. Therefore, the negative and positive samples must be divided into calibration, prediction, and validation sets. The following specific procedure was followed. First, 64 of the 200 negative samples were randomly selected as the validation set. The remaining 136 samples were used as modeling samples and were further randomly divided 200 times into calibration (68 samples) and prediction (68 samples) sets. Second, 86 of the 180 positive samples were randomly selected as the validation set. The remaining 94 samples were used as modeling samples and were also further randomly divided 200 times into calibration (47 samples) and prediction (47 samples) sets. Finally, the positive and negative samples used for validation were merged into a single validation set (150 samples). Similarly, the positive and negative samples used for calibration and prediction were merged into whole calibration (115 samples) and prediction (115 samples) sets for each division, respectively. Figure 2 shows the type and number of samples in the calibration, prediction, and validation sets. Calibration and prediction were performed for each division , . The root mean square errors and the correlation coefficients for prediction in the modeling set are denoted as and , respectively. Calculation formulas are as follows: where was the number of prediction samples; and were the measured and predicted values for ’th division and ’th prediction sample, respectively; and were the mean measured value and mean predicted value of all prediction samples for ’th division, respectively.The mean value and the standard deviation (SD) of the and of all the divisions were denoted as , , , and , respectively. Calculation formulas are as follows: These values were used for evaluation of modeling prediction accuracy and stability. The equation was used as a comprehensive indicator of modeling prediction accuracy and stability of a model. A smaller value of indicated higher accuracy and stability of the model. The model parameters were selected for achieving a minimum . The selected model was then revalidated against the validation set. The root mean square error and correlation coefficients of prediction in the validation set were then calculated and denoted as and , respectively. The calculation formulas are as follows: where was the number of validation samples; and were the measured and predicted values of ’th validation samples; and were the mean measured values and mean predicted values of all validation samples.Quantitative analyses of Hb, MCH, and MCV were independently performed on the basis of the same modeling process mentioned earlier. The selections of wavebands for three indicators were obtained independently. 2.5.Optimization Frame of the Improved MW-PLS Method with StabilityFor the MW-PLS method, consecutive spectral data on adjacent wavenumbers were designated as a window. For all the windows in a predetermined search region of the spectrum, PLS models were established, and the optimal analytical wavebands were selected by moving and varying the window size (see also Fig. 3). By considering the position and length of the wavebands as well as the PLS factor, the search parameters were set as follows: (1) initial wavenumber (), (2) number of wavenumbers (), and (3) number of PLS factors ().23–26 The search range of the parameters , , and can be selected according to the actual chemical, physical, and statistical significance. PLS models can be established for any combination of (, , and ) depending on different divisions of calibration and prediction sets. The corresponding , , , , and values were then calculated. For achieving stable results, the optimal waveband with minimum was selected. 2.6.Selection of the Number of PLS Factors for StabilityPLS regression can comprehensively screen spectroscopic data, extract information variables, and overcome spectral colinearity. The number of PLS factors () is an important parameter that corresponds to the number of integrated spectral variables corresponding to sample information. The selection of a reasonable is necessary as well as difficult. In the present study, was selected by considering the number of divisions of the calibration and prediction sets. Thus, the optimum number of PLS factors exhibited stability and practicality. Each waveband corresponded to a unique combination of parameters ; the optimal PLS model of the waveband was selected according to the following expression: and the corresponding , , , and were determined.2.7.Global Optimal ModelThe global optimal model was selected according to the following equation: and the corresponding , , , and were determined.2.8.Local Optimal Model Corresponded to a Single ParameterThe instrument design typically involves some limitations of position and number of wavenumbers (such as costs and material properties). At some instances, the demand of actual conditions is not met by the global optimal waveband. Therefore, local optimal wavebands that correspond to different positions and the number of wavelengths are significant. For any fixed , the local optimal model was selected according to the following equation: and the corresponding , , , and were determined. Meanwhile, for any fixed , the local optimal model was selected according to the following expression: and the corresponding , , , and values were determined.In the present study, the search range for the MW-PLS method spanned the entire scanning region of 4000 to with 1764 wavenumbers. Furthermore, and were set as follows: and for Hb, MCH, and MCV. To reduce the workload and maintain representativeness, was set as follows: , , for Hb, MCH, and MCV, respectively. With as an example, Fig. 3 shows a schematic diagram for the waveband and screening mode for moving windows. The computer algorithms for the abovementioned method were designed using the MATLAB 7.6 version software. 3.Results and Discussion3.1.Global Optimal Models Using the MW-PLS MethodThe FTIR/ATR spectra of the 380 human peripheral blood samples on the overall scanning region of 4000 to are shown in Fig. 4. For comparison, the spectrum of distilled water is represented by a dotted line in Fig. 4. Figure 4 had a red dotted line and 380 black solid lines, where the red dotted line was the spectrum of distilled water, and the black solid lines were the spectra of 380 samples of human peripheral blood. Figure 4 shows that the water molecules had an absorption within the range of 3290 and , the absorption of hemoglobin composition and other blood components mainly appeared within the MIR fingerprint region 1800 to , and different samples had significantly different ranges of absorption in the fingerprint region. Fig. 4FTIR/ATR spectra of 380 human peripheral blood samples in the entire scanning region (4000 to ). 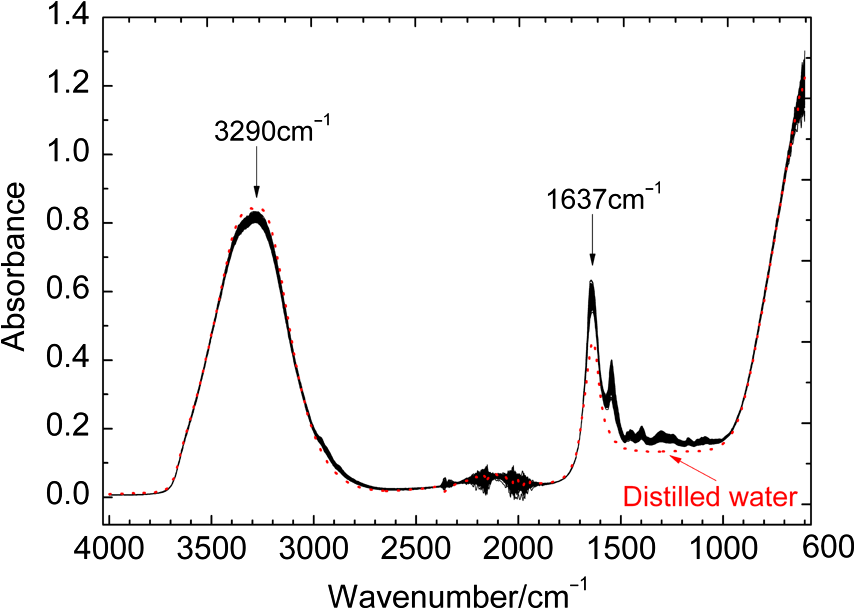 Using the previously mentioned method, PLS models for Hb, MCH, and MCV were first established on the basis of the entire scanning region. The prediction accuracy and stability results (, , , , and ) are summarized in Table 2. The results show that the predicted and clinically measured values have a certain correlation for each indicator. The number of wavenumbers employed was 1764, and the models showed high complexity. Further waveband optimization was performed using the MW-PLS method to improve the prediction accuracy and to reduce complexity. Depending on the minimum value, the optimal MW-PLS models were selected for Hb, MCH, and MCV. The corresponding parameters , , and and the prediction effects are summarized in Table 2. The results show that the optimal values of and are and 114 for Hb, and 391 for MCH, and and 311 for MCV, respectively. The corresponding waveband intervals were 1722 to for Hb, 1653 to for MCH, and 1562 to for MCV, all of which were within the MIR fingerprint region. The number of wavenumbers for the three wavebands was all less than one-fourth of that for the entire scanning region. Therefore, the model complexity was reduced for each indicator. Table 2 shows that the five values of the prediction effects (, , , , and ) of the optimal MW-PLS models were all significantly better than those of the overall scanning region for each indicator. Thus, the prediction accuracy and stability of the optimal MW-PLS models were significantly improved. Table 2Modeling prediction accuracy and stability of PLS models based on the entire scanning region, the optimal MW-PLS wavebands, and the equivalent wavebands for Hb, MCH, and MCV.
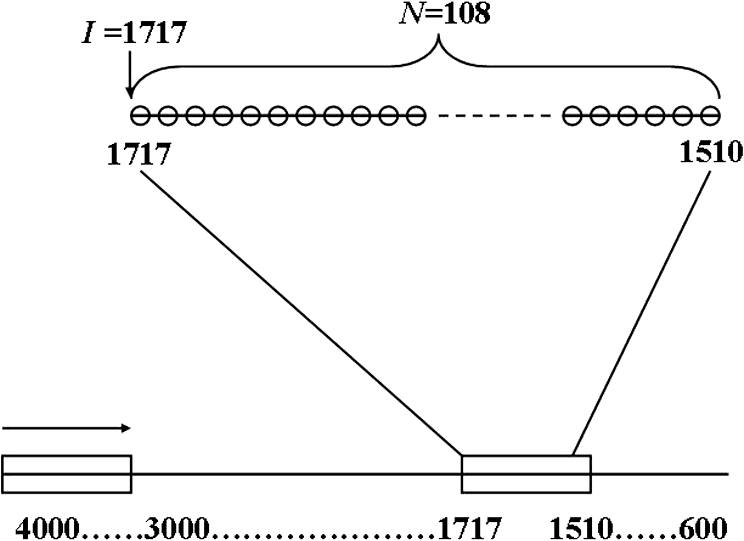
3.2.Local Optimal Modelsvalues of the local optimal models, which correspond to each and , are shown in Figs. 5 and 6 for the three indicators. Figures 5(a) and 6(a) show the minimum achieved for Hb when () and . Figures 5(b) and 6(b) show the minimum achieved for MCH when () and . Figures 5(c) and 6(c) show the minimum achieved for MCV when () and . The results indicate that these parameters have the best prediction accuracy and stability. These data may serve as a valuable reference for designing the splitting system of spectroscopic instruments. Some local optimal models whose prediction parameters are close to that of the global optimal model remain a good choice. These models address restrictions such as cost and material properties as well as the position and number of wavenumbers in the instrument design. 3.3.Model Set with EquivalenceAs mentioned, the optimal MW-PLS wavebands for Hb, MCH, and MCV were screened according to the minimum , and the obtained minimum values were for Hb, 2.309 pg for MCH, and 5.433 fL for MCV. However, statistically speaking, because modeling samples are random and limited, the models with slightly fluctuating prediction accuracy are considered equivalent. Therefore, the optimal could float upward at an appropriate range (take 0.6%, for example, in the present report; the upward range could be adjusted accordingly). For the Hb indicator, the minimum floated upward from 7.96 to ; the model set included 75 wavebands that were equivalent to the optimal MW-PLS waveband, all of which were within the MIR fingerprint region, and the corresponding and were 108 and 122, respectively. The public range of the 75 equivalent wavebands was from 1717 to , with 108 wavenumbers, and just one of the equivalent wavebands had the lowest . Thus, the waveband 1717 to can be employed instead of other equivalent wavebands, which contained enough information on Hb. For the MCH indicator, the minimum floated upward from 2.309 to 2.323 pg; the model set included 79 wavebands that were equivalent to the optimal MW-PLS waveband, all of which were within the MIR fingerprint region. The and were 343 and 403; the and were 1562 and ; and the minimum and maximum ending wavenumber were 874 and , respectively. For the MCV indicator, the minimum floated upward from 5.433 to 5.466 fL; the model set included 53 wavebands that were equivalent to the optimal MW-PLS waveband, all of which were within the MIR fingerprint region. The and were 303 and 347; the and were 1562 and ; and the minimum and maximum ending wavenumbers were 897 and , respectively. Interestingly, the equivalent model sets of MCH and MCV showed the same waveband range of 1562 to ; thus, this waveband range can be used for the simultaneous quantification of MCH and MCV. In fact, the present study aimed to confirm the feasibility of quantitatively analyzing Hb, MCH, and MCV using FTIR/ATR spectroscopy. FTIR/ATR spectroscopy cannot be used for direct measurement of MCV, which refers to the average volume of individual erythrocytes. However, clinical examination results show a significant correlation between MCV and MCH; the obtained correlation coefficients () of the measured MCH and MCV values for all 380 human peripheral blood samples reached 0.975 (Fig. 7). The correlation between MCV and MCH may be utilized for quantitative analysis of MCV using FTIR/ATR spectroscopy. Therefore, it is reasonable to select the public equivalent waveband range of 1562 to for MCH and MCV. Fig. 7Relationship between the measured values of MCH and MCV for 380 human peripheral blood samples.  The public waveband (1717 to ) of Hb equivalent wavebands and the public equivalent waveband (1562 to ) of MCH and MCV were used as the typical examples of equivalent model sets; the corresponding prediction accuracy and stability are shown in Table 2. The positions of all equivalent wavebands for Hb, MCH, and MCV and the corresponding are shown in Fig. 8. The equivalent model set provided various waveband selections and circumvented the restrictions of position and size of wavebands caused by costs and material properties in the instrument design. 3.4.Model ValidationThe randomly selected validation samples, which were excluded in the modeling optimization process, were used for validating the optimal MW-PLS wavebands (1722 to for Hb, 1653 to for MCH, and 1562 to for MCV) as well as the public waveband (1717 to ) of the Hb equivalent wavebands and the public equivalent waveband (1562 to ) of MCH and MCV. The regression coefficients were calculated using the spectral data and clinically measured values of the entire modeling set depending on the corresponding parameters. The predicted values of the validation samples were then calculated using the obtained regression coefficients and the spectra of the validation samples. The relationship between the predicted and clinically measured values of the 150 validation samples for Hb, MCH, and MCV is shown in Figs. 9 and 10, respectively. The evaluation values for validation ( and ) are summarized in Table 3. The results indicate that the six cases have high validation prediction accuracy. The prediction values of Hb, MCH, and MCV of the validation samples are close to those of the clinically measured values. Satisfactory validation effects were achieved for the random validation samples because stability was considered in the modeling optimization process. Fig. 9Relationship between the predicted and measured values of the validation samples for PLS models with the optimal MW-PLS wavebands: (a) to for Hb, (b) to for MCH, and (c) to for MCV.  Fig. 10Relationship between the predicted and measured values of the validation samples for PLS models with the equivalent wavebands: (a) to for Hb, (b) to for MCH, and (c) to for MCV.  Table 3Validation effects of PLS models based on the optimal MW-PLS wavebands and the equivalent wavebands for Hb, MCH, and MCV.
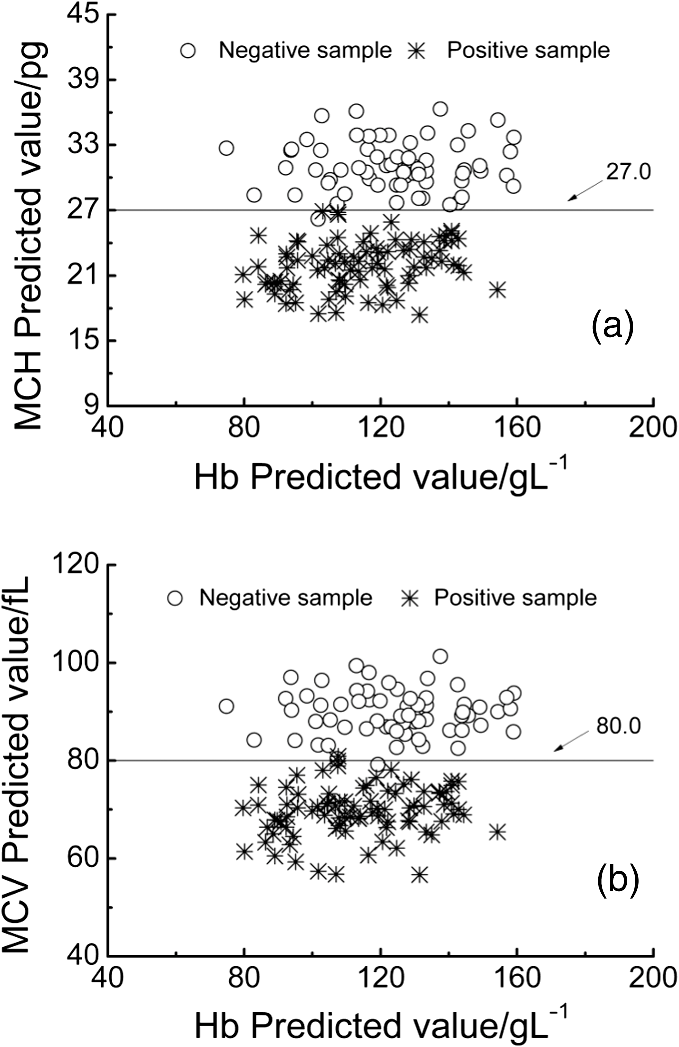
The classification of the negative and positive samples for thalassemia can be observed in the two-dimensional (2-D) diagram of (Hb, MCH) and (Hb, MCV). Among the 150 validation samples, 64 are negative and 86 are positive based on their clinical measured values and the cut-off line (; ; Fig. 11). Figures 12 and 13 show the 2-D diagram of the FTIR/ATR predicted values of the 150 validation samples, corresponding to the optimal MW-PLS wavebands and the equivalent wavebands, respectively. The sensitivity and specificity were 100.0% and 96.9% for the optimal MW-PLS wavebands and 100.0% and 95.3% for the equivalent wavebands, respectively. The sensitivity and specificity values for two cases were high, and the prediction errors were distributed primarily around the cut-off line. The region neighboring the cut-off line is blurry, and a few prediction errors in this region are understandable. The results also confirmed the feasibility of negative and positive screening of thalassemia samples that feature microcytic hypochromic anemia. Fig. 112-D diagrams for the clinical measured values of validation samples classified as negative and positive: (a) (Hb, MCH) and (b) (Hb, MCV).  4.ConclusionsThe main objective of the present study was to conduct preliminary thalassemia screening. A novel method for simultaneous quantitative analysis of Hb, MCH, and MCV was proposed using FTIR/ATR spectroscopy. In addition, a rigorous process of calibration, prediction, and validation based on randomness and stability was performed to generate objective and stable models. The key technology used in this study is the high SNR of the waveband selection technique that corresponds to the information on Hb, MCH, and MCV. The selections of appropriate wavebands were accomplished using the improved MW-PLS method in terms of stability and equivalence on the basis of different divisions of calibration and prediction sets. The obtained optimal MW-PLS wavebands were 1722 to for Hb, 1653 to for MCH, and 1562 to for MCV. A model set equivalent to the optimal MW-PLS model was proposed for each indicator; the obtained public waveband for the Hb equivalent wavebands was 1717 to , and the public equivalent waveband of MCH and MCV was 1562 to . All the waveband selections were within the MIR fingerprint region, and their models achieved high validation effects. The results confirm the feasibility of simultaneous quantitative analysis of Hb, MCH, and MCV using FTIR/ATR spectroscopy. The sensitivity and specificity were 100.0% and 96.9% for the optimal MW-PLS wavebands and 100.0% and 95.3% for the equivalent wavebands, respectively. Thus, spectral prediction was also highly accurate for determining negative and positive samples for thalassemia screening. This is a reagent-free and accurate determination technique that is simple and rapid in comparison with the conventional methods; thus, it is a promising tool for screening, diagnosing, preventing, and controlling thalassemia in large populations. The strategies used for the development of this method may be useful in studying other important parameters of thalassemia. The waveband selections also provide valuable references for designing specialized spectrometers. AcknowledgmentsThis work was supported by National Natural Science Foundation of China (No. 61078040), the Science and Technology Project of Guangdong Province of China (No. 2012B031800917), and the Science and Technology Project of Guangzhou of China (No. 2014Y2-00002). ReferencesR. GalanelloA. EleftheriouJ. Traeger-Synodinos, Prevention of Thalassaemias and Other Haemoglobin Disorders, Team up Creations Ltd., Nicosia Cyprus
(2003). Google Scholar
X. M. Xuet al.,
“The prevalence and spectrum of and thalassaemia in Guangdong Province: implications for the future health burden and population screening,”
J. Clin. Pathol., 57
(5), 517
–522
(2004). http://dx.doi.org/10.1136/jcp.2003.014456 AJCPAI 0002-9173 Google Scholar
F. Xionget al.,
“Molecular epidemiological survey of haemoglobinopathies in the Guangxi Zhuang Autonomous Region of southern China,”
Clin. Genet., 78
(2), 139
–148
(2010). http://dx.doi.org/10.1111/cge.2010.78.issue-2 CLGNAY 0009-9163 Google Scholar
X. M. XuX. H. ZhangL. L. Chen, Guidelines for Thalassemia Prevention and Control Programme, People’s Military Medical Press, Beijing
(2011). Google Scholar
H. NematiG. BahramiZ. Rahimi,
“Rapid separation of human globin chains in normal and thalassemia patients by RP-HPLC,”
Mol. Biol. Rep., 38
(5), 3213
–3218
(2011). http://dx.doi.org/10.1007/s11033-010-9994-4 MLBRBU 0301-4851 Google Scholar
S. Khatamiet al.,
“Globin chain synthesis is a useful complementary tool in the differential diagnosis of thalassemias,”
Hemoglobin, 31
(3), 333
–341
(2007). http://dx.doi.org/10.1080/03630260701462006 HEMOD8 0363-0269 Google Scholar
A. Caoet al.,
“Screening for thalassemia: a model of success,”
Obstet. Gynecol. Clin. North. Am., 29
(2), 305
–328
(2002). http://dx.doi.org/10.1016/S0889-8545(01)00006-7 OGCAE8 0889-8545 Google Scholar
S. LangloisJ. C. FordD. Chitayat,
“Carrier screening for thalassemia and hemoglobinopathies in Canada,”
J. Obstet. Gynaecol. Can., 30
(10), 950
–971
(2008). Google Scholar
B. Rappazet al.,
“Comparative study of human erythrocytes by digital holographic microscopy, confocal microscopy, and impedance volume analyzer,”
Cytometry Part A, 73
(10), 895
–903
(2008). http://dx.doi.org/10.1002/cyto.a.v73a:10 1552-4922 Google Scholar
F. M. MirabellaN. J. Harrick, Internal Reflection Spectroscopy: Review and Supplement, Harrick Scientific Corporation, New York
(1985). Google Scholar
G. W. LucassenG. N. van VeenJ. A. Jansen,
“Band analysis of hydrated human skin stratum corneum attenuated total reflectance Fourier transform infrared spectra in vivo,”
J. Biomed. Opt., 3
(3), 267
–280
(1998). http://dx.doi.org/10.1117/1.429890 JBOPFO 1083-3668 Google Scholar
K. Nakanishiet al.,
“Mid-Infrared Spectroscopic Measurement of Ionic Dissociative Materials in Metabolic Pathway,”
Appl. Spectrosc., 57
(12), 1510
–1516
(2003). http://dx.doi.org/10.1366/000370203322640152 APSPA4 0003-7028 Google Scholar
T. Panet al.,
“Development of a quantification system of ionic dissociative metabolites using an FT-IR/ATR method,”
Bioproc. Biosyst. Eng., 26
(2), 133
–139
(2003). http://dx.doi.org/10.1007/s00449-003-0343-z BBEIBV 1615-7591 Google Scholar
T. Panet al.,
“Mid-infrared spectroscopic quantification of ionic dissociative metabolites based on three spectral extraction methods,”
Jpn. J. Food Eng., 5
(1), 22
–31
(2004). Google Scholar
J. M. ChenT. PanX. D. Chen,
“The application of second derivative spectrum pretreatment to quantification measuring glucose-6-phosphate and fructose-6-phosphate using an FT-IR/ATR method,”
Opt. Precis. Eng., 14
(1), 1
–7
(2006). Google Scholar
H. Yinet al.,
“The rapid quantitative analysis for the human blood hemoglobin applied through the FTIR/ATR spectrum,”
Chin. J. Spectrosc. Lab., 26
(2), 431
–436
(2009). Google Scholar
A. Salmanet al.,
“Identification of fungal phytopathogens using Fourier transform infrared-attenuated total reflection spectroscopy and advanced statistical methods,”
J. Biomed. Opt., 17
(1), 017002
(2012). http://dx.doi.org/10.1117/1.JBO.17.1.017002 JBOPFO 1083-3668 Google Scholar
K. Z. Liuet al.,
“Infrared spectroscopic identification of -thalassemia,”
Clin. Chem., 49
(7), 1125
–1132
(2003). http://dx.doi.org/10.1373/49.7.1125 CLCHAU 0009-9147 Google Scholar
J. H. Wanet al.,
“A preliminary evaluation of attenuated total reflection Fourier transform infrared spectroscopy for the hematological analysis of thalassemias,”
Clin. Biochem., 46
(1–2), 128
–132
(2013). http://dx.doi.org/10.1016/j.clinbiochem.2012.10.001 CLBIAS 0009-9120 Google Scholar
Y. P. Duet al.,
“Spectral regions selection to improve prediction ability of PLS models by changeable size moving window partial least squares and searching combination moving window partial least squares,”
Anal. Chim. Acta, 501
(2), 183
–191
(2004). http://dx.doi.org/10.1016/j.aca.2003.09.041 ACACAM 0003-2670 Google Scholar
T. Panet al.,
“Near-infrared spectroscopy with waveband selection stability for the determination of COD in sugar refinery wastewater,”
Anal. Methods, 4
(4), 1046
–1052
(2012). http://dx.doi.org/10.1039/c2ay05856a AMNEGX 1759-9679 Google Scholar
T. PanZ. T. WuH. J. Chen,
“Waveband optimization for near-infrared spectroscopic analysis of total nitrogen in soil,”
Chin. J. Anal. Chem., 40
(6), 920
–924
(2012). Google Scholar
H. Z. Chenet al.,
“Waveband selection for NIR spectroscopy analysis of soil organic matter based on SG smoothing and MWPLS methods,”
Chemometr. Intell. Lab. Syst., 107
(1), 139
–146
(2011). http://dx.doi.org/10.1016/j.chemolab.2011.02.008 CILSEN 0169-7439 Google Scholar
Z. Y. Liuet al.,
“Determination of amino acid nitrogen in tuber mustard using near-infrared spectroscopy with waveband selection stability,”
Spectrochim. Acta A, 102 269
–274
(2013). http://dx.doi.org/10.1016/j.saa.2012.10.006 1386-1425 Google Scholar
T. PanM. M. LiJ. M. Chen,
“Selection method of quasi-continuous wavelength combination with applications to the near-infrared spectroscopic analysis of soil organic matter,”
Appl. Spectrosc., 68
(3), 263
–271
(2014). http://dx.doi.org/10.1366/13-07088 APSPA4 0003-7028 Google Scholar
J. Xieet al.,
“Joint optimization of savitzky-golay smoothing models and partial least squares factors for near-infrared spectroscopic analysis of serum glucose,”
Chin. J. Anal. Chem., 38
(3), 342
–346
(2010). http://dx.doi.org/10.1016/S1872-2040(09)60043-8 1872-2040 Google Scholar
BiographyXiaoli Long is a master’s student in optoelectronic engineering from the Department of Optoelectronic Engineering at Jinan University, Guangzhou, China. Guisong Liu is a master’s student in applied mathematics from the Department of Mathematics at Jinan University, Guangzhou, China. Tao Pan is a professor in the Department of Optoelectronic Engineering at Jinan University. He received his BS degree in mathematics from Sichuan University, China, and his PhD degree in biological information engineering from Mie University, Japan. He is director of the Applied Spectroscopy Laboratory ( http://jd.jnu.edu.cn/yxsz/detail.asp?id=24179) at Jinan University, College of Science and Engineering. He is engaged in studies of spectroscopy, biomedical information, chemometrics, pattern recognition, and partial differential equations. He has published more than 80 peer-reviewed papers. Jiemei Chen is associate professor in the Department of Biological Engineering at Jinan University. She received her BS and MS degrees in microbiology from Sichuan University and Guangxi University, China, and her PhD degree in biology from Mie University, Japan. She is engaged in studies of microbiology, spectroscopy, biomedical information, and so forth. She has published more than 50 peer-reviewed papers. |
|||||||||||||||||||||||||||||||||||||||||||||||||||||||||||||||||||||||||||||||||||||||||||||||||||||||||||||||||||||||||||||||||||||||||||||||||||||||||||||||||||||||||||||||||||||||||||||||||||||||||||||||||||||||||||||||||||||||||||||||||