
|
|
1.IntroductionComplex regional pain syndrome (CRPS) is a pain disorder characterized by severe and disproportionate pain, autonomic changes such as abnormal regulation of blood flow and sweating, edema of skin and subcutaneous tissues, motor disorders, and dystrophic changes. The pathophysiological mechanism of CRPS is still poorly understood, although our knowledge of this syndrome has increased significantly.1–3 Multiple factors, including vascular and microcirculatory dysfunction, neurogenic inflammation,4 and alteration in sympathetic and catecholaminergic function, as well as peripheral and central sensitization may all play important roles in the pathogenesis of this disabling syndrome.5 However, due to the connection between the microvascular blood supply and the development of neuropathic pain,6 microcirculatory parameters including rate and volume of blood flow and tissue oxygen saturation () are of considerable interest for potentially diagnosing CRPS and monitoring its progress. There is increasing evidence to show that inflammatory processes and immune reactions are involved in the pathophysiology of CRPS.7 In a systemic review and meta-analysis study, Parkitny et al.4 concluded that CRPS is associated with proinflammatory states in the blood, blister fluids, and cerebrospinal fluid. The CRPS-related inflammation may change the sympathetic tone of blood vessels and, therefore, affect blood supply and tissue oxygenation. The acute and chronic phases of CRPS demonstrate different inflammatory features in both clinical manifestations and inflammatory profiles. The measurement of microcirculatory parameters, such as blood flow rate, blood volume, and blood oxygen saturation (), can be used to potentially diagnose the presence of CRPS, to indicate the activity of the disease, and to monitor the effectiveness of the therapeutic intervention. In pain studies, traditional techniques for detecting microcirculatory parameters include functional magnetic resonance imaging (fMRI) and positron emission tomography (PET).8 However, both have limitations: fMRI makes indirect measurements by the blood-oxygenation-level dependent method9,10 or makes direct flow measurements with low sensitivity by the arterial spin labeling method;11 PET has to use radioactive tracers to measure blood flow directly.12 To overcome these limitations, optical methods provide alternative ways to make direct, sensitive, noninvasive, and nonionizing measurements of blood flow and in pain studies.13–16 Optical spectroscopic methods, such as near-infrared spectroscopy13 and micro-lightguide spectrophotometry,14 can provide noninvasive measurement of average blood flow and , but with poor spatial resolution. Optical coherence tomography and optical Doppler imaging15,16 provide blood vasculature anatomy imaging with high spatial resolution and sensitive measurements of flow speed, but lack high sensitivity for measuring because their imaging contrasts are based on optical scattering. Recently, photoacoustic microscopy (PAM) has emerged as a powerful modality for biomedical imaging.17–19 In PAM, tissue is irradiated by a short-pulsed laser beam. Some of the light is absorbed and partially converted to heat, which subsequently induces acoustic waves [termed photoacoustic (PA) waves] via thermoelastic expansion. Because hemoglobin has strong absorption in the visible spectral region, PAM has high sensitivity in blood vasculature anatomy imaging20 and flow imaging.21,22 In addition, because oxygenated hemoglobin () and deoxygenated hemoglobin (Hb) have different absorption spectra, PAM can also accurately measure . Thus, all the aforementioned microcirculatory parameters, including blood flow rate, blood volume, and blood oxygen saturation (), can be measured by PAM. So far, functional PAM has been successfully demonstrated in both animals23–25 and humans.26 The diagnosis of CRPS is based on clinical manifestations and there are limited laboratory tests or image studies to verify the diagnosis. With its high spatial resolution and label-free nature, PAM is potentially an ideal tool for monitoring and diagnosing CRPS by imaging peripheral blood perfusion. In this work, we performed a series of experiments to show the feasibility of this new imaging tool. 2.Methods2.1.SubjectsIn this prospective observational study, we screened patients with a possible diagnosis of CRPS-1, who were referred to the Pain Management Center of Washington University in St. Louis between January 2011 and December 2011. Nine adult patients (28 to 69 years old, six female, three male) with CRPS-1 were recruited. Patients with pain in only one upper extremity were selected to participate in the study. One patient withdrew from the study. Patients were considered to be candidates for the study if they were diagnosed with CRPS-1 by using the proposed new diagnostic criteria of the International Association for the Study of Pain.27 All patients signed consents to be involved in the study. All human research procedures were carried out in conformity with the protocol approved by the Institutional Review Board at Washington University in St. Louis. For all the patients, symptoms and signs of CRPS were present for less than one year. Average pain level was 5 or higher on a numerical rating score scale of 0 to 10 (with 0 being no pain and 10 being the worst imaginable pain). Exclusion criteria were pregnancy, coagulopathy, fever, general infection or local infection at the block puncture site, substance abuse, peripheral neuropathy, or any other diseases that may account for signs and symptoms mimicking CRPS. 2.2.ProceduresBenefits and risks of stellate ganglion block (SGB) were explained to the patients in detail. A written consent was obtained for the procedure. ASA standard monitors were applied during the procedure and postprocedure in the recovery room. The skin temperature of the hands was measured before and 10 min after the procedure. SGB on the cervical sympathetic chain was performed at the C7 vertebral level using the standard anterior paratracheal approach under fluoroscopic guidance. The patient was placed in the supine position with the head slightly hyperextended. The needle entry point was fluroscopically identified by anterior-posterior view at the junction of the C7 vertebral body and transverse process on the side of the diseased limb. Sterile techniques were used throughout the entire procedure. After sterilization and preparation, 1 to 3 ml of 1% lidocaine was used for skin infiltration at the needle entry point. Then a 10-mm, 25-gauge nerve block needle was inserted and advanced to the junction of the transverse process and the corresponding C7 vertebral body. Bony contact was made. The appropriate needle positioning was confirmed by anterior-posterior and lateral views. Once the needle was confirmed in the correct position fluoroscopically, aspiration was made for negative blood and other body fluids. Then a small amount (0.5 to 1 ml) of contrast dye was injected to visualize and prevent potential intravascular injection. After an adequate craniocaudal contrast dye spread from C5 to T1 was obtained, an injection of 10 ml of 0.25% bupivacaine with 1:200,000 epinephrine was given in 2-ml increments, with interval negative aspiration. The patient was observed in the recovery area for 15 min after the procedure. Skin temperature in the block side increased 10 min after SGB. Meanwhile, the pain level reduced by on discharge. The experimental paradigm consisted of two imaging sessions with an SGB between the sessions. For each patient, the back of their hand and the cuticle of the same hand were imaged before SGB (baseline) and then after SGB. Two sites [Fig. 1(B)] were chosen to image: superficial microvasculature at the cuticle and deeper and larger vessels at the back of the hand. Fig. 1(A) Schematic of the optical-resolution (OR-PAM) and acoustic-resolution photoacoustic microscopy (AR-PAM) systems. AL, acoustic lens; CL, conical lens; DAQ, data acquisition system; M, mirror; UT, ultrasound transducer. (B) Photograph of the hand, showing the scanned regions: (a) region scanned by AR-PAM and (b) region scanned by OR-PAM.  2.3.Photoacoustic MicroscopyAccording to its light illumination mechanism, PAM can be classified into two categories: acoustic-resolution (AR-) PAM and optical-resolution (OR-) PAM. In AR-PAM, the light is weakly focused and the lateral resolution is determined by the acoustic focusing of the ultrasonic transducer. In OR-PAM, the light is tightly focused, thus the lateral resolution is determined by the optical focusing provided by the objective. The axial resolution of both AR- and OR-PAM is determined by the bandwidth of the transducer used in the system. Usually optical focusing is much tighter than acoustic focusing, therefore, OR-PAM has a better lateral resolution than AR-PAM. However, since acoustic scattering is much weaker than optical scattering in soft tissue, AR-PAM can focus deeper than OR-PAM. To monitor hemodynamic changes with both high spatial resolution and deep penetration, both AR- and OR-PAM systems were used in this research. The schematics are shown in Fig. 1(A). In the AR-PAM system, a donut-shaped illumination is formed when light passes through the conical lens. A 20-MHz ultrasonic transducer collects the PA signals. In the OR-PAM system, light illumination and acoustic collection are achieved by an ultrasound-optical beam combiner. A 50-MHz ultrasonic transducer detects the PA signals. Each laser pulse generates a one-dimensional depth-resolved image (A-line) in both the AR- and OR-PAM systems. By two-dimensional (2-D) raster-scanning of the entire area, a three-dimensional (3-D) image can be acquired. For more accurate calculation in both AR- and OR-PAM systems, a photodiode compensates for the local fluence fluctuation. A detailed system description can be found in our previous papers.28–30 The lateral resolutions of the AR- and OR-PAM systems are 80 and , respectively. To measure , light at two wavelengths, 570 and 578 nm, was used in both AR- and OR-PAM. The PA signal from both wavelengths can be described as where denotes PA signal amplitude, and denote the first and second wavelengths, denotes a system-dependent constant, denotes the molar extinction coefficient, Hb denotes deoxygenated hemoglobin, denotes the oxygenated hemoglobin, and denotes the molar concentration. Based on Eqs. (1) and (2), we can solve for and . In the end, can be calculated as3.ResultsTypical AR- and OR-PAM hand images of patients are shown in Figs. 2 and 3, respectively. For fair comparisons, the distance between the patient’s hand and the ultrasonic transducer was adjusted to be the same before and after SGB for imaging. In AR-PAM, a by 6 mm field of view was scanned. Signals down to 1 mm deep were collected. Due to the high axial resolution of AR-PAM, we were able to differentiate signals from different depths. Maximum-amplitude-projection images along the depth direction, with ranges of 0.4 to 0.7 mm and 0.7 to 1.0 mm, are shown in Fig. 2. Two major differences can be easily seen: more blood vessels and stronger signals after the block. Because the local optical fluence fluctuation had been compensated for, the PA signal was mainly dependent on the absorption coefficient of the target. Thus, an increase in the PA signal indicates an increase in the local absorption coefficient, probably due to increased blood concentration or volume. Therefore, we suspect that there was increasing blood perfusion and blood vessel dilation after the block. Fig. 2Maximum amplitude projection (MAP) images of vasculature in the back of one patient’s hand by AR-PAM. MAP image in the depth range between 0.4 and 0.7 mm before block (a) and after block (b). MAP image in the depth range between 0.7 and 1 mm before block (c) and after block (d). NPA, normalized photoacoustic amplitude. 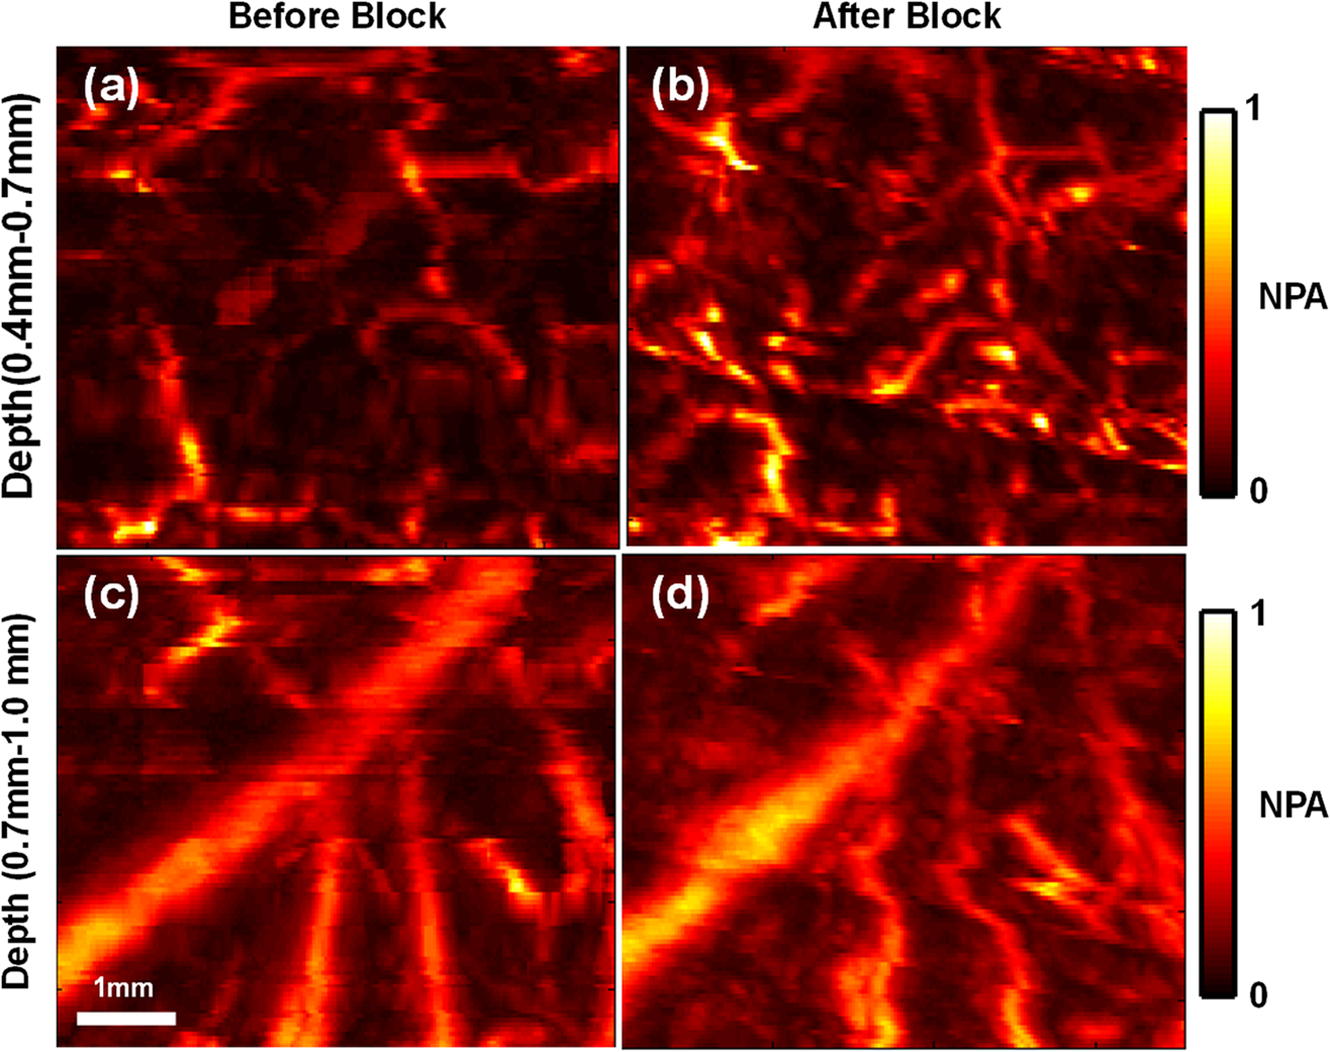 Fig. 3OR-PAM vasculature image of the fingertip of one patient. MAP of scanned region before block (a) and after block (b). The dashed box represents the region used for statistical analysis. (c) Close-up image of the capillary loop indicated by the arrow in (b).  Typical blood vessels in the finger cuticle imaged by OR-PAM are shown in Fig. 3. As indicated in Figs. 3(b) and 3(c), OR-PAM successfully imaged a single capillary loop, which is the smallest vessel in human blood circulation.31 As shown in Fig. 3(b), a stronger signal was found after the block which is consistent with the results from AR-PAM. Statistical analysis of all the patient data are shown in Fig. 4. Figure 4(a) shows the average increase in signal intensity at different depths after the block. On average, there was signal increase in all depth ranges. In addition, the signal increased most within the 0.1- to 0.4-mm depth range, where the capillary bed is located. Similar results from OR-PAM can be found in Fig. 4(c). According to the dual-wavelength measurement by AR-PAM, the average increased . 4.DiscussionCRPS-1 is a difficult clinical condition to diagnose and treat. Early diagnosis and management are necessary to prevent a long-standing or permanent disability. The diagnosis of CRPS-1 is primarily based on clinical observation and assessment of symptoms and signs, although a diagnostic algorithm has recently been proposed.32 A unique pathophysiological mechanism for CRPS-1 has not yet been established, therefore, sensitive and specific laboratory diagnostic parameters are lacking, resulting in difficulties in making valid diagnosis and distinguishing CRPS from other extremity pain entities. Several diagnostic procedures, such as bone scintigraphy, plain radiographs, quantitative sensory testing, skin temperature measurements, and fMRI are used to support the diagnosis of CRPS. However, they require pathognomonic markers. For example, the recommended three-phase bone scan demonstrated both cortical and cancellous osteopenia in CRPS patients and controls treated with casting.33 Meanwhile, there are no universally accepted tools to measure the effectiveness of treatment. It is known that CRPS is accompanied by impaired microcirculation of the affected tissue,34–36 such as vasoconstriction and reduced regional blood flow37 and oxygenation,14 which then leads to skin temperature change,34,38 pain, and atrophic changes. Thus, a direct noninvasive measurement of microcirculation is of considerable interest for accurate and early diagnosis of CRPS. PAM is shown to be a powerful tool for studying the microcirculatory system at the site of CRPS. In the presented results, the blood perfusion increase after SGB was directly observed, which is consistent with the patients’ subjective sense of pain relief. Based on time-of-flight in the depth direction and raster 2-D scanning in the horizontal direction, PAM can reconstruct 3-D information of the blood vessel anatomy and the distributions of hemoglobin concentration and oxygen saturation, which may provide additional information for diagnosis and improvement after treatment. Our experiments show that a relatively obvious blood perfusion increase after SGB exists at the shallow depth where the capillary bed is located. Although the data are preliminary, they suggest a strong relation between the development of CRPS and microcirculatory changes. PAM is able to measure the oxygen saturation in a single blood vessel29 or the average values in a desired area. Pain, autonomic changes, and functioning impairment in patients with CRPS may be related more to the actual tissue extraction of oxygen and nutrients in the affected area than to the supply of oxygen and nutrients from microcirculation. Some reports suggest that arterial oxygen saturation alone may not be helpful enough to diagnose CRPS,39,40 thus venous oxygen saturation is essential.40 Due to its absorption contrast mechanism, PAM with double wavelengths is sensitive to both oxyhemoglobin and deoxyhemoglobin, and is able to measure the oxygen saturation in both arteries and veins. SGB with local anesthetics is used frequently in the management of CRPS-1 of the upper extremities, with variable degrees of success in pain relief and improvement of function.5 This inconsistency of outcome may be related to sympathetically maintained pain (SMP) and sympathetically independent pain (SIP).41 SMP may be differentiated from SIP by a sympatholytic challenge provided by an intravenous injection of the α-adrenergic blocker phentolamine or sympathetic blocks.42,43 Our preliminary data indicated only a subset of patients responded to SGB well, with significant pain relief and changes of PA signal and , which supports the observation that “neuropathic pain is mediated or maintained by the sympathetic nervous system in only a subset of patients.”43 Despite the advantages listed above, the 2-D scanning of current PAM has a relatively long acquisition time, which leads to some motion artifacts in the image. Further improvement of imaging speed is possible by implementing mirror scanning.44 Limited by the strong attenuation of high-frequency acoustic signals, the AR-PAM system used in this work can image only as deep as 3 mm in biological tissue. To investigate the microcirculatory changes of deep tissue, such as muscles and bones in the area affected by CRPS, an AR-PAM system with a lower central frequency transducer (e.g., 5 MHz) can be used in the future, which would extend the imaging depth to 4 cm.25 Based on a small number of subjects, our data are promising but preliminary. Randomized, controlled, and double-blinded clinical trials are needed to verify the clinical application of PAM systems to CRPS evaluation and management. 5.ConclusionIn this paper, peripheral blood vessels in two sites in patients’ hands were imaged by PAM systems. From pre- to post-SGB block, there were a 50% increase in signal intensity of PAM and 4% increase in , which agreed with the increased temperature and decreased pain level.6,7 The results showed that blood perfusion increased after SBG, which is consistent with prior reports. Unlike other imaging methods, PAM can provide noninvasive high spatial resolution images as well as functional measurement. In these preliminary results, PAM showed its potential in helping both monitoring and diagnosing CRPS. AcknowledgmentsThis work was sponsored in part by National Institutes of Health grants DP1 EB016986 (NIH Director’s Pioneer Award), R01 CA186567 (NIH Director’s Transformative Research Award), and R01 CA159959. L.V. W. has a financial interest in Microphotoacoustics, Inc. and Endra, Inc., which, however, did not support this work; K.I. M. has a financial interest in Microphotoacoustics, Inc. ReferencesS. Bruehl,
“An update on the pathophysiology of complex regional pain syndrome,”
Anesthesiology, 113
(3), 713
–725
(2010). http://dx.doi.org/10.1097/ALN.0b013e3181e3db38 ANESAV 0003-3022 Google Scholar
T. LubenowM. Jaycox,
“Current trends in the diagnosis and treatment of complex regional pain syndrome,”
ASA Refresh. Courses Anesthesiol., 40
(1), 95
–104
(2012). http://dx.doi.org/10.1097/ASA.0b013e31826305ed 0363-471X Google Scholar
R. J. SchwartzmanG. M. AlexanderJ. Grothusen,
“Pathophysiology of complex regional pain syndrome,”
Expert Rev. Neurother., 6
(5), 669
–681
(2006). http://dx.doi.org/10.1586/14737175.6.5.669 ERNXAR 1473-7175 Google Scholar
L. Parkitnyet al.,
“Inflammation in complex regional pain syndrome A systematic review and meta-analysis,”
Neurology, 80
(1), 106
–117
(2013). http://dx.doi.org/10.1212/WNL.0b013e31827b1aa1 NEURAI 0028-3878 Google Scholar
F. van Eijset al.,
“Predictors of pain relieving response to sympathetic blockade in complex regional pain syndrome type 1,”
Anesthesiology, 116
(1), 113
–121
(2012). http://dx.doi.org/10.1097/ALN.0b013e31823da45f ANESAV 0003-3022 Google Scholar
M. Schurmannet al.,
“Assessment of the peripheral microcirculation using computer-assisted venous congestion plethysmography in post-traumatic complex regional pain syndrome type I,”
J. Vasc. Res., 38
(5), 453
–461
(2001). http://dx.doi.org/10.1159/000051078 JVREE9 1018-1172 Google Scholar
M. Dirckxet al.,
“Effect of immunomodulating medications in complex regional pain syndrome A systematic review,”
Clin. J. Pain, 28
(4), 355
–363
(2012). http://dx.doi.org/10.1097/AJP.0b013e31822efe30 0749-8047 Google Scholar
X. MoissetD. Bouhassira,
“Brain imaging of neuropathic pain,”
Neuroimage, 37
(S1), S80
–S88
(2007). http://dx.doi.org/10.1016/j.neuroimage.2007.03.054 NEIMEF 1053-8119 Google Scholar
D. Owenet al.,
“Quantification of pain-induced changes in cerebral blood flow by perfusion MRI,”
Pain, 136
(1), 85
–96
(2008). http://dx.doi.org/10.1016/j.pain.2007.06.021 PAINDB 0304-3959 Google Scholar
A. Lebelet al.,
“fMRI reveals distinct CNS processing during symptomatic and recovered complex regional pain syndrome in children,”
Brain, 131
(7), 1854
–1879
(2008). http://dx.doi.org/10.1093/brain/awn123 BRAIAK 0006-8950 Google Scholar
J. A. Detreet al.,
“Perfusion imaging,”
Magn. Reson. Med., 23
(1), 37
–45
(1992). http://dx.doi.org/10.1002/(ISSN)1522-2594 MRMEEN 0740-3194 Google Scholar
R. C. Coghillet al.,
“Global cerebral blood flow decreases during pain,”
J. Cereb. Blood Flow Metab., 18
(2), 141
–147
(1998). http://dx.doi.org/10.1097/00004647-199802000-00003 JCBMDN 0271-678X Google Scholar
T. Okanoet al.,
“Use of near-infrared spectroscopy to evaluate stellate ganglion block,”
Reg. Anesth Pain Med., 26
(2), 186
(2001). http://dx.doi.org/10.1053/rapm.2001.21827 RAPMFX 1098-7339 Google Scholar
M. Kobanet al.,
“Tissue hypoxia in complex regional pain syndrome,”
Pain, 104
(1–2), 149
–157
(2003). http://dx.doi.org/10.1016/S0304-3959(02)00484-0 PAINDB 0304-3959 Google Scholar
Y. Zhaoet al.,
“Phase-resolved optical coherence tomography and optical Doppler tomography for imaging blood flow in human skin with fast scanning speed and high velocity sensitivity,”
Opt. Lett., 25
(2), 114
–116
(2000). http://dx.doi.org/10.1364/OL.25.000114 OPLEDP 0146-9592 Google Scholar
W. E. AckermanM. A. MunirJ.-M. Zhang,
“Assessment of laser Doppler imaging for the diagnosis of complex regional pain syndrome I,”
J. Neuropathic Pain Symptom Palliation, 1
(4), 13
–20
(2005). http://dx.doi.org/10.3109/J426v01n04_03 JNPSCH 1543-7698 Google Scholar
X. Wanget al.,
“Noninvasive laser-induced photoacoustic tomography for structural and functional in vivo imaging of the brain,”
Nat. Biotechnol., 21
(7), 803
–806
(2003). http://dx.doi.org/10.1038/nbt839 NABIF9 1087-0156 Google Scholar
H. F. Zhanget al.,
“Functional photoacoustic microscopy for high-resolution and noninvasive in vivo imaging,”
Nat. Biotechnol., 24
(7), 848
–851
(2006). http://dx.doi.org/10.1038/nbt1220 NABIF9 1087-0156 Google Scholar
Y. Zhouet al.,
“Photoacoustic microscopy of bilirubin in tissue phantoms,”
J. Biomed. Opt., 17
(12), 126019
(2012). http://dx.doi.org/10.1117/1.JBO.17.12.126019 JBOPFO 1083-3668 Google Scholar
C. Zhanget al.,
“Slow-sound photoacoustic microscopy,”
Appl. Phys. Lett., 102
(16), 163702
(2013). http://dx.doi.org/10.1063/1.4803444 APPLAB 0003-6951 Google Scholar
J. Y. Lianget al.,
“Cross-correlation-based transverse flow measurements using optical resolution photoacoustic microscopy with a digital micromirror device,”
J. Biomed. Opt., 18
(9), 096004
(2013). http://dx.doi.org/10.1117/1.JBO.18.9.096004 JBOPFO 1083-3668 Google Scholar
Y. Zhouet al.,
“Calibration-free in vivo transverse blood flowmetry based on cross correlation of slow time profiles from photoacoustic microscopy,”
Opt. Lett., 38
(19), 3882
–3885
(2013). http://dx.doi.org/10.1364/OL.38.003882 OPLEDP 0146-9592 Google Scholar
L. D. Liaoet al.,
“Transcranial imaging of functional cerebral hemodynamic changes in single blood vessels using in vivo photoacoustic microscopy,”
J. Cereb. Blood Flow Metab., 32
(6), 938
–951
(2012). http://dx.doi.org/10.1038/jcbfm.2012.42 JCBMDN 0271-678X Google Scholar
J. Y. Lianget al.,
“Random-access optical-resolution photoacoustic microscopy using a digital micromirror device,”
Opt. Lett., 38
(15), 2683
–2686
(2013). http://dx.doi.org/10.1364/OL.38.002683 OPLEDP 0146-9592 Google Scholar
L. H. V. WangS. Hu,
“Photoacoustic tomography: in vivo imaging from organelles to organs,”
Science, 335
(6075), 1458
–1462
(2012). http://dx.doi.org/10.1126/science.1216210 SCIEAS 0036-8075 Google Scholar
C. P. FavazzaL. A. CorneliusL. V. Wang,
“In vivo functional photoacoustic microscopy of cutaneous microvasculature in human skin,”
J. Biomed. Opt., 16
(2), 026004
(2011). http://dx.doi.org/10.1117/1.3536522 JBOPFO 1083-3668 Google Scholar
R. N. Hardenet al.,
“Validation of proposed diagnostic criteria (the ‘Budapest Criteria’) for complex regional pain syndrome,”
Pain, 150
(2), 268
–274
(2010). http://dx.doi.org/10.1016/j.pain.2010.04.030 PAINDB 0304-3959 Google Scholar
K. MaslovG. StoicaL. V. Wang,
“In vivo dark-field reflection-mode photoacoustic microscopy,”
Opt. Lett., 30
(6), 625
–627
(2005). http://dx.doi.org/10.1364/OL.30.000625 OPLEDP 0146-9592 Google Scholar
S. HuK. MaslovL. V. Wang,
“Second-generation optical-resolution photoacoustic microscopy with improved sensitivity and speed,”
Opt. Lett., 36
(7), 1134
–1136
(2011). http://dx.doi.org/10.1364/OL.36.001134 OPLEDP 0146-9592 Google Scholar
Y. ZhouJ. J. YaoL. H. V. Wang,
“Optical clearing-aided photoacoustic microscopy with enhanced resolution and imaging depth,”
Opt. Lett., 38
(14), 2592
–2595
(2013). http://dx.doi.org/10.1364/OL.38.002592 OPLEDP 0146-9592 Google Scholar
I. M. Braverman,
“The cutaneous microcirculation,”
J. Investig. Dermatol. Symp. Proc., 5
(1), 3
–9
(2000). http://dx.doi.org/10.1046/j.1087-0024.2000.00010.x JDSPFO 1087-0024 Google Scholar
R. S. G. M. Perezet al.,
“Diagnostic criteria for CRPS I: differences between patient profiles using three different diagnostic sets,”
Eur. J. Pain, 11
(8), 895
–902
(2007). http://dx.doi.org/10.1016/j.ejpain.2007.02.006 1090-3801 Google Scholar
D. R. BickerstaffJ. A. Kanis,
“Algodystrophy: an under-recognized complication of minor trauma,”
Br. J. Rheumatol., 33
(3), 240
–248
(1994). http://dx.doi.org/10.1093/rheumatology/33.3.240 BJRHDF 1460-2172 Google Scholar
G. Wasneret al.,
“Vascular abnormalities in reflex sympathetic dystrophy (CRPS I): mechanisms and diagnostic value,”
Brain, 124
(3), 587
–599
(2001). http://dx.doi.org/10.1093/brain/124.3.587 BRAIAK 0006-8950 Google Scholar
R. Baronet al.,
“Relation between sympathetic vasoconstrictor activity and pain and hyperalgesia in complex regional pain syndromes: a case-control study,”
Lancet, 359
(9318), 1655
–1660
(2002). http://dx.doi.org/10.1016/S0140-6736(02)08589-6 LANCAO 0140-6736 Google Scholar
P. J. Albrechtet al.,
“Pathologic alterations of cutaneous innervation and vasculature in affected limbs from patients with complex regional pain syndrome,”
Pain, 120
(3), 244
–266
(2006). http://dx.doi.org/10.1016/j.pain.2005.10.035 PAINDB 0304-3959 Google Scholar
H. Kurverset al.,
“Reflex sympathetic dystrophy: evolution of microcirculatory disturbances in time,”
Pain, 60
(3), 333
–340
(1995). http://dx.doi.org/10.1016/0304-3959(94)00133-Y PAINDB 0304-3959 Google Scholar
F. Birkleinet al.,
“Experimental tissue acidosis leads to increased pain in complex regional pain syndrome (CRPS),”
Pain, 87
(2), 227
(2000). http://dx.doi.org/10.1016/S0304-3959(00)00286-4 PAINDB 0304-3959 Google Scholar
E. C. TanM. H. de KeijzerR. J. A. Goris,
“Capillary blood gas analysis in complex regional pain syndrome: a pilot study,”
Ann. Clin. Biochem., 40
(5), 569
–571
(2003). http://dx.doi.org/10.1258/000456303322326524 ACBOBU 0004-5632 Google Scholar
E. C. Tanet al.,
“Impaired oxygen utilization in skeletal muscle of CRPS I patients,”
J. Surg. Res., 173
(1), 145
–152
(2012). http://dx.doi.org/10.1016/j.jss.2010.08.043 JSGRA2 0022-4804 Google Scholar
R. Melzacket al.,
“Trigeminal neuralgia and atypical facial pain: use of the McGill pain questionnaire for discrimination and diagnosis,”
Pain, 27
(3), 297
–302
(1986). http://dx.doi.org/10.1016/0304-3959(86)90157-0 PAINDB 0304-3959 Google Scholar
S. N. Rajaet al.,
“Systemic alpha-adrenergic blockade with phentolamine: a diagnostic test for sympathetically maintained pain,”
Anesthesiology, 74
(4), 691
–698
(1991). http://dx.doi.org/10.1097/00000542-199104000-00012 ANESAV 0003-3022 Google Scholar
S. N. RajaR.-D. Treede,
“Testing the link between sympathetic efferent and sensory afferent fibers in neuropathic pain,”
Anesthesiology, 117
(1), 173
–177
(2012). http://dx.doi.org/10.1097/ALN.0b013e31825adb2b ANESAV 0003-3022 Google Scholar
J. Yaoet al.,
“Wide-field fast-scanning photoacoustic microscopy based on a water-immersible MEMS scanning mirror,”
J. Biomed. Opt., 17
(8), 080505
(2012). http://dx.doi.org/10.1117/1.JBO.17.8.080505 JBOPFO 1083-3668 Google Scholar
|


