
|
|
1.IntroductionThe growing interest in point-scanning microscopy techniques based on nonlinear contrasts such as multiphoton excitation fluorescence, second-harmonic generation (SHG), and third-harmonic generation or coherent Raman scattering1,2 has lead to an increasing need for powerful and versatile light sources. Such a source must generate near-infrared (NIR) ultrashort pulses (typically ) with peak powers high enough to observe signals generated by nonlinear processes taking place in the focal volume. Most of the nonlinear microscopes use bulky optics to relay ultrashort pulses between the femtosecond laser and the microscope stand. Many applications would benefit from fiber delivery of high-energy femtosecond pulses. Such systems would also be very beneficial to the emerging field of local probe or endoscopic nonlinear imaging that aims at miniaturizing point-scanning techniques for sensor and biomedical applications. Although several successful experiments have been conducted over the past 10 years, fiber delivery of Fourier-transform-limited femtosecond pulses remains a challenge today. Various strategies have been explored to address this issue, most of them using Ti:Sapphire lasers for pulse generation in the NIR (800 to 1000 nm) and a variety of fibers for pulse propagation and delivery, such as single-mode fibers,3 double-clad fibers,4,5 fiber bundles,6 large-mode area fibers,7 double-clad photonic crystal fibers (PCFs),8,9 and hollow-core photonic bandgap fibers.10–13 Recently, Er- and Yb-doped fiber lasers have been put to use in a new type of all-fiber-optic endoscopes operating at wavelength.14,15 In most of those examples, the dispersion and nonlinearities of the delivering fibers distort and temporally broaden the pulse. Simultaneous precompensation for dispersion and nonlinearity is complex16,17 and only gives a transform-limited output pulse within a narrow input parameter range. Furthermore, none of those techniques allow rapid wavelength tuning of the delivered pulse. An alternative approach consists of taking advantage of the nonlinearities of a PCF in the anomalous dispersion regime. In this case, fundamental solitons are ejected and red-shifted after pulse breakup and the subsequent soliton self-frequency shift (SSFS).18 This way, a femtosecond pulse is generated and delivered by the same fiber. Only fundamental solitons are stable in optical fibers, so the pulse is intrinsically Fourier-transform-limited at the output of the fiber due to the balance between anomalous dispersion and the Kerr nonlinearity responsible for soliton dynamics. Increasing the power at the input of the fiber results in a greater soliton redshift, which opens the door to spectroscopic applications and hyperspectral imaging. This is an elegant way of solving the precompensation problem while enabling tunability.19 Solitons of wavelengths have been previously used to perform multiphoton microscopy.20–22 In this paper, we present results obtained with a custom-made solid-core photonic bandgap (SC-PBG) fiber that has been designed for generating powerful solitons from 800 to 1000 nm, an ideal range for performing microscopy on biological samples. In contrast to previous works in which generation of high-energy solitons in hollow-core photonic bandgap fibers23 and higher-order-mode fibers24 have been reported, we propose an approach that allows the generation of powerful solitons at input powers compatible with standard light sources available in microscopy labs. We characterize the fiber, demonstrate its use in a spectroscopic scheme, and illustrate its ability to generate two-photon excitation fluorescence (TPEF) and SHG images of biological samples. 2.Methods2.1.Soliton DynamicsThe propagation of light in a PCF along its main axis is governed by the nonlinear Schrödinger equation (NLSE)25 where is the group velocity dispersion (GVD) and is the nonlinear parameter. Those two wavelength-dependent parameters characterize the PCF and can be changed only by modifying its design.An analytical solution to the NLSE can be found in the case of anomalous dispersion (). This solution describes a pulse of light that propagates without changing its shape, known as a fundamental soliton. It can be expressed as follows: where is the peak power of the soliton and is its duration, defined with respect to the full width at half maximum duration by . Soliton dynamics relies on the interplay between the two processes involved in Eq. (1): the anomalous GVD () and the self-phase modulation created by the nonlinear Kerr effect () act against each other in a balanced way, which ensures the preservation of the pulse shape. This relationship is summed up in the following equation, which also links the power and duration of the solitons to each other and to the fiber parameters where is the soliton order. In this paper, we are only generating fundamental solitons, for which , because higher-order solitons are not stable in optical fibers due to their intrinsic higher-order dispersion and/or Raman nonlinearity.For short pulses (), the simplest form of the NLSE [Eq. (1)] is not sufficient to fully describe the behavior of solitons. Higher-order effects have to be taken into account, particularly intrapulse Raman scattering, which is responsible for the SSFS that we will use as a tuning mechanism. When the pulse is very short (typically ), its spectrum is broad enough that an effect similar to stimulated Raman scattering can occur between the blue and the red components, mediated by the vibration modes of silica. Namely, the red part of the spectrum experiences a Raman gain, while the blue part experiences a Raman loss. This results in the continuous redshift of the soliton along its propagation in the fiber. The variation of the central frequency of the soliton is related to the duration of the pulse When more power is injected into the fiber, the duration of the pulse decreases [see Eq. (3)], therefore, the redshift is enhanced. We propose to use this effect as a wavelength tuning mechanism. Indeed, since the redshift is proportional to , a small variation in the pulse duration will cause a large redshift and we can obtain a large tuning range for a virtually constant . If the third-order dispersion is small enough, the shape of the pulse remains the same during propagation and it is Fourier-transform-limited at any in the fiber, which means that it is the shortest pulse allowed by its bandwidth, with a constant time-bandwidth product characteristic for pulses. This is an interesting property for nonlinear microscopy as the contrasts we wish to activate require a high peak power, and therefore a short pulse duration. 2.2.SC-PBG FiberFrom Eq. (3), we get that the energy of the soliton depends on the dispersion to nonlinear coefficient ratio () which are the parameters of the fiber. We can rewrite it in the following way: In order to get high excitation powers compatible with nonlinear microscopy, one has to fabricate a fiber whose design provides a high ratio. We designed and fabricated an SC-PBG fiber with a doubly periodic cladding consisting of high index inclusions made of germanium-doped silica that are responsible for photonic bandgap guidance and air holes for reducing the confinement losses. Figure 1(a) shows a scanning electron microscope image of the fiber. This fiber resembled the one in Ref. 26, although the transmission window was optimized for 800 nm lasers. In the present SC-PBG fiber, the generation and redshift of solitons are possible in the first PBG, from the zero dispersion wavelength at 750 nm to the long-wavelength edge at 1030 nm. Such a fiber was shown to generate 3 to 5 times higher-energy solitons than standard PCFs.27 Figure 1(b) shows the ratio for the fiber we used in comparison to standard values for other PCFs. Coupling efficiencies were about 30% to 40% and the soliton generation efficiency, defined as the ratio of the soliton power over the total input power, was about 10%. Fig. 1(a) Scanning electron microscope image of the solid-core photonic bandgap (SC-PBG) fiber. Dark gray: silica; light gray: Ge-doped silica; black: air. (b) Red line: ratios calculated for the SC-PBG fiber used in this work (finite element method simulation). Gray area: typical values of this ratio for standard PCFs.  2.3.Optical Setups2.3.1.Characterization of the SC-PBG fiberWe launched NIR femtosecond pulses (800 nm, 30 fs, 1 GHz) in sections of the fiber of various lengths for characterization at different input powers. The light was coupled into the fiber with an aspheric lens. To get coupling to the fundamental mode, we imaged the exit end of the fiber on a CMOS camera and maximized the intensity of this mode. The input power was controlled by a half-wave plate and a polarizing beam splitter. The resulting solitons were filtered from the residue of the laser light at 800 nm as well as the blue-shifted dispersive waves by long-pass filters (LP830RU from Semrock, Rochester, New York or FEL850 from Thorlabs, Newton, New Jersey), and some of their properties were measured, such as average power, spectrum (USB2000, Ocean Optics, Dunedin, Florida), and duration through their autocorrelation trace (Mini, APE, Berlin, Germany). 2.3.2.Spectroscopy and microscopyWe conducted two sets of experiments based on the excitation of the sample by the optical solitons generated in the fiber. First, we performed microspectroscopy on liquid samples, then we did microscopy on several samples, including biological ones. The solitons were generated by a coupling 800 nm light from either an 80 MHz (Chameleon, 150 fs from Coherent Inc., Santa Clara, California) or a 1 GHz laser (GigaJet, 30 fs from Laser Quantum, Stockport, United Kingdom) into the SC-PBG fiber. As before, the soliton wavelength was controlled by changing the input power, and was filtered from residual and dispersive waves with a long-pass filter to ensure that the soliton was the only excitation pulse reaching the sample. For microspectroscopy, the light was focused on the sample with a long working distance objective (, from Olympus, Tokyo, Japan) and collected by another objective () in the forward direction. We detected the TPEF on an APD after a set of long-pass and bandpass filters. For microscopy, we used a high NA objective (, , water immersion from Nikon, Tokyo, Japan) and scanned the focus across the sample with galvanometric mirrors to create TPEF and SHG images in an epi-detection scheme by using two PMTs and an appropriate set of filters and dichroic mirrors. A scheme representing the two setups combined is shown in Fig. 2. 3.Results and Discussion3.1.Generation of Solitons in the SC-PBG FiberAn example of output spectrum is shown in Fig. 3(a). The red-shifted soliton is perfectly fitted by a squared hyperbolic-secant function (red dotted line). The inset of Fig. 3(a) shows the autocorrelation trace for the 900 nm soliton corresponding to the spectrum. For pulses, we divide the width FWHM of the autocorrelation trace by 1.54 in order to recover the pulse duration, which in this case was found to be 90 fs. The Fourier-transform-limited duration calculated from the Fourier transform of the spectrum () is 80 fs. The difference can be explained by the dispersion of the optics between the fiber and the autocorrelator (lens, filter, halfwave plate), estimated to be about . Thus we verify that the soliton is Fourier-transform-limited at the output of the fiber. Fig. 3(a) Black line: spectrum of the output of the fiber. Red dotted line: squared hyperbolic-secant fit of the soliton. Inset: autocorrelation trace of the 900 nm soliton. (b) Wavelength dependence of the energy of the soliton for fiber lengths from 3 to 30 m. The full lines are linear fits of the experimental points for each fiber. Fiber input average powers were (at 1 GHz): 420 to 1400 mW (3 m); 420 to 1360 mW (5 m); 200 to 1380 mW (10 m); 250 to 1300 mW (15 m); 200 to 1400 mW (30 m). (c) Theoretical ratio (blue line) from simulation and experimental values of this ratio retrieved from measurement of the power and spectrum of the solitons, for several fiber lengths and soliton wavelengths. (d) Redshift of the soliton at maximum input power for varying fiber lengths. The dashed line is a guide to the eye. 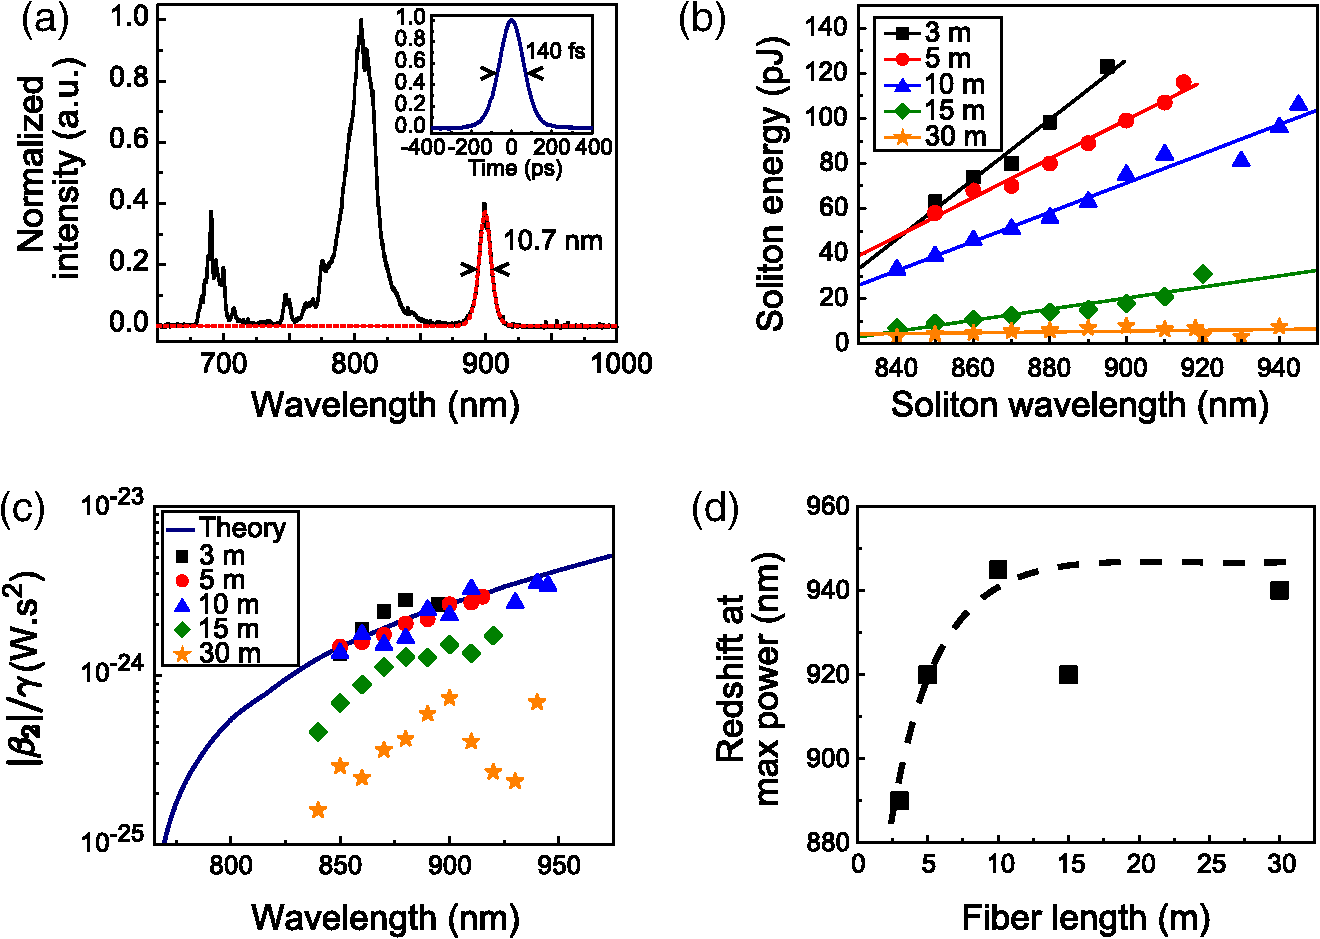 Figure 3(b) shows the measured energy of the solitons through the whole tunability window. For each measured point in Fig. 3(b), we calculate the effective ratio with Eq. (3), using duration values calculated from the Fourier transform of the measured spectrum. Figure 3(c) shows those experimental values along with the theoretical curve from finite element method calculations. We find a good agreement between the simulation and the experiment for fibers up to 10 m, whereas in longer fibers, the calculated ratios are lower than the theory. In a similar fashion, the highest redshift accessible via SSFS increases with fiber length, but it reaches a maximum value at [see Fig. 3(d)]. In fibers longer than 15 m, several mechanisms can explain the lower values of the effective and the end of the redshift. First, the third-order dispersion arising when the soliton gets closer to the PBG edge decelerates the SSFS in the fiber.28 Second, the attenuation experienced by the pulse when it propagates increases the nonlinear length which is the characteristic length needed for the soliton to adapt to any changes. At a certain point, the soliton can no longer follow the changes in , ceases to redshift, and temporally broadens under dispersion. In the end, the redshifted pulse loses its soliton nature during propagation, and Eq. (3) is no longer valid. Figure 3(d) can be interpreted as the redshift versus the fiber length. In view of the above explanation, we can say that soliton nature of the pulse is retained until the plateau. Finally, we achieve a 100 nm tuning range for the soliton. The length of the fiber must be less than 10 m so that Eq. (3) is still valid and the output pulse is Fourier-transform-limited. Then, the fiber length should be chosen according to the tunability and power requirements for the application. In the experiments described in the following, we used the 10-m fiber for spectroscopic application because it displays the best trade-off between tunability and soliton power, and the 3-m fiber for microscopy to get high soliton power. 3.2.MicrospectroscopyWe investigated the TPEF response of an aqueous solution of rhodamine 6G with the setup described above. We first compared the fluorescent levels and the signal-to-noise ratios in the cases of the excitation by solitons generated in the fiber at 80 MHz and at 1 GHz. The TPEF signal at a given wavelength depends on pulse power, duration, and repetition rate in the following way:29 where is the average power and is the peak power. The energy and duration of one soliton at a given wavelength are fixed by the fiber parameters. Consequently, the only way to significantly increase the TPEF signal in this scheme is to increase the repetition rate.More specifically, we expect the fluorescence signal to scale linearly with the repetition rate. If the TPEF photon count arising from excitation with a single soliton has mean and standard deviation , then it follows from the properties of the standard deviation that the TPEF count rate arising from a train of solitons at repetition rate has mean and standard deviation . We can then expect both the noise and the signal-to-noise ratio to scale with the square root of the repetition rate. We measure a 10-fold increase of the fluorescence counts and a 4-fold increase of the signal-to-noise ratio under a 12.5-fold increase of the repetition rate (from 80 MHz to 1 GHz), as shown in the inset of Fig. 4. The experimental data seem to generally follow the trend predicted by the above calculation. This indicates that we observe only limited saturation effects in the sample when increasing the repetition rate. Fig. 4Two-photon excitation fluorescence (TPEF) spectra of a solution of rhodamine 6G in water. Black squares: reference spectrum, measured by exciting the sample with the tunable fs light directly coming from the 80 MHz Ti:Sapphire laser (without passing through the fiber). Blue circles: spectrum acquired under excitation with solitons generated in a 10 m SC-PBG fiber pumped with an 800 nm, 1 GHz laser. Green triangles: spectrum acquired under excitation with solitons generated in a 10 m SC-PBG fiber pumped with an 800 nm, 80 MHz laser. Inset: TPEF traces under excitation with 870 nm solitons at 1 GHz (blue line) and 80 MHz (green line), with the corresponding signal-to-noise ratios (in ). Powers at the focus: black curve: 15 mW; blue: 5 mW; and green: 2 mW.  The main plot in Fig. 4 shows the TPEF spectra of the same rhodamine 6G solution. The two spectra (blue circles and green triangles) obtained with excitation by solitons at 80 MHz and 1 GHz were normalized with respect to their average power and repetition rate, taking into account the small saturation effect previously measured. The agreement between the two spectra is very good, proving the reliability of the soliton as a light source with only a little influence on the parameters of the pumping laser (spectrum, duration, chirp). Another spectrum was used as a control, using the fs pulse directly coming from the 80 MHz Ti:Sapphire laser (black squares) for excitation. The spectra show a good qualitative agreement. Our measurements are also consistent with the two-photon absorption cross section values for rhodamine 6G found in the literature.29,30 However, no quantitative information can be retrieved from the comparison between this spectrum and two first spectra because many parameters vary (spectral width, pulse duration, beam shape). 3.3.MicroscopyTo demonstrate the imaging capabilities of our system, we performed images of several samples, including biological ones (see Fig. 5). We generated the solitons at 1 GHz repetition rate in a 3 m fiber to operate at high excitation power and low redshift (850 to 890 nm). We first tested the two epi-detection channels separately to obtain images of samples known for their strong TPEF and SHG signals, respectively. Figure 5(a) shows a TPEF image of a fixed Drosophila embryo, where the formaldehyde fixation process is responsible for inducing the fluorescence signal. Figure 5(b) shows the SHG image of crystals. In both cases, the 50 to dwell times that were used are comparable with the ones typically used in nonlinear microscopy. The multiphoton signal is about 10 times lower than images with standard Ti:Sapphire excitation. We have identified the reason for this discrepancy to be the spatial profile of the soliton that is singly peaked but not Gaussian. The microscope we used was not set up to compensate for this effect, which results in a bias against the soliton in this context. We then used the two channels to perform a multimodal image of a biological sample. Figure 5(c) shows a composite TPEF/SHG image of fixed mouse tumor skin tissue showing structural features that are not distinguishable in white light microscopy. The SHG emitting structures can be identified as collagen fibers, whereas TPEF comes from the stratum corneum. Fig. 5TPEF and second-harmonic generation (SHG) images with 10 accumulations each. (a) TPEF image of a fixed Drosophila embryo obtained with an 870 nm soliton excitation and a dwell time. (b) SHG image of crystals obtained with an 850 nm soliton excitation and a dwell time. (c) Composite image of fixed mouse tumor skin tissue obtained with an 870 nm soliton excitation and a dwell time. TPEF is shown in red and SHG in green. Powers in the sample plane: (a) 40 mW; (b) 50 mW; and (c) 55 mW.  4.ConclusionsWe demonstrate the use in microspectroscopy and microscopy of a light source relying on soliton generation and redshift in an SC-PBG fiber. The fiber design was optimized to allow the generation of high-energy solitons, and the laws of soliton dynamics ensured a Fourier-transform-limited pulse at the exit end of the fiber, with no need for precompensation for dispersion. For those reasons, the soliton excitation scheme is efficient for the generation of observable nonlinear signals (such as TPEF and SHG) in the focal volume. Furthermore, the power-dependent redshift of the soliton provides a 100 nm tunability range, opening the door to spectroscopic applications, hyperspectral imaging, as well as to vibrational spectroscopy and microscopy relying on coherent Raman processes. The speed of wavelength tuning is only limited by the capabilities of the devices used to change the power at the input of the fiber. For example, with a Pockels cell, one could get wavelength switching frequencies up to few MHz. In the current configuration, the wavelength tuning is repeatable enough to operate in an automated fashion over the course of a set of experiments (typically a few hours). This work emphasizes the advantages of increasing the repetition rate in terms of signal level and signal-to-noise ratio. Previous studies also suggest that photodamage associated with multiphoton excitation fluorescence decreases when the repetition rate increases while keeping a constant signal rate,31 which is another point in favor of our 1 GHz system for soliton imaging applications of biological samples. AcknowledgmentsThe authors acknowledge financial support from the Centre National de la Recherche Scientifique (CNRS), Aix-Marseille University A*Midex (No. ANR-11-IDEX-0001-02), the Weizmann NaBi European Associated Laboratory, the Ministry of Higher Education and Research, Nord-Pas de Calais Regional Council, FEDER through the Contrat de Projets État Région (CPER) 2007–2013, French Agence Nationale de la Recherche (ANR JCJC TOPWAVE), and ANR grants France Bio Imaging (ANR-10-INSB-04-01) and France Life Imaging (ANR-11-INSB-0006) infrastructure networks. ReferencesW. R. ZipfelR. M. WilliamsW. W. Webb,
“Nonlinear magic: multiphoton microscopy in the biosciences,”
Nat. Biotechnol., 21
(11), 1369
–1377
(2003). http://dx.doi.org/10.1038/nbt899 NABIF9 1087-0156 Google Scholar
E. E. HooverJ. A. Squier,
“Advances in multiphoton microscopy technology,”
Nat. Photonics, 7
(2), 93
–101
(2013). http://dx.doi.org/10.1038/nphoton.2012.361 1749-4885 Google Scholar
D. BirdM. Gu,
“Compact two-photon fluorescence microscope based on a single-mode fiber coupler,”
Opt. Lett., 27
(12), 1031
–1033
(2002). http://dx.doi.org/10.1364/OL.27.001031 OPLEDP 0146-9592 Google Scholar
M. T. MyaingD. J. MacDonaldX. Li,
“Fiber-optic scanning two-photon fluorescence endoscope,”
Opt. Lett., 31
(8), 1076
–1078
(2006). http://dx.doi.org/10.1364/OL.31.001076 OPLEDP 0146-9592 Google Scholar
D. R. Riveraet al.,
“Compact and flexible raster scanning multiphoton endoscope capable of imaging unstained tissue,”
Proc. Natl. Acad. Sci. U.S.A., 108
(43), 17598
–17603
(2011). http://dx.doi.org/10.1073/pnas.1114746108 PNASA6 0027-8424 Google Scholar
W. Göbelet al.,
“Miniaturized two-photon microscope based on a flexible coherent fiber bundle and a gradient-index lens objective,”
Opt. Lett., 29
(21), 2521
–2523
(2004). http://dx.doi.org/10.1364/OL.29.002521 OPLEDP 0146-9592 Google Scholar
S. MoonG. LiuZ. Chen,
“Multiphoton endoscopy based on a mode-filtered single-mode fiber,”
Proc. SPIE, 7903 79032P
(2011). http://dx.doi.org/10.1117/12.875747 PSISDG 0277-786X Google Scholar
M. T. Myainget al.,
“Enhanced two-photon biosensing with double-clad photonic crystal fibers,”
Opt. Lett., 28
(14), 1224
–1226
(2003). http://dx.doi.org/10.1364/OL.28.001224 OPLEDP 0146-9592 Google Scholar
L. FuX. GanM. Gu,
“Nonlinear optical microscopy based on double-clad photonic crystal fibers,”
Opt. Express, 13
(14), 5528
–5534
(2005). http://dx.doi.org/10.1364/OPEX.13.005528 OPEXFF 1094-4087 Google Scholar
B. A. Flusberget al.,
“In vivo brain imaging using a portable 3.9 gram two-photon fluorescence microendoscope,”
Opt. Lett., 30
(17), 2272
–2274
(2005). http://dx.doi.org/10.1364/OL.30.002272 OPLEDP 0146-9592 Google Scholar
C. J. Engelbrechtet al.,
“Ultra-compact fiber-optic two-photon microscope for functional fluorescence imaging in vivo,”
Opt. Express, 16
(8), 5556
–5564
(2008). http://dx.doi.org/10.1364/OE.16.005556 OPEXFF 1094-4087 Google Scholar
S. Brustleinet al.,
“Double-clad hollow core photonic crystal fiber for coherent Raman endoscope,”
Opt. Express, 19
(13), 12562
–12568
(2011). http://dx.doi.org/10.1364/OE.19.012562 OPEXFF 1094-4087 Google Scholar
D. M. Hulandet al.,
“Three-photon excited fluorescence imaging of unstained tissue using a GRIN lens endoscope,”
Biomed. Opt. Express, 4
(5), 652
–658
(2013). http://dx.doi.org/10.1364/BOE.4.000652 BOEICL 2156-7085 Google Scholar
K. Murariet al.,
“Compensation-free, all-fiber-optic, two-photon endomicroscopy at ,”
Opt. Lett., 36
(7), 1299
–1301
(2011). http://dx.doi.org/10.1364/OL.36.001299 OPLEDP 0146-9592 Google Scholar
G. Liuet al.,
“Multiphoton microscopy system with a compact fiber-based femtosecond-pulse laser and handheld probe,”
J. Biophotonics, 4
(1–2), 34
–39
(2011). http://dx.doi.org/10.1002/jbio.201000049 JBOIBX 1864-063X Google Scholar
M. Leleket al.,
“Coherent femtosecond pulse shaping for the optimization of a non-linear micro-endoscope,”
Opt. Express, 15
(16), 10154
–10162
(2007). http://dx.doi.org/10.1364/OE.15.010154 OPEXFF 1094-4087 Google Scholar
C. Lefortet al.,
“Pulse compression and fiber delivery of 45 fs Fourier transform limited pulses at 830 nm,”
Opt. Lett., 36
(2), 292
–294
(2011). http://dx.doi.org/10.1364/OL.36.000292 OPLEDP 0146-9592 Google Scholar
J. P. Gordon,
“Theory of the soliton self-frequency shift,”
Opt. Lett., 11
(10), 662
–664
(1986). http://dx.doi.org/10.1364/OL.11.000662 OPLEDP 0146-9592 Google Scholar
X.-H. Fanget al.,
“An all-photonic-crystal-fiber wavelength-tunable source of high-energy sub-100 fs pulses,”
Opt. Commun., 289 123
–126
(2013). http://dx.doi.org/10.1016/j.optcom.2012.07.089 OPCOB8 0030-4018 Google Scholar
G. McConnellE. Riis,
“Photonic crystal fibre enables short-wavelength two-photon laser scanning fluorescence microscopy with fura-2,”
Phys. Med. Biol., 49
(20), 4757
–4763
(2004). http://dx.doi.org/10.1088/0031-9155/49/20/007 PHMBA7 0031-9155 Google Scholar
E. R. AndresenP. BertoH. Rigneault,
“Stimulated Raman scattering microscopy by spectral focusing and fiber-generated soliton as Stokes pulse,”
Opt. Lett., 36
(13), 2387
–2389
(2011). http://dx.doi.org/10.1364/OL.36.002387 OPLEDP 0146-9592 Google Scholar
K. WangC. Xu,
“Tunable high-energy soliton pulse generation from a large-mode-area fiber and its application to third harmonic generation microscopy,”
Appl. Phys. Lett., 99
(7), 071112
(2011). http://dx.doi.org/10.1063/1.3628337 APPLAB 0003-6951 Google Scholar
D. G. Ouzounovet al.,
“Generation of megawatt optical solitons in hollow-core photonic band-gap fibers,”
Science, 301
(5640), 1702
–1704
(2003). http://dx.doi.org/10.1126/science.1088387 SCIEAS 0036-8075 Google Scholar
M. E. Pedersenet al.,
“Higher-order-mode fiber optimized for energetic soliton propagation,”
Opt. Lett., 37
(16), 3459
–3461
(2012). http://dx.doi.org/10.1364/OL.37.003459 OPLEDP 0146-9592 Google Scholar
G. P. Agrawal, Nonlinear Fiber Optics, Academic Press, London, UK
(2001). Google Scholar
A. Bétournéet al.,
“Control of supercontinuum generation and soliton self-frequency shift in solid-core photonic bandgap fibers,”
Opt. Lett., 34
(20), 3083
–3085
(2009). http://dx.doi.org/10.1364/OL.34.003083 OPLEDP 0146-9592 Google Scholar
A. Bendahmaneet al.,
“Solid-core photonic bandgap fiber for the generation of tunable high-energy solitons,”
in 3rd Workshop on Specialty Optical Fibers and Their Applications,
(2013). http://dx.doi.org/10.1364/WSOF.2013.W3.36 Google Scholar
O. Vanvincqet al.,
“Extreme deceleration of the soliton self-frequency shift by the third-order dispersion in solid-core photonic bandgap fibers,”
J. Opt. Soc. Am. B, 27
(11), 2328
–2335
(2010). http://dx.doi.org/10.1364/JOSAB.27.002328 JOBPDE 0740-3224 Google Scholar
M. A. AlbotaC. XuW. W. Webb,
“Two-photon fluorescence excitation cross sections of biomolecular probes from 690 to 960 nm,”
Appl. Opt., 37
(31), 7352
–7356
(1998). http://dx.doi.org/10.1364/AO.37.007352 APOPAI 0003-6935 Google Scholar
N. S. MakarovM. DrobizhevA. Rebane,
“Two-photon absorption standards in the 550–1600 nm excitation wavelength range,”
Opt. Express, 16
(6), 4029
–4047
(2008). http://dx.doi.org/10.1364/OE.16.004029 OPEXFF 1094-4087 Google Scholar
N. JiJ. C. MageeE. Betzig,
“High-speed, low-photodamage nonlinear imaging using passive pulse splitters,”
Nat. Methods, 5
(2), 197
–202
(2008). http://dx.doi.org/10.1038/nmeth.1175 1548-7091 Google Scholar
|


