|
|
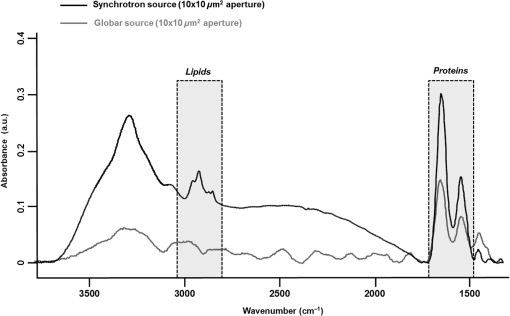
1.IntroductionStudying individual cancer cells represents an increasing area of major interest in the understanding of mechanisms implicated in tumor progression. However, investigating tumor cell migration requires considering the cell microenvironment since in vivo, cells develop specific interactions with their counterparts and with extracellular matrix (ECM) proteins to promote cell adhesion, proliferation, and migration.1 Most studies are performed in classical cell culture systems where cells are seeded on plane and rigid substrates, such as plastic or glass, which do not take into account the matrix components. Dynamic interactions between tumor cells and matrix proteins are a key determinant in the tumor progression and metastases dissemination, which represent the main uncontrolled problem in cancer therapeutics.2 Among these ECM proteins, type I collagen represents the major component in the body connective tissues through which tumor cells usually migrate to form metastases, and which can be used as a preintravasation microenvironment.3 In fact, specific sites of type I collagen are recognized by integrins to promote cell attachment to the matrix fibrillar network,4 enabling the trigger migration cycle of cells. Due to its particular longevity, this key matrix protein is a preferential target for posttranslational modifications during chronological aging; these age-related modifications are cumulative and irreversible5 and act on the physical and biomechanical properties of collagen networks.6 The main mechanism is the accumulation of the so-called advanced glycation endproducts (AGEs), which are cross-linking compounds resulting from the well-known nonenzymatic glycation process.7 As a result, AGEs are responsible for changes in the structure and function of collagen networks, which detrimentally affect cancer cell/matrix interactions8 and are suggested to be associated with cancer development. In this work, we have analyzed HT1080 human fibrosarcoma cells, known to be highly invasive, grown on two-dimensional coatings of different-age type I collagens. This coating model has previously been shown as a pertinent cell culture system for studying the proliferative capacity and migratory parameters of tumor cells at the single-cell level.9 Cell/matrix interactions are most often studied by conventional techniques of cellular and molecular biology or biochemistry such as studying regulation of proteases secretion10 or focal contacts formation.11 Other approaches based on the dynamic study of cell/matrix contacts use fluorescence lifetime microscopy techniques. However, these require labeling cells with specific fluorophores.12 In this study, we investigated the tumor cells grown on different-age collagen networks by synchrotron-based Fourier transform infrared (S-FTIR) microspectroscopy with the objective to gain insights into the cell/matrix interactions regions. The different-age collagen matrix models are based on the extraction of native and fibrillar type I collagens from newborn, young-adult, and old-adult rats. These models allow the analysis of the impact of aging on the cancer cell/collagen interactions. Using S-FTIR microspectroscopy permits a label-free, direct, and rapid analysis of biological samples with a high spatial resolution. Furthermore, the IR radiation is not damaging for cells and thus allows studying them while preserving their integrity.13 Vibrational microspectroscopy has already proven its ability to analyze tumor cells at the single-cell level. Raman spectral imaging has been used for extracting spectral signals from nucleus and cytoplasm with their biochemical attribution, showing the distribution of cell components at the subcellular scale.14 In the same way, the S-FTIR microspectroscopy has been shown to be able to differentiate cancer cells from their normal counterparts, showing the potential of FTIR methodologies in cancer clinical diagnosis.15 A recent study by both Raman and FTIR spectroscopies evaluated the effect of substrate coating on molecular and functional changes in adherent cells using an analysis of point spectra.16 Here, we chose to approach the single-cell level analysis using a synchrotron source to benefit from its high intrinsic brightness and its ability to provide high-quality spectra at diffraction-limited spot sizes. Although it is possible to obtain reasonable cell spectra with a conventional Globar® source, in this study the use of the IR synchrotron source and small apertures is justified because our aim was to attempt to identify infrared spectral features from specific cell/collagen interaction regions. Thus, with this set-up, good signal/noise data could be reached. A spectral data processing via clustering methods was used to analyze the spectral maps, to gain insight into the spectral features of cell/matrix interaction regions and invasion fronts during the tumor progression process and to evaluate the effect of aged collagen networks on these spectral features. 2.Materials and Methods2.1.Cell LineThe HT1080 human fibrosarcoma cell line (CCL-121) was purchased from the American Type Culture Collection (ATCC, Rockville, Maryland) and cultured in minimum essential media (MEM) with Earle salts and Glutamax (Invitrogen, Cergy-Pontoise, France) supplemented with 10% fetal bovine serum (Invitrogen) and 1% penicillin-streptomycin (Invitrogen). Cultures were maintained at 37°C in a humidified atmosphere containing 5% (v/v), and cells were routinely passaged at preconfluency using 0.05% trypsin-0.53-mM ethylenediamine tetraacetate (EDTA) (Invitrogen) and screened for the presence of mycoplasma using polymerase chain reaction (PCR) methods. 2.2.Preparation of Different-Age Type I CollagensNative type I collagens were extracted from tail tendons of different age Sprague-Dawley rats, newborns (a few days), 2 months (young adults), and 2 years (old adults), following the protocol previously described.17 Briefly, acid-soluble type I collagens were obtained by 0.5-M acetic acid extraction then purified by dialysis against distilled water and freeze-dried. This preparation without pepsinization provides collagens with intact telopeptides, in contrast with most commercially available type I collagens. The fibrillar, purified, and native type I collagens of different ages were then stored at until further use. As the collagen extracted from young-adult animals is commonly used in the field of biology to construct culture models, it will be considered as the control sample of our different-age collagen range. 2.3.Cell Culture on Different-Age Type I Collagen CoatingsTo prepare collagen coatings, type I collagens of each age were solubilised in 0.018-M acetic acid and deposited on calcium fluoride windows () (Crystran, Dorset, United Kingdom) according to a concentration of of protein per . Coated surfaces were dried overnight at room temperature under sterile conditions and rinsed with distilled water before cell seeding. Then, windows were placed in a 6-well plate and HT1080 cells were seeded at a concentration of (3 ml of cell suspension per well) and cells were grown for 48 h. Samples were then fixed with 4% paraformaldehyde in phosphate buffer for 15 min and rinsed with distilled water. For each condition of collagen age, three different-coated samples were prepared and seeded with HT1080 cells, and then between 10 and 15 individual cells for each collagen age conditions were mapped by S-FTIR microspectroscopy. 2.4.Synchrotron-FTIR MicrospectroscopyS-FTIR spectral acquisitions were performed with the synchrotron source of the B22-multimode infrared imaging and microspectroscopy (MIRIAM) beamline at the DIAMOND Light Source synchrotron facilities (Didcot, UK), using a Vertex 80v FT-IR spectrometer coupled to a HYPERION 3000 FT-IR microscope (Bruker Optics, Coventry, United Kingdom) controlled by the Opus 6.5 software. The S-FTIR data were directly collected on windows in the transmission mode with a Cassegrain objective using a aperture (step size of for whole cells and for part of the cell including cell/collagen contact areas). Each spectrum was a coaddition of 128 scans at resolution recorded between 4000 and . During the acquisition, the system was operating under vacuum and prior to each spectral acquisition, a background spectrum was recorded at 256 scans accumulations on a blank part of the same window. Each individual sample spectrum was rationed to the background spectrum to reduce any atmospheric effects. Cells grown on collagen coatings were individually mapped by selecting a region of about . This allowed the analysis of the entire single cell and its surrounding collagen substrate. As a function of the cell size (average size of ) and of the acquisition parameters, the time for data collection from one cell to another varied from 60 to 180 min. Each cell was individually mapped. 2.5.Data PreprocessingThe S-FTIR spectral data were preprocessed by an automated method based on the classical extended multiplicative signal correction (EMSC) algorithm implemented in the MATLAB 7.2 software (The Mathworks, Natick, Massachusetts, USA). Briefly, EMSC allows correcting the spectra for the physical light scattering effects that are different from the chemical light absorbance effects in order to retain only the spectral variability of the sample.18,19 This correction algorithm is able to remove outlier spectra or spectra with a low signal-to-noise (S/N) ratio, and it also allows performing a spectral baseline correction and vector-normalization in order to render them comparable. 2.6.Spectral Clustering MethodsSpectral data analyses and clusterings were performed using home-made algorithms written in the MATLAB 7.2 software. S-FTIR data, recorded on areas showing few cells on different-age collagen coatings, were compared using three different unsupervised clustering methods applied on the 1800 to spectral range: hierarchical clustering analysis (HCA), -means classification, and fuzzy -means (FCM) clustering. HCA allows regrouping spectra on a minimal distance criterion using Euclidean distances and Ward’s algorithm, and spectra with a high degree of homogeneity are grouped together.20,21 -means clustering consists of a nonhierarchical clustering technique partitioning spectra into preassigned number of clusters by randomly selecting cluster centers.22,23 The FCM clustering is based on the minimization of the sum of weighted distance measures between each spectrum (pixel) and each centroid, allowing one to assign each spectrum to every cluster with an associated membership value comprised between 0 and 1.24 The FCM images were constructed with redundancy-based algorithm (RBA)-optimized parameters (number of clusters and fuzziness index ). This model, previously developed for tissue spectral classification,25 allows providing a biologically relevant clustering. For both -means and FCM classifications of single-cell spectral maps, the calculation was performed on at least 12 different cells for each collagen-age condition, applying the same clustering parameters (number of clusters and pseudocolor coding). 3.Results3.1.Comparison of Conventional FTIR and S-FTIR Spectra at the Single-Cell LevelA synchrotron source was used to analyze HT1080 cells grown on coating substrates. Figure 1 displays the mean FTIR spectra from HT1080 cells acquired with a conventional Globar® source (in gray) and a synchrotron source (in dark), with the same aperture size of at the sample. This aperture size was necessary to obtain single-cell spectra, and it appeared clear that at this beam size it is important to use a synchrotron source due to the better S/N ratio obtained with the highly collimated and brilliant source. Further, the S-FTIR spectrum exhibited the vibrational modes of lipids (3100 to ) and proteins (1700 to ) commonly investigated in biological samples with a higher intensity. Using a synchrotron source enabled the collection of spatially resolved chemical and informative molecular information from a single cell, as previously established.26 HT1080 tumor cells in contact with their surrounding collagen substrate were individually mapped, and at least 12 different individual cells per collagen age condition were analyzed. These conditions were sufficient to highlight the weak spectral differences observed in a reproducible way and were consistent between cells. 3.2.-means Classification of S-FTIR Maps from HT1080 Tumor Cells Grown on Different-Age Collagen CoatingsHT1080 tumor cells were grown on different-age type I collagen substrates used here as a model of increasing-age ECM proteins. S-FTIR spectral maps recorded on these samples were first analyzed by a common -means clustering using 4 clusters in order to consider the three-different collagen age conditions and the cellular component. -means clustering data presented in Fig. 2 are representative of results obtained for three individual cells for each age condition. It must be noted here that the three images were processed together with the -means clustering procedure so as to obtain matching colors when the chemical information is the same (e.g., for cells) or unmatching colors when the chemical information is different (e.g., for different-age collagens). Results are shown as false color maps for cells cultured on collagens from newborns [Fig. 2(a)], young adults [Fig. 2(b)], and old adults [Fig. 2(c)]. Their respective visible images [left panels of Figs. 2(a)–2(c)] show individual HT1080 cells seeded on a nonplanar surface of the collagen network. HT1080 cells present the typical fibroblast-like morphology with an elongated cell body. -means clustering revealed that for each age condition, cellular components were grouped into a single cluster (cluster 3, in blue), while the three coating conditions were assigned to three independent clusters as a function of collagen age, i.e., cluster 4 (in purple) for the newborn collagen substrate, cluster 2 (in green) for the young-adult condition (control), and cluster 4 (in yellow) for the old-adult coating. The dendrogram of the cluster centroids with the corresponding spectra displayed in Fig. 2(d) shows that the cluster attributed to the newborn collagen substrate is well separated from the two other collagen ages and from the cellular component. -means clustering allows a good discrimination of coatings as a function of collagen age and a reproducible assignment of the HT1080 cell spectral fingerprint was achieved. However, one limitation of -means clustering is that it provides a too uniform representation of collagen substrates. Fig. 2-means clustering of synchrotron-based Fourier transform infrared (S-FTIR) data from HT1080 cells grown on different-age type I collagens. -means was applied on the 1800 to spectral range according to 4 clusters, on HT1080 cells seeded on newborn collagen (a), young-adult collagen (b), and old-adult collagen (c), with the mean spectra of cluster centers and the corresponding dendrogram of hierarchical clustering analysis (HCA) clustering (d). The framed area represents the spectral region specific to the carbohydrates (1100 to ). Depicted pseudocolor images are representative of results obtained on at least 12 different single cells per collagen-age condition substrate. . 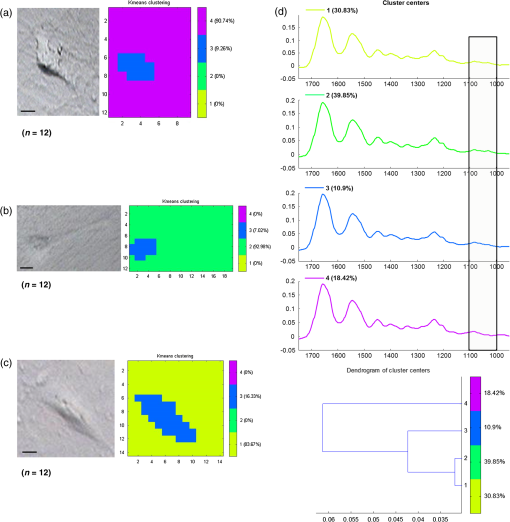 3.3.FCM Analysis of S-FTIR Maps from Tumor Cells Grown on Different-Aged Collagen Coatings3.3.1.FCM clustering: example of an HT1080 cancer cell grown on old-adult collagenS-FTIR mapping acquisitions from HT1080 cells in contact with different-age type I collagen were further analyzed by FCM clustering in order to improve the image analysis and try to discriminate cell/collagen interaction areas at the cell’s periphery. Here, we have focused on contact areas between cells and collagen coatings [see visible image Fig. 3(a)] with a smaller step size () in order to acquire more precise biochemical information. Figure 3(b) displays an example of the FCM pseudocolor images obtained from a single HT1080 tumor cell grown on old-adult collagen. This analysis was based on four clusters after RBA-estimation of the optimal FCM parameters ( and ) going from the intracellular compartments to the extracellular microenvironment with cluster 1 assigned to cell nuclear components, cluster 2 to cytoplasmic components, cluster 3 to cell/collagen contact areas, and cluster 4 to intact collagen. The centroid spectra corresponding to these clusters as well as HCA classification are shown in Figs. 3(c) and 3(d), respectively. The dendrogram exhibits a clear discrimination between the four clusters. Similar results were obtained with the newborn and young-adult collagen coatings (data not shown). Fig. 3Fuzzy -means (FCM) clustering of S-FTIR images from HT1080 cell grown on old-adult type I collagen. Redundancy-based algorithm FCM (; ) was applied on S-FTIR data from a single HT1080 cell seeded on old-adult collagen coating, in the 1800 to . Analyses were focused on cell/collagen contact areas: visible image (a), pseudocolor images reconstructed on the four clusters (b), mean spectra of cluster centers (c), and the corresponding dendrogram of HCA clustering (d). Data are representative of results obtained on at least 12 different single cells per collagen-age condition. . 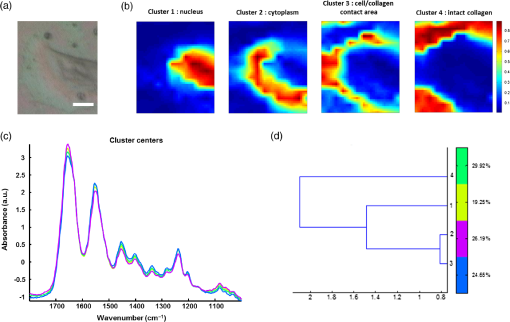 Following these observations, we analyzed spectra originating from the intact collagen areas (cluster 4) and those from the cell/collagen interaction areas (cluster 3). Spectra were extracted after FCM analysis of the spectral maps from three individual cells for each collagen-age condition. 3.3.2.Analysis of different-age type I intact collagen coatingsIn order to highlight the spectral changes in the infrared signal of collagen as a function of age, spectra corresponding to cluster 4 that we define as intact collagen (away from the cell/collagen contact areas) were extracted from the FCM images for each age condition, and compared in the 1800 to spectral range [Fig. 4(a)]. The Amide I band profile with a maximum absorbance at did not exhibit any significant changes as a function of the collagen age. An absence of modifications in the Amide III band (1300 to ) can also be noticed. Concerning the Amide II band, an upshift was observed between newborn () and, young and old adult () collagens. Furthermore, a band profile modification in the sugar region (1150 to ), generally related to the presence of AGEs, can be observed between newborns and adults. Taken together, these spectral modifications, although subtle, could be exploited by HCA to analyze spectra from different-aged type I collagens [Fig. 4(b)]. The generated dendrogram showed a good discrimination with age since all spectra were correctly assigned to their respective age groups. The group corresponding to the newborns is the furthest from the two other age conditions. Furthermore, by inspecting the heterogeneity scale, the old-adult group appeared to be more homogeneous compared with the newborn and young-adult groups. Fig. 4Analysis of S-FTIR spectra from different-aged type I collagen coatings with the mean spectra presented in the 1800 to spectral range (a). Spectra were extracted from cluster 4 of the FCM images for each collagen age group and defined as “intact collagen spectra.” The difference observed for the peak maximum of the Amide II band as a function of collagen age is indicated by the arrow. Results of HCA clustering (b) are displayed via a dendrogram in which spectra are clustered according to their heterogeneity degree. 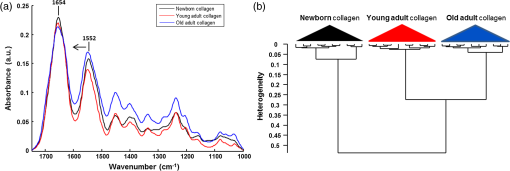 3.3.3.Analysis of cell/collagen interaction areasThis was performed by considering spectra extracted from the FCM images (cluster 3) for each collagen-age condition. Figure 5(a) depicts the mean spectra corresponding to the interaction areas between HT1080 cells and the three-different age collagens. For all conditions, the Amide I band was at , whereas the Amide II band was observed at for newborns and young adults, and at for old adults. No significant shifts were observed for the Amide III band (1300 to ) and the sugar region (1150 to ) upon comparing the three age conditions. However, the dendrogram obtained by HCA clustering [Fig. 5(b)] showed discrimination between the three conditions of cell/collagen contact areas. This may be explained by changes in relative intensities of bands, for instance the Amide I, II, and III bands, and the lower frequencies. Fig. 5Analysis of S-FTIR spectra from cell/collagen peripheral areas as a function of collagen age with the mean spectra presented in the 1800 to spectral range (a). Spectra were extracted from the cluster 3 of FCM images for each collagen age group and defined as “cell/collagen contact spectra.” Results of HCA clustering (b) are displayed via a dendrogram in which spectra are clustered according to their heterogeneity degree. 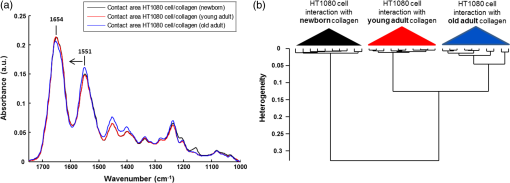 In order to highlight the possible existing age-related differences in cell/collagen contact areas, we have analyzed for each condition, the difference spectra obtained by subtracting the age-corresponding spectrum of intact collagen from that of the cell/collagen contact area. Thus, the contribution of intact collagen was minimized. These difference spectra are displayed in Figs. 6(a), 6(b), and 6(c), for newborns, young and old adults, respectively, and are offset for clarity. From this analysis, it can be observed that spectral differences showed a similar profile in the protein absorption bands (Amide I, II, and III) for newborns and old adults, and in the sugar region (1150 to ) for young and old adults. Fig. 6Difference spectra calculated by subtracting each corresponding intact collagen spectrum from that of the cell/collagen contact spectrum. This was computed for each collagen age condition: newborn (top), young adult (middle), and old adult (bottom). Spectra were offset for clarity and the regions with higher changes are highlighted by the gray bars. 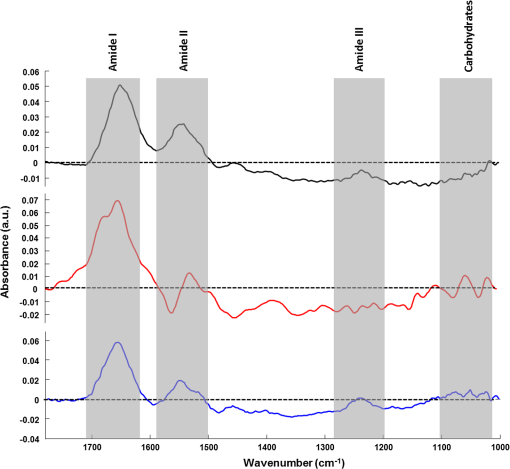 These two data sets (clusters 3 and 4) were further analyzed by comparing two AGEs-related spectral markers that have been previously reported. These spectral markers are shown in Fig. 7, where cluster centroid spectra corresponding to different-aged collagens were compared for intact collagen [Fig. 7(a)] and for contact areas [Fig. 7(b)]. The first marker of AGEs, , was calculated by ratioing the intensity of the sugar band to that of the Amide I band.27 The second AGEs marker, , was based on the work of Birarda et al.,28 where the authors calculated the ratio of the band area of the sugar region (1180 to ) to that of the Amide II band (1600 to ). An increase of these two markers suggests an increase in AGEs. The results are summarized in Table 1 where it can be seen that both markers showed a similar tendency for the studied cases. The intensity ratio and the band area ratio both increased when the old adult data were compared to those of the newborn and the young adult in the case of intact collagens. In contrast with intact collagens, the two ratios calculated for the contact areas remained constant for the three age groups and exhibited lower values; the latter being more marked (twofold to threefold) for old adults. Fig. 7Analysis of cluster centroid spectra from intact collagens (a) and from cell/collagen contact areas (b) as a function of collagen-age. The two filled spectral bands (sugar band between 1180 and , and the Amide II band between 1600 and were then used for calculating ratios previously described as advanced glycation endproducts (AGEs)-related spectral markers (see Table 1). 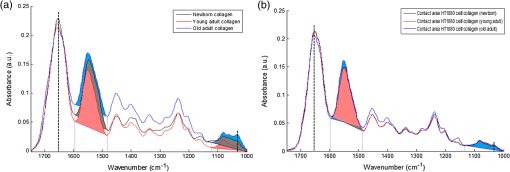 Table 1Advanced glycation end products (AGEs)-related spectral markers as a function of collagen age. The intensity ratio I1032/I1655 and the band area ratio Asugar/Aamide II were calculated for both intact collagen and cell/collagen contact data sets, and compared as a function of collagen-age. 4.DiscussionUnderstanding the interactions between cancer cells and their microenvironment constitutes an important step in experimental oncology to gain better insights into key cellular processes, such as proliferation, differentiation, and invasion. Type I collagen, a major component of the tumor microenvironment, is an ideal candidate for investigating these interactions while taking into account the process of protein aging. In this study, we employed the S-FTIR microspectroscopy to acquire spatially resolved spectral biomolecular information in a model of single human HT1080 cancer cells interacting with different-aged type I collagen networks. Even if infrared analysis at the cellular level has already been performed with conventional Globar sources, our aim was to acquire high spatially resolved chemical information not only from the single cell itself but also from the cell/collagen contact regions and from the intact collagen. This was feasible with small apertures by combining FTIR microspectroscopy with the high brightness of the synchrotron source. We also expected the spectral differences to be weak, but with this set-up good quality and exploitable spectral maps could be achieved. The FTIR microspectroscopy of single isolated cells has often been prone to physical effects like the Mie and resonant Mie scattering and dispersive phenomena, causing spectral artifacts that can lead to spectral misinterpretation. These were previously described for single cells or small samples directly analyzed on infrared substrates.29–31 In our data, these effects were weak or nonexistent because although we analyzed single cells, they were not completely isolated but were surrounded by the collagen matrix. Therefore, our S-FTIR spectra were preprocessed using the conventional EMSC algorithm18 that did not take these artifacts into account. The high brightness of the S-FTIR approach has previously been used to analyze the proteolytic activity of tumor cells in gelatin matrices.32 However, this is the first study that focuses on the collagen aging factor in the cell/ECM model. The cell’s surrounding microenvironment is indeed an essential criterion that needs to be taken into account for studying tumor processes, and previous works have demonstrated that posttranslational modifications of type I collagen occurring during aging or age-related pathological processes have an impact on the behavior of HT1080 cancer cells.9 The three age groups studied here correspond respectively to physiological states of newborns, young adults, and old adults,33 thus allowing us to work on a model representative of a pertinent aging range. Color-coded spectral images of single cells grown onto different-aged collagen coatings were reconstructed using -means and FCM clustering methods. The first method allowed the discrimination of the matrix information from the cellular entity. However, one limitation of the -means is that each pixel is assigned to only one cluster with the consequence of a lack of nuance to distinguish between intact collagen and collagen interacting with the cell. This drawback was overcome by using FCM, which allowed each pixel to be assigned to every cluster with an associated membership value varying between 0 (no class membership) and 1 (highest degree of cluster membership).25 Hence, this approach permitted us to obtain a nuance in the cluster images, revealing a progressive variation in the biochemical information upon going from the intracellular region (clusters 1 and 2), to the cell periphery (cluster 3), and to the intact collagen network (cluster 4). The analysis of intact collagen showed that Amide I and III bands did not exhibit any significant shift as a function of age, indicating that the triple helical structure of the protein was not affected during aging. On the other hand, the upshift observed in the Amide II band (when comparing newborn with young and old adults) suggests weak conformational changes in the tertiary structure of collagen, such as turns of amino-acid exposure, due to an accumulation of cross-linking AGEs with age. We previously reported such spectral differences for in vitro glycated collagens.27 We hypothesize that, with the accumulation of cross-linking compounds such as AGEs, the backbone and the rigidity of the protein increased, leading to changes in the amino-acid exposure. The old adult age-group also exhibited a very distinct cluster in the HCA analysis. This could be explained by the age-related modifications in biomechanical properties due to the AGEs addition, leading to an increase of nonenzymatic cross-links.6,8 Furthermore, the increase in AGEs with age can be monitored via the increase of two spectral indicators, the intensity ratio ()27 and the band area ratio ().28 The high ratios obtained in old adults compared with younger groups correlate well with our recently reported auto-fluorescence and electrophoresis data that support an increase of AGEs with age.34 Another previous study confirmed that modifications in the infrared band of sugars (1150 to ), especially the increase of the carbohydrate peak intensity, are directly and proportionally linked to the glycation level.35 All these observations clearly highlight that the sugar band constitutes a good and semi-quantitative infrared marker of the AGEs accumulation occurring during aging and age-related processes. The clustering results showed that the highest spectral distances were observed for the newborn collagen I group; this could be explained by the natural history of collagen from gestation to childhood periods during which collagen fibers are not yet mature and present a defect of their alignment in spite of a high content in type I collagen.36,37 The use of the S-FTIR label-free biophotonic method constitutes an approach complementary to the conventional biochemical techniques for investigating the impact of ECM proteins on the tumor cell behavior. Here, we focused on the peripheral contact zones between HT1080 cancer cells and type I collagen networks. Our data show that the calculation of the two AGEs indicators described above was leveled to constant values for the contact zones of the three age-groups. In addition, in the case of the old adult contact zone, a twofold to threefold drastic reduction of these indicators was observed compared with the intact collagen age-groups, which tends to suggest a masking of the biochemical spectral information. At the level of the protein structure, from the difference spectra, it appears that the old adult and newborn collagen contact zones exhibit a quite similar profile in the corresponding bands, whereas for the young adult, a perturbation of its secondary structure is noticed as witnessed by the changes observed at the level of the Amide I, II, and III bands. These findings are interesting and to the best of our knowledge have not been previously reported. The mechanisms of interaction at the level of these contact zones and as a function of age appear quite complex and require other complementary investigations for understanding them. Methods like Raman microspectroscopy could produce complementary vibrational information and other biophotonic approaches like polarized second harmonic generation could help to image the cell/collagen contact zones and inform on morphological parameters, such as the molecular order, the degree of orientational freedom, the molecular constraint, and rigidity of the collagen fibers.38 Indeed, these should be supported by conventional biochemical analysis. 5.ConclusionThis study demonstrates the potential of synchrotron-based infrared microspectroscopy to map single-tumor cells grown on a matrix substrate, in a direct, label-free, and noninvasive way. For the different collagen age-groups, it helped to provide specific information on the cell/collagen peripheral contact zones, where key processes take place during tumor progression. The application of image clustering techniques allowed differentiating the spectral information of the collagen coatings from that of the cell and further providing a gradation in the cluster images that revealed a progressive variation in the biochemical information upon going from the intracellular region, to the cell periphery, and to the intact collagen network. Two indicators based on sugar/protein absorption bands either via the ratio of band intensities or via that of band areas showed a net increase of AGEs accumulation in the old-adult intact collagens. This tendency disappeared in the presence of the HT1080 cells due to a masking of the biochemical information. Such S-FTIR data are reported for the first time and necessitate complementary biochemical and morphological investigations to achieve a better insight into the modifications that take place in the contact zones of the different-aged collagens. This approach holds promises for single-live cell studies with FTIR microspectroscopy and, at the same time, minimizes undesired optical effects like scattering and dispersion artifacts. This feasibility study, therefore, opens the way for further investigations on FTIR imaging of single-tumor cells while at the same time integrating the age-related modifications of ECM components. It appears to be promising to apply this approach to study single cells growing on more complex culture models such as three-dimensional matrices which can better mimic the cell microenvironment.39 AcknowledgmentsM.G. and C. E. are recipients of doctoral fellowships from Région Champagne-Ardenne. We acknowledge Diamond Light Source for time on B22-MIRIAM beamline, cell culture and peripheral lab07 facilities under the proposals 8422-1 and 8878-1. The research leading to these results has received funding from the European Community’s Seventh Framework Programme (FP7/2007–2013) under grant agreement n° 226716 via the French Embassy in London, UK. This study was also supported by grants of the Centre National pour la Recherche Scientifique (CNRS), Cancéropôle Grand-Est and FEDER/CEPER Champagne-Ardenne. ReferencesD. HanahanR. A. Weinberg,
“Hallmarks of cancer: the next generation,”
Cell, 144
(5), 646
–674
(2011). http://dx.doi.org/10.1016/j.cell.2011.02.013 CELLB5 0092-8674 Google Scholar
N. E. SounniA. Noel,
“Targeting the tumor microenvironment for cancer therapy,”
Clin. Chem., 59
(1), 85
–93
(2013). http://dx.doi.org/10.1373/clinchem.2012.185363 CLCHAU 0009-9147 Google Scholar
I. Serebriiskiiet al.,
“Fibroblast-derived 3D matrix differentially regulates the growth and drug-responsiveness of human cancer cells,”
Matrix Biol., 27
(6), 573
–585
(2008). http://dx.doi.org/10.1016/j.matbio.2008.02.008 MTBOEC 0945-053X Google Scholar
R. G. PaulA. J. Bailey,
“The effect of advanced glycation end-product formation upon cell-matrix interactions,”
Int. J. Biochem. Cell Biol., 31
(6), 653
–660
(1999). http://dx.doi.org/10.1016/S1357-2725(99)00023-0 IJBBFU 1357-2725 Google Scholar
D. G. Dyeret al.,
“Accumulation of Maillard reaction products in skin collagen in diabetes and aging,”
J Clin. Invest., 91
(6), 2463
–2469
(1993). http://dx.doi.org/10.1172/JCI116481 JCINAO 0021-9738 Google Scholar
A. BruelH. Oxlund,
“Changes in biomechanical properties, composition of collagen and elastin, and advanced glycation endproducts of the rat aorta in relation to age,”
Atherosclerosis, 127
(2), 155
–165
(1996). http://dx.doi.org/10.1016/S0021-9150(96)05947-3 ATHSBL 0021-9150 Google Scholar
R. G. PaulA. J. Bailey,
“Glycation of collagen: the basis of its central role in the late complications of ageing and diabetes,”
Int. J. Biochem. Cell Biol., 28
(12), 1297
–1310
(1996). http://dx.doi.org/10.1016/S1357-2725(96)00079-9 IJBBFU 1357-2725 Google Scholar
N. C. AveryA. J. Bailey,
“The effects of the Maillard reaction on the physical properties and cell interactions of collagen,”
Pathol. Biol., 54
(7), 387
–395
(2006). PTBIAN Google Scholar
G. Saidet al.,
“Impact of carbamylation and glycation of collagen type I on migration of HT1080 human fibrosarcoma cells,”
Int. J. Oncol, 40
(6), 1797
–1804
(2012). IJONES 1019-6439 Google Scholar
N. RucciP. SanitàA. Angelucci,
“Roles of metalloproteases in metastatic niche,”
Curr. Mol. Med., 11
(8), 609
–622
(2011). http://dx.doi.org/10.2174/156652411797536705 CMMUBP 1566-5240 Google Scholar
M. LuoJ. L. Guan,
“Focal adhesion kinase: a prominent determinant in breast cancer initiation, progression and metastasis,”
Cancer Lett., 289
(2), 127
–139
(2010). http://dx.doi.org/10.1016/j.canlet.2009.07.005 CALEDQ 0304-3835 Google Scholar
P. ProvenzanoK. W. EliceiriP. J. Keely,
“Multiphoton microscopy and fluorescence lifetime imaging microscopy (FLIM) to monitor metastasis and the tumor microenvironment,”
Clin. Exp. Metastasis, 26
(4), 357
–370
(2009). http://dx.doi.org/10.1007/s10585-008-9204-0 CEXMD2 0262-0898 Google Scholar
H. Y. Holmanet al.,
“Synchrotron infrared spectromicroscopy as a novel bioanalytical microprobe for individual living cells: cytotoxicity considerations,”
J. Biomed. Opt., 7
(3), 417
–424
(2002). http://dx.doi.org/10.1117/1.1485299 JBOPFO 1083-3668 Google Scholar
F. Drauxet al.,
“Raman spectral imaging of single living cancer cells: a preliminary study,”
Analyst, 134
(3), 542
–548
(2009). http://dx.doi.org/10.1039/b812610k ANLYAG 0365-4885 Google Scholar
J. Pijankaet al.,
“Synchrotron-based FTIR spectra of stained single cells. Towards a clinical application in pathology,”
Lab. Invest., 90
(5), 797
–807
(2010). http://dx.doi.org/10.1038/labinvest.2010.8 LAINAW 0023-6837 Google Scholar
A. D. Meadeet al.,
“Growth substrate induced functional changes elucidated by FTIR and Raman spectroscopy in in-vitro-cultured human keratinocytes,”
Anal. Bioanal. Chem., 387
(5), 1717
–1728
(2007). http://dx.doi.org/10.1007/s00216-006-0876-5 ABCNBP 1618-2642 Google Scholar
R. Garnotelet al.,
“Human blood monocytes interact with type I collagen through alpha x beta 2 integrin (CD11c-CD18, gp150-95),”
J. Immunol., 164
(11), 5928
–5934
(2000). http://dx.doi.org/10.4049/jimmunol.164.11.5928 JOIMA3 0022-1767 Google Scholar
A. Kohleret al.,
“Extended multiplicative signal correction as a tool for separation and characterization of physical and chemical information in Fourier transform infrared microscopy images of cryo-sections of beef loin,”
Appl. Spectrosc., 59
(6), 707
–716
(2005). http://dx.doi.org/10.1366/0003702054280649 APSPA4 0003-7028 Google Scholar
J. Nallalaet al.,
“Infrared spectral imaging as a novel approach for histopathological recognition in colon cancer diagnosis,”
J. Biomed. Opt., 17
(11), 116013
(2012). http://dx.doi.org/10.1117/1.JBO.17.11.116013 JBOPFO 1083-3668 Google Scholar
J. H. Ward,
“Hierarchical grouping to optimize an objective function,”
J. Am. Stat. Assoc., 58 236
–244
(1963). Google Scholar
F. Drauxet al.,
“IR spectroscopy reveals effect of non-cytotoxic doses of anti-tumour drug on cancer cells,”
Anal. Bioanal. Chem., 395
(7), 2293
–2301
(2009). http://dx.doi.org/10.1007/s00216-009-3140-y ABCNBP 1618-2642 Google Scholar
J. B. MacQueen,
in Proc 5th Berkeley Symp. Mathematical Statistics and Probability,
281
–297
(1967). Google Scholar
P. Laschet al.,
“Imaging of colorectal adenocarcinoma using FT-IR microspectroscopy and cluster analysis,”
Biochim. Biophys. Acta, 1688
(2), 176
–186
(2004). http://dx.doi.org/10.1016/j.bbadis.2003.12.006 BBACAQ 0006-3002 Google Scholar
J. C. Bezdek, Pattern Recognition with Fuzzy Objective Function Algorithms, Plenum Press, New York
(1981). Google Scholar
D. Sebiskveradzeet al.,
“Automation of an algorithm based on fuzzy clustering for analyzing tumoral heterogeneity in human skin carcinoma tissue sections,”
Lab. Invest., 91
(5), 799
–811
(2011). http://dx.doi.org/10.1038/labinvest.2011.13 LAINAW 0023-6837 Google Scholar
P. DumasG. D. SockalingumJ. Sulé-Suso,
“Adding synchrotron radiation to infrared microspectroscopy: what’s new in biomedical applications?,”
Trends Biotechnol., 25
(1), 40
–44
(2007). http://dx.doi.org/10.1016/j.tibtech.2006.11.002 TRBIDM 0167-7799 Google Scholar
M. Guilbertet al.,
“Probing non-enzymatic glycation of type I collagen: a novel approach using Raman and infrared biophotonic methods,”
Biochim. Biophys. Acta, 1830
(6), 3525
–3531
(2013). http://dx.doi.org/10.1016/j.bbagen.2013.01.016 BBACAQ 0006-3002 Google Scholar
G. Birardaet al.,
“Synchrotron infrared imaging of advanced glycation endproducts (AGEs) in cardiac tissue from mice fed high glycemic diets,”
Biomed. Spectrosc. Imaging, 2
(4), 301
–315
(2013). BSIIAX 2212-8794 Google Scholar
C. Matthauset al.,
“Infrared and Raman microscopy in cell biology,”
Methods Cell Biol., 89 275
–308
(2008). http://dx.doi.org/10.1016/S0091-679X(08)00610-9 MCBLAG 0091-679X Google Scholar
P. Bassanet al.,
“Resonant Mie scattering in infrared spectroscopy of biological materials—understanding the ‘dispersion artefact’,”
Analyst, 134
(8), 1586
–1593
(2009). http://dx.doi.org/10.1039/b904808a ANLYAG 0365-4885 Google Scholar
P. Bassanet al.,
“Resonant Mie scattering (RMieS) correction of infrared spectra from highly scattering biological samples,”
Analyst, 135
(2), 268
–277
(2010). http://dx.doi.org/10.1039/b921056c ANLYAG 0365-4885 Google Scholar
S. FedermanL. M. MillerI. Sagi,
“Following matrix metalloproteinases activity near the cell boundary by infrared micro-spectroscopy,”
Matrix Biol., 21
(7), 567
–577
(2002). http://dx.doi.org/10.1016/S0945-053X(02)00089-6 MTBOEC 0945-053X Google Scholar
R. Quinn,
“Comparing rat’s to human’s age: how old is my rat in people years?,”
Nutrition, 21
(6), 775
–777
(2005). NUTRER Google Scholar
S. L. Wilsonet al.,
“A microscopic and macroscopic study of aging collagen on its molecular structure, mechanical properties, and cellular response,”
FASEB J., 28
(1), 14
–25
(2014). http://dx.doi.org/10.1096/fj.13-227579 FAJOEC 0892-6638 Google Scholar
R. RoyA. BoskeyL. J. Bonassar,
“Processing of type I collagen gels using nonenzymatic glycation,”
J. Biomed. Mater Res. A., 93
(3), 843
–851
(2010). 1549-3296 Google Scholar
Y. ItoI. Tamura,
“Age-related changes in collagen, laminin and tenascin in the infant rat submandibular gland,”
J. Osaka Dent. Univ., 31
(1–2), 19
–27
(1997). JODUA2 0475-2058 Google Scholar
E. Aikawaet al.,
“Human semilunar cardiac valve remodeling by activated cells from fetus to adult: implications for postnatal adaptation, pathology, and tissue engineering,”
Circulation, 113
(10), 1344
–1352
(2006). http://dx.doi.org/10.1161/CIRCULATIONAHA.105.591768 CIRCAZ 0009-7322 Google Scholar
D. Aït-Belkacemet al.,
“Microscopic structural study of collagen aging in isolated fibrils using polarized second harmonic generation,”
J. Biomed. Opt., 17
(8), 080506
(2012). http://dx.doi.org/10.1117/1.JBO.17.8.080506 JBOPFO 1083-3668 Google Scholar
E. Millerot-Serrurotet al.,
“3D collagen type I matrix inhibits the antimigratory effect of doxorubicin,”
Cancer Cell Int., 13 10
–26
(2010). CCIACC 1475-2867 Google Scholar
BiographyMarie Guilbert received her PhD degree in molecular and cellular biology/biophysics from the University of Reims Champagne-Ardenne (France) in 2012. During her PhD, she applied a multimodal biophotonic approach (SHG microscopy, Raman, infrared and synchrotron-infrared microspectroscopies) for investigating collagen aging and its impact on the tumor cell behavior. In 2013 she started studying cancer tissues by FTIR as a post doctoral fellow at the University of Brussels, Belgium. Christophe Eklouh-Molinier received his master’s degree in 2012 from the University of Reims Champagne-Ardenne in France. He is currently doing his PhD at the “Biophotonics and Technologies for Health” group of the CNRS Unit UMR 7369-MEDyC in Reims, France, in the field of biophotonics for probing complex biological systems. Katia Wehbe is a senior support scientist on the MIRIAM beamline for IR micro-spectroscopy at Diamond Light Source, the UK’s National Synchrotron Science Facility located in Oxfordshire, United Kingdom. Prior to joining Diamond in December 2008, she received her PhD form the University of Bordeaux, in France. Her general research interests cover the biological/biomedical applications of infrared micro-spectroscopy technique particularly involving the study of cells in different environments and cancer tissue screening. Josep Sule-Suso qualified in medicine and surgery in Barcelona. He did his training in clinical oncology in the United Kingdom. He then moved to the National Cancer Institute in Milan, Italy, where he spent 2 years working on tumor immunology. He came back to the UK to work at the University Hospital of North Staffordshire and Keele University. He combines his clinical work mainly in lung cancer, and basic and translational research in cancer diagnosis. Ying Yang is a reader of biomaterials in the Institute for Science & Technology in Medicine, Keele University, United Kingdom. She is an active member of SPIE and devotes her research to exploring optical imaging modalities for the characterization and monitoring of biomaterials, regenerative medicine products and as new clinical diagnosis tools. The research outcome of using OCT, confocal scanning microscopy, FTIR and Raman spectroscopy in the past years from her group is highly promising. Gianfelice Cinque is the principal scientist at the IR beamline MIRIAM of Diamond Light Source (UK) since its start in 2006. He joined Diamond from the INFN labs of Frascati, where he was responsible of the soft x-ray absorption spectroscopy beamline since 2001. His current research activity is in synchrotron radiation and IR microspectroscopy for biophysics and biomedicine, and on development of near-field IR imaging and coherent SR THz spectroscopy methods. He is author of 86 scientific publications with more than 1100 citations. Pierre Jeannesson is a professor of biochemistry and molecular biology at the School of Pharmacy, University of Reims Champagne-Ardenne. He graduated from Reims and Paris VI and obtained a PhD in cellular immunology. He then developed with biophysicists a translational cancer research in infrared and Raman microspectroscopies, and spectral imaging of cells and tissues with particular emphasis on the influence of the extracellular matrix components on the tumor cell response to chemotherapeutic agents. Ganesh D. Sockalingum received his PhD degree in 1991 from Southampton University, United Kingdom. He was a postdoctoral fellow in biophysics at the CEA-Saclay, France, from 1991 to 1992, lecturer from 1993 to 1999, associate professor in 1999, and then full professor in 2010 in the Department of Pharmacy, University of Reims Champagne-Ardenne. His major research interests cover biophotonics/biophysical approaches for probing complex biological systems and for diagnosis/prognosis of diseases in biofluids, cells, and tissues. |

