
|
|
1.IntroductionThe healthy adult human retina contains high concentrations of blue-light absorbing carotenoid compounds in its macular region, which is the diameter central retina location centered on the fovea and which contains high concentrations of cone photoreceptors. The latter are responsible for high-acuity color vision. Known as macular pigment (MP), the carotenoids consist of three subspecies: lutein, zeaxanthin, and meso-zeaxanthin, all located in the retinal layers traversed by light before it reaches the photoreceptor outer cell segments and retinal pigment epithelium. More specifically, they are located in Henle’s fiber layer in the central macula and in the inner and outer plexiform layers outside of the fovea.1,2 Due to its location in the inner part of the retinal layer system, the MP is thought to shield the deeper vulnerable tissue layers from light-induced damage. This is achieved by the MP by effectively absorbing the photoionizing deep-blue to UV wavelengths of ambient light which would otherwise reach the deeper retinal layers. The MP carotenoids are also thought to protect the tissue cells in their immediate vicinity through their well-known function as antioxidants. Much research carried out over the last two decades has investigated the role of the macular carotenoids in the prevention of age-related macular degeneration;3–5 more recently, their role has also been investigated in the improvement of visual acuity via reduction of deleterious glare effects.6 Several methodologies for noninvasive optical MP assessment are currently being pursued to facilitate the screening of large subject populations for MP status, to track changes over time, and/or to monitor MP uptake in response to supplementation. These include the relatively widely used psychophysical method of heterochromatic flicker photometry7 and three emerging imaging methods. All imaging methods permit a quantitative objective measurement of MP levels at any macular location and, in this way, provide detailed spatial information of MP levels over the whole macular region. The three imaging methods include direct MP detection via resonance Raman spectroscopy,8,9 indirect MP detection via lipofuscin fluorescence excitation spectroscopy, also known as autofluorescence spectroscopy,10,11 and indirect detection via fundus reflection spectroscopy.12–14 Autofluorescence imaging (AFI) approaches are currently emerging in commercially available laser ophthalmoscopy platforms that use 488 nm argon lasers in raster-scanning mode for lipofuscin fluorescence excitation, in combination with confocal detection and filtering of the fluorescence.15 Also, a reflection-based imaging approach is pursued in a commercially available fundus camera platform (Visucam, Zeiss Inc., Jena, Germany), which employs flashlamp-filtered blue light for illumination.16 Commercially available autofluorescence-based imaging with a fundus camera platform is still lacking, although it would have potential advantages over the raster-scanning platform due to its lower complexity. In autofluorescence spectroscopy, lipofuscin chromophores in the retinal pigment epithelial layer are generally excited with wavelengths that lie, respectively, within the blue spectral region where the absorption band of lipofuscin overlaps with the absorption band of the MP carotenoids, and with slightly longer wavelengths that still lie within the absorption region of lipofuscin but outside the absorption range of MP. This can be realized, for example, with narrow-band 488 nm blue and 532 nm green laser light sources, with suitably filtered conventional arc-lamp or tungsten-halogen light sources, with light-emitting diodes (LEDs), or with suitable sets of wavelengths provided by other light sources. Green-light excitation leads to unattenuated lipofuscin fluorescence in the macular region as well as in all peripheral regions of the retinal hemisphere. Blue light excitation, in contrast, leads to unattenuated lipofuscin fluorescence only in the peripheral regions; in the macular region, the fluorescence intensity is attenuated due to blue-light absorbing MP carotenoids. By comparing the lipofuscin fluorescence intensities obtained with both excitation wavelengths in foveal and peripheral retina regions, the single-pass absorption of the MP can be derived and quantified as the optical density (OD). Specifically, the macular pigment optical density (MPOD) is calculated for any particular location inside the macular region as the negative decimal logarithm of the ratio of the lipofuscin intensity at that macular location, , to the lipofuscin intensity at peripheral locations, . The lipofuscin fluorescence, which has a high oscillator strength and which occurs in a far-red to near-infrared broad wavelength band, is relatively easily detected in retinal (fundus) imaging configurations with a charge-coupled detector array (CCD array) under conveniently short light exposure conditions. In the healthy retina, lipofuscin is usually distributed uniformly over the retinal pigment epithelial layer. It has been shown that under this condition, two-wavelength AFI with blue and green excitation light leads to the same MP results as one-wavelength AFI with blue light excitation, i.e., the step of testing the uniformity of the lipofuscin distribution with the green reference excitation can be omitted.11 Issues in the derivation of MP characteristics via AFI can arise if absorption, fluorescence, and scattering effects are present due to the presence of other compounds besides lipofuscin and carotenoids. Potentially, these other compounds would interfere with the optical detection scheme for MP and lead to nominal levels that are artifactually reduced. One such issue is the fluorescence of the natural lens, which occurs at wavelengths in the visible to far-red spectral region under the autofluorescence excitation conditions described above. It has been shown that this fluorescence can be largely avoided by limiting the lipofuscin fluorescence detection to the long-wavelength shoulder of its emission band, i.e., to wavelengths above .11 Under these detection conditions, the image contrast between lipofuscin intensities in the macular region and the periphery is significantly improved. Another issue is the question of potential opacities in anterior ocular media, most importantly, the transmission status of the natural lens, where cataracts, often found in elderly subjects, could lead to AFI contrast degradation due to excessive combined scattering and absorption effects.17 It is necessary, therefore, to investigate the quantitative influence of media opacities, at least those caused by the predominant lens cataracts, on the achievable MP levels in AFI imaging and to possibly derive correction factors for the AFI images in the presence of pathologies.17 2.Experimental Results2.1.InstrumentationTwo-dimensional lipofuscin intensity pixel maps, AFI images, were recorded with a 43 deg field-of-view nonmydriatic fundus camera platform, employing short-pulse (10 ms) xenon flashlamp excitation. Using a bandpass filter with transmission in the 477- to 495-nm region in the excitation light path, it provides high spectral overlap with both the lipofuscin and MP absorption bands. For fluorescence detection, the instrument uses a high-sensitivity CCD camera that is filtered to detect and image the long-wavelength tails of the lipofuscin fluorescence in the 700- to 850-nm region. The limitation of the fluorescence detection to long wavelengths minimizes potentially confounding fluorescence effects occurring in the natural lenses of elderly subjects. The camera provides automatic alignment and focus adjustment of the subject eye during the measurement. Automatic alignment is realized via tracking of the anterior eye segment with 950-nm illumination and imaging with a dedicated IR detector array. Automatic focusing is realized via projection and merging of split images of a focusing chart onto the fundus using an infrared LED light source and imaging with the same array. The AFI image pixel intensities were digitized with an 8 bit resolution. The dark noise of the detection system was compared to levels. Excitation power and camera sensitivity were kept constant in all imaging experiments. 2.2.Image ProcessingDepending on the acceptable image quality in terms of completeness (i.e., nonobstructed image due to blinking of the eye) and adequate centering of the macula in the image, AFI images were evaluated for obtainable MPOD characteristics. General AFI image clarity and contrast parameters, retinal blood vessel contrast, and presurgery lens opacity scores [Lens Opacities Classification System III (LOCS III)]18 were investigated as potential predictors for image degradation. An AFI image of a subject eye with clear ocular media is shown in Fig. 1, along with an illustration of the image processing steps used in deriving the MPOD level across the macular region of the subject eye. In the unprocessed AFI image, the MP is generally seen as a heavily attenuated fluorescence region, i.e., a dark-shaded central image region. Retinal blood vessels are seen in the vicinity of the macula; the optic disc appears near the edge of the image, with all corresponding image/pixel areas featuring heavily attenuated fluorescence intensities. The AFI image shown in this example is well centered on the macula, it is in focus, and the illumination is uniform, as evidenced, respectively, by clearly resolved dark blood vessels and by the evenly high lipofuscin fluorescence intensities surrounding the macular area. The high lipofuscin intensities appear as bright, ring-shaped, image regions. For the derivation of quantitative MPOD characteristics from the image pixel intensity map, circular pixel areas, each with a diameter of 25 pixels (outlined by dotted circles), are chosen in the vicinity of the macula at eccentricity and at image/tissue locations that are free of blood vessels. These pixel areas with their associated intensities are labeled as . Similarly, much smaller pixel areas (4 pixels) are chosen within the attenuated fluorescence intensity region of the macula (not shown), labeled as . Fig. 1(a) Autofluorescence imaging (AFI) image of a subject eye with clear ocular media, showing key image features of interest and illustrating the image processing concept for the derivation of macular pigment (MP) optical density levels via selection of circular pixel intensity areas with high () and low () intensity regions, respectively. (b) MPOD line plot along nasal-temporal meridian derived from the AFI image (a). (c) Three-dimensional spatial MPOD distribution, shown with gray-scaled MPOD levels.  The MPOD levels for the small pixel areas within the macula are calculated according to where is the average of the various intensities. A multiplication factor of 1.4 is used to account for the spectral mismatch between the excitation light spectrum and the maximum of the MP absorption band. As indicated by the MPOD line plot along the nasal-temporal meridian and a 3-dim plot of the spatial distribution, respectively, the highest MPOD level is 0.8 for this AFI image, and it occurs within a nearly circularly symmetrical MP distribution. The high pixel density of the instrument’s CCD camera allows one to spatially expand the macular region of interest in the AFI images and to look for spatial fine structure in the MP distributions. This is illustrated in Fig. 2 for the AFI image of a subject eye that has a ring-shaped MP distribution with a central dip when viewed on an expanded scale.Fig. 2Demonstration of spatial MP fine structure obtainable from AFI images with the instrument platform used in the clinical study. The example shows an AFI image of a subject eye having a ring-shaped MP distribution with a central dip, most clearly seen in the central line plot and three-dimensional spatial distribution derived from the image.  The nominal MPOD levels derivable from the AFI images are obviously dependent on the achievable image contrast, i.e., the ratio between the lipofuscin fluorescence intensities in the macular region of the image and the intensities in the periphery. For meaningful image processing, it is necessary to establish, besides general image quality criteria (proper focusing, uniform illumination, centering of macula in the image, etc.), the status of ocular media transparency, and, if such media opacities are too severe for the derivation of accurate MPOD levels, to establish a criterion for image rejection. 2.3.Imaging Effects from Blood Vessels and Media OpacitiesA convenient indicator for acceptable image quality is the appearance of retinal blood vessels. Since they strongly absorb the blue excitation light, they appear as sharp, pronounced dips when plotting the fluorescence intensity levels recorded in the AFI pixel maps along any chosen direction across the images. Alternatively, the image quality can be judged from pixel intensity histograms that can be calculated for the whole AFI image or portions thereof. For this purpose, we used NIH ImageJ software. In an acceptable AFI image, like the image shown in Fig. 3(d), the corresponding pixel intensity histogram reveals a large width when plotting the number of pixels with identical intensities versus increasing intensity level; in an image blurred by media opacities, like in the image shown in Fig. 3(a), the corresponding image histogram will sharply peak at the intensity value that occurs most frequently in the blurred image, and the width of the histogram will be very narrow. Basically, it is impossible to derive even a nominal MPOD level from this image. Fig. 3(a) and (d) AFI images recorded before and after cataract surgery, respectively, for a case of a severe cataract. (b) and (e) Corresponding image pixel histograms. (c) and (f) Corresponding line plots along nasal-temporal meridians.  Opacities of ocular media anterior to the retina can be expected to degrade the image contrast achievable in AFI images in the macula area as well as in the peripheral retina. This is due to the combined scattering and absorption effects caused by the respective opacities. Anterior optical media include the cornea, the aqueous humor, the lens, and the vitreous. The strongest opacity effect can be expected from cataracts, often forming in human eyes with increasing age. Also, it has been shown that the transmission of the natural lens decreases with age.19 This effect could influence the AFI images as well. 2.4.Clinical Trial Methodology and ResultsTo investigate the quantitative effect of cataracts on the nominal MPOD levels derivable from AFI images, we conducted a clinical trial that involved the AFI of a large subject population. It included 93 subjects, all Japanese, aged 22 to 87 years (34 males and 59 females). The mean age was years. Inclusion criteria were as follows: (1) age of 20 years and higher; (2) no fundus diseases; (3) patients scheduled cataract surgery; and (4) written informed consent under the approval of the institutional review board of Seirei Hamamatsu General Hospital, Hamamatsu, Japan. Exclusion criteria were as follows: (1) any macular disease, (2) ocular media opacities other than cataract (corneal opacity, vitreous opacity, etc.), and (3) eyes that investigators determined inappropriate to measure MPOD due to any surgery-related complication. Patients had an ophthalmological examination within two weeks before surgery, including visual acuity testing and measurement of intraocular pressure. The lens opacity was evaluated in each case by two trained physicians (A.O. and Y.G.), who used a slit-lamp biomicroscope (Model SL-M, Carl Zeiss, Jena, Germany) to assess lens opacity scores, under mydriasis, according to the LOCS III standards.18 Mean LOCS III scores before surgery were as follows: nuclear color: 2.8; cortical opacity: 2.8; posterior subcapsular opacity: 2.3. AFI images were obtained for 140 eyes. Phacoemulsification was performed in all cases by two physicians (A.O. and Y.G.) using a phaco-chop or divide-and-conquer technique. After aspiration of the lens cortex, an intraocular lens (SN60WF, Alcon Japan, Tokyo, Japan) was implanted in the lens capsule. AFI images were obtained for 140 eyes before and within one week after surgery. To assess transmission changes potentially occurring with increasing age in the ocular media of healthy, cataract-free eyes, we also imaged 20 undiagnosed, nominally healthy subjects, varying in age from 25 to 55 years (mean age of 43.9 years). MPOD levels ranged from 0.26 to 0.75 (mean of 0.41). The effects of cataracts on the obtainable AFI image quality and derivable nominal MP characteristics are illustrated in Fig. 3 for a relatively severe cataract case, with diagnosed LOCS III scores of 4, 3, and 4 for nuclear, cortical, and posterior subcapsular lens opacities, respectively. Before cataract surgery for this patient, blood vessels and other landmark features are severely washed out, leading to a corresponding sharply peaked pixel intensity histogram for the whole fundus area. The latter is centered near pixel intensity 150, and the histogram has a full width at baseline of only of the intensities. Furthermore, the central line plot of pixel intensities shows only a negligible modulation. After cataract surgery, i.e., insertion of a high clear prosthetic lens, a high-quality AFI image is obtained from the same subject, however, with the MP showing up as a strongly attenuated central region, and with blood vessels and optic disk now clearly resolved. The associated pixel intensity histogram is now much wider, has a substructure, and has more pixels with lower intensities. This leads to a shift of the center of the histogram by to a lower pixel intensity of . The distribution of intensities shown in the histogram now has a width of of the intensity values, due to the increased information content of the image. The corresponding nasal-temporal line plot across the image shows a strong modulation of pixel intensities with a fluorescence intensity difference of between the center of the MP dip, which has a pixel intensity of , and the peripheral reference, which has a level of . In Fig. 4, the effects of cataracts on the obtainable AFI image quality are illustrated for a less severe, average-level, cataract case. The MP is still recognizable before surgery in this case as a faint shading of the central image area. Compared to the previous case, the associated pixel intensity histogram is slightly wider at half maximum () and much wider at its base; a central line plot shows a modulation of that is well recognizable above the background noise levels. Before surgery, it is still possible to determine a nominal MPOD level for this blurred image. After cataract surgery, a high-quality image is obtained again for this subject’s retina, with the MP showing up as a strongly attenuated central region, and with blood vessels and the optic disk clearly resolved. The associated pixel intensity histogram is again much wider (), has a substructure, and is shifted to lower intensities. A central line plot across the image shows a strong modulation of pixel intensities with a fluorescence intensity difference of between the center of the MP dip () and the peripheral reference (). Fig. 4(a) and (d) AFI images recorded before and after cataract surgery, respectively, for a case with a mild cataract. (b) and (e) Corresponding image pixel histograms. (c) and (f) Corresponding line plots along nasal-temporal meridians. 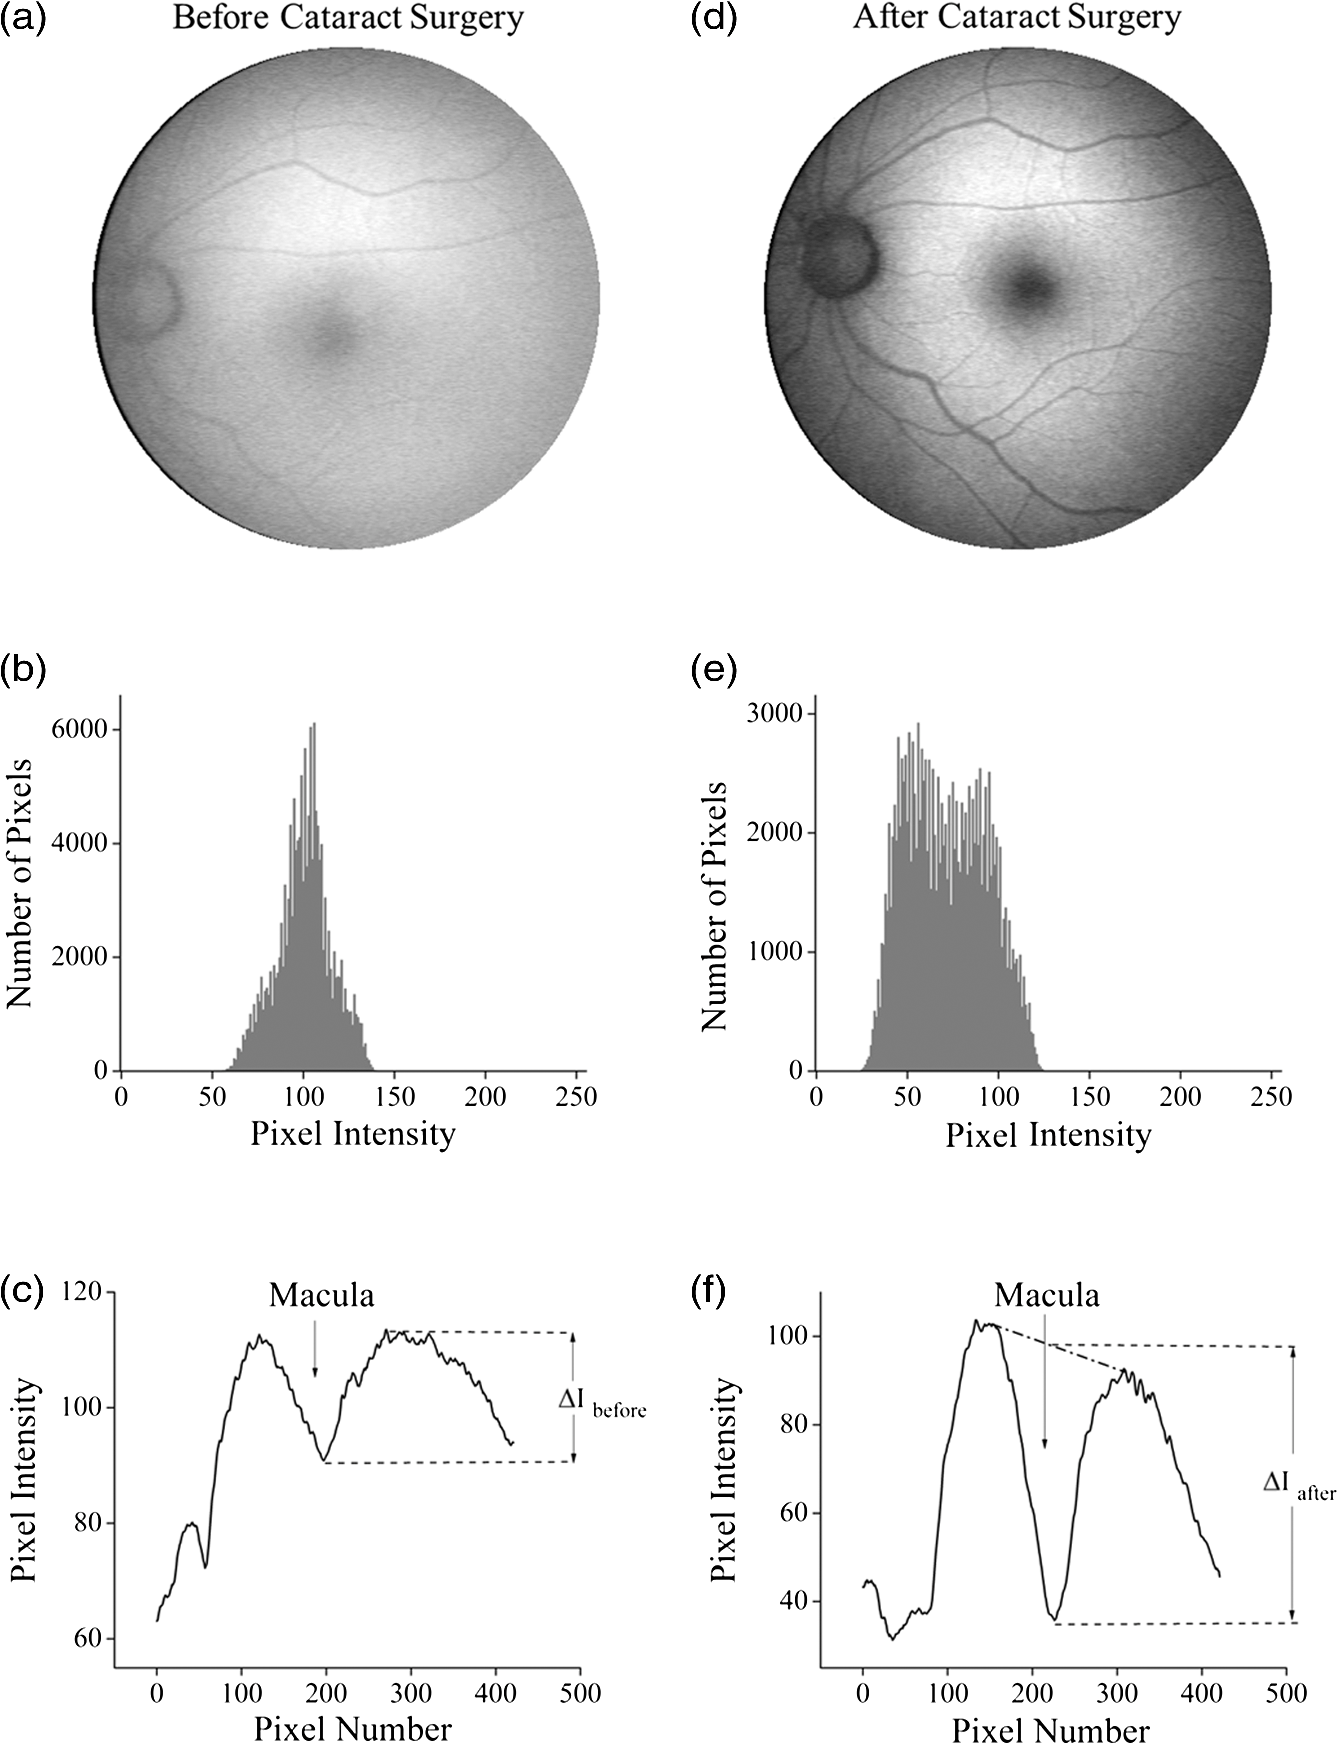 Similar comparisons of AFI images recorded for the enrolled subjects before and after cataract surgery allow us to establish a statistical correlation between the MPOD levels determined before and after surgery, providing the basis for opacity-corrected MPOD level estimates to within certain limits of confidence. In Fig. 5, the peak MPOD levels are shown for all eyes for which AFI images with an acceptable quality could be obtained before and after surgery (74 eyes), and for additional eyes for which MPOD levels could be obtained only after cataract surgery (55). Data points for some of the subject eyes overlap, so the number of data points shown is smaller than the number of subjects measured. As a criterion for image processability, a presurgery threshold image contrast was chosen corresponding to an MPOD limit of 0.06, which corresponds to an MP-caused pixel intensity attenuation that is three times above the detector noise. For all images with a contrast below the 0.06 limit, encountered in 40 eyes, a nominal MPOD level of 0.04 was used. The MPOD levels obtained for all those eyes after surgery are, therefore, lying on a vertical line in the plot, with a common presurgery MPOD level of 0.04. Accordingly, nominal presurgery MPOD levels vary between and 0.4, with a majority of subjects having nominally low MPOD levels . Only a small number of eyes (13) have nominal MPOD levels . Postsurgery levels vary between 0.25 and 0.87, with a large variation for low presurgery levels and a smaller variation for higher levels. This is in agreement with the fact that milder cataracts lead to less severe blurring and/or scattering of the excitation light, causing such eyes to show high presurgery MPOD levels relative to eyes with more severe cataracts. Fig. 5Plot showing MPOD levels for 74 subject eyes measured before and after cataract surgery, respectively. All MPOD levels lying below a threshold value of 0.06 optical density (OD) units before surgery were counted as 0.04 OD, thus appearing on a vertical line in the plot. All date points lie within a triangular boundary due to smaller spread of postsurgery MPOD levels with increasing nominal MPOD levels measured presurgery. 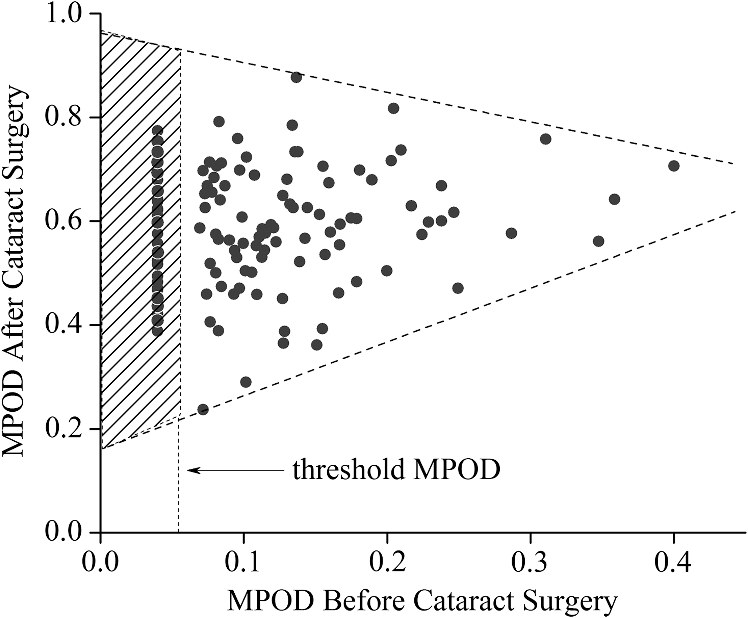 In Fig. 6, the MPOD levels for 140 eyes of 93 subjects, measured before and after cataract surgery, respectively, are plotted in histogram form. Before surgery, most subjects have a low nominal MPOD level, with the number of subjects with higher levels decreasing roughly exponentially. After surgery, the MPOD distribution has a roughly bell-shaped envelope and shows that most cataract patients have a peak MPOD level of . Fig. 6Histograms of the MPOD levels for 140 eyes of 93 subjects, measured before and after cataract surgery, respectively. Before surgery, most subjects have a low nominal MPOD level, with the number of subjects with higher nominal levels decreasing roughly exponentially. After surgery, the MPOD distribution has a skewed, roughly bell-shaped envelope, with most subjects having an MPOD level of 0.6.  Combining the findings of Figs. 4 and 5, we conclude that nominal presurgery MPOD levels in the higher range, such as near 0.3 OD units, are underestimated, on average, by a relatively small factor (factor 2 in this case), while presurgery levels in the low range, such as near 0.15 OD units, are underestimated, on average, by a larger factor (factor 4 for this nominally low level). 2.5.Pixel Intensity Histograms of Central Fundus Areas as Measures for Macular Pigment BlurringA more refined correction for cataract-caused image blurring can be derived from AFI image pixel intensity histograms. In Fig. 7, such histograms are compared for blurred presurgery images and clear postsurgery images for two subjects with strong and weak lens cataracts, respectively, and with both cases processable for nominal MP levels (different subject eyes compared to Figs. 3 and 4). The effects of the scattering are shown in each case for the shape of the histograms derived from pixel areas that specifically exclude the image areas of the optic disk. In this case, the lower histogram intensities originate exclusively from MP attenuation. This can be achieved by defining a circular fundus (pixel) area, centered on the macula, with a radius corresponding to an eccentricity that is lower than the eccentricity to the edge of the optic disk. Using a suitable eccentricity of , which lies roughly in the middle between the center of the macula and the edge of the optic disk, the effects of scattering are shown for the two sets of pre- and postsurgery histograms. For subject 1, having a low nominal MPOD level of presurgery and an MPOD level of 0.78 postsurgery, due to the strong scattering, the presurgery pixel intensity width at the base is relatively narrow, ranging from pixel intensities 70 to 100, while the postsurgery levels, obtained through clear ocular media, range from to 130. For subject 2, having a nominal MPOD level of 0.35, the presurgery intensity range extends from 50 to 115. Postsurgery, the MPOD level is 0.64, and the postsurgery histogram width at base extends from to 115. A comparison of the base histogram widths for the two subjects reveals that they are indicative of the degree of scattering existing prior to surgery, i.e., small widths indicate stronger scattering than large widths. Fig. 7Pixel intensity histogram characteristics of AFI images obtained for two subject eyes with strong and weak cataract, respectively. Results are calculated for the central fundus area with 7 deg eccentricity, thus excluding the effects of the optic disk. In both cases, the histograms are relatively narrow before surgery, with the histogram for the strong cataract having a smaller base width relative to the weak cataract. After surgery, both histograms are significantly wider and show some substructure. 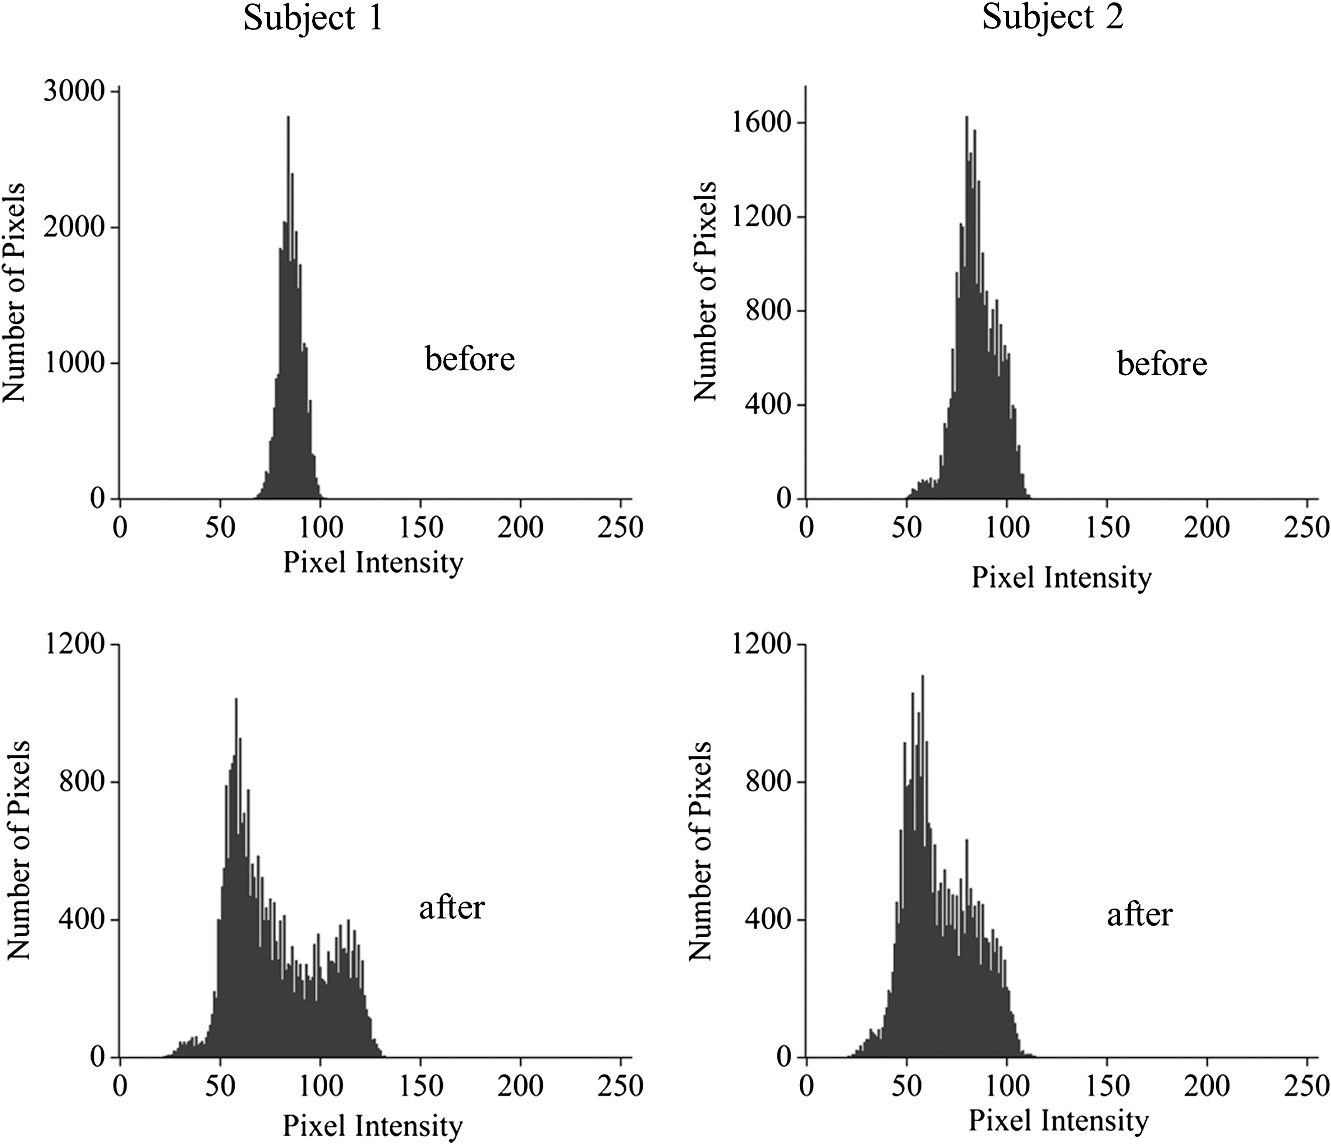 In Fig. 8, the base widths of all such pixel intensity histograms for the pre- and post-surgery AFI images of the clinical population are plotted. The base widths were measured as the range of pixel intensities between the high and low limits for 3 pixels with identical intensity. Prior to surgery, the average base width is to 40 pixels; after surgery, it increases about threefold, on average, to . This large base width can be regarded as an ideal value in AFI imaging with the used instrument configuration. In Fig. 9, the ratios of all MPOD levels determined pre- and postsurgery are plotted for each subject versus the histogram base width presurgery, with all data shown as filled circles. Also included and used as an anchoring point, is the ideal histogram base width of 100, which would correspond to a ratio of 1 for an ideal AFI image (like those obtained after cataract surgery). A parabolic fit to all data yields a high Pearson correlation coefficient of 0.89, as calculated with OriginLab Corp. (Northampton, Massachusetts) Origin software, and illustrates a rapid decrease of the ratios with increasing base width presurgery. For small base widths of the presurgery histograms, the ratios constitute a large reduction factor (up to ) of the actual MPOD levels existing in the subjects’ retinas; for large base widths, the ratio is converging to the factor of 1 for images with optimum clarity. A Bland-Altman plot of the difference between actual (postsurgery) and estimated MPOD levels versus their averages shows that 84% of the data points are within one standard deviation of 0.24. Fig. 8Number of subjects versus pixel intensity histogram base widths, determined from all AFI images recorded before and after cataract surgery, respectively. Both plots show a roughly bell-shaped distribution. Due to high scattering presurgery, the corresponding average histogram base width is 30 to 40 intensity units. Postsurgery, after implantation of a clear prosthetic lens, the average histogram base width is increased about threefold, i.e., to the 100 to 110 intensity unit range.  Fig. 9Plot of MPOD ratios between pre and postsurgery levels for 74 subjects versus base widths of pixel intensity histograms derived from presurgery AFI images, shown as filled circles. Square: ideal base width of 100 corresponding to ratio of 1 for an ideal image. A parabolic fit of the data yields a high Pearson correlation coefficient of 0.89 and illustrates a rapid decrease of the ratios with increasing base width presurgery. 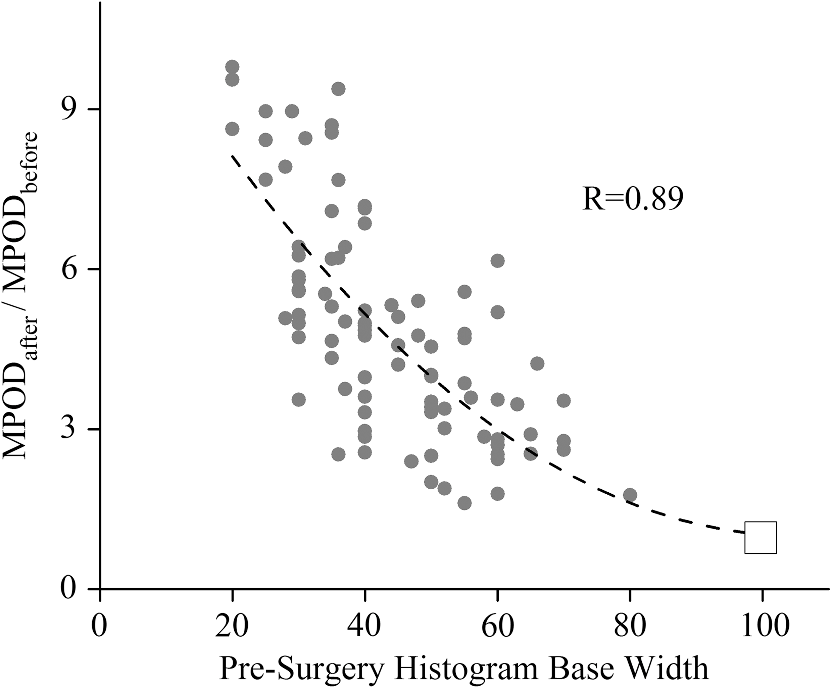 For comparison purposes, we also evaluated the AFI images of 20 nominally healthy subjects for pixel intensity histogram base width values. They ranged from to 100, showing that not all subject eyes had optimum transmissions and that, on average, their base widths were smaller than those for AFI images obtained from cataract patients postsurgery. This is consistent with a scenario where healthy, cataract-free, but aging eyes still have a higher degree of scattering than eyes with lens implants or that mild cataracts were developing in some of the measured eyes. Uncorrected MPOD levels in the measured healthy subjects ranged from 0.20 to 0.65. The plot in Fig. 9 provides a basis for the detection of cataracts in AFI imaging based MP screening of large populations. If the pixel intensity histogram of a particular subject eye has a base width that is too small, the subject could be alerted to the likely presence of cataracts in the measured eye. Also, correction factors can be derived to estimate the actual MP content in the presence of cataracts. These correction factors are listed in Table 1 for four regions of the histogram base width. Each region has a correction factor derived from the parabolic fit, and for each correction factor, a percentage chance can be derived based on the scatter of the data points around the factor. The intraclass correlation coefficient for the four groups of data is 0.3, as calculated with IBM statistics software (SPSS Version 22). Table 1Correction factors to nominal macular pigment (MP) levels derived from autofluorescence imaging images.
As an example, for images of subject eyes with a histogram base width of 50, the nominal MP levels would have to be multiplied with a factor of at a 65% confidence level. Preoperative MP measurements could be adjusted in this way to yield the likely actual MP content of the retina that would probably be observed if the eye is reimaged after cataract surgery. It is interesting to compare AFI image degradation levels, quantified with objective parameters, such as the corresponding histogram pixel intensity width, with the severity of cataracts assessed by subjective visual expert inspection. The latter uses an LOCS to assign scores for the degree of incident cortical, nuclear, and posterior subcapsular opacities, as indicated by a set of three respective numbers. Referring to Fig. 10, nine AFI images are shown along with their associated lens opacity scores. More specifically, AFI images are shown for three groups of subject eyes, with each group having identical LOCS (III) scores. Clearly, the AFI images in each group reveal drastic differences in image quality between subject eyes. For example, in the set with identical LOCS (III) scores of 3-3-2, the AFI image of one subject eye is relatively clear, while the AFI image of another is barely visible, and the AFI image of a third subject eye reveals strong scattering, but with key landmark features still recognizable. These results suggest that the AFI imaging method may be suitable as an objective detector for lens opacities, which exceeds the subjective scoring of lens opacities in accuracy. It may be interesting to explore the merits of more refined lens opacity scoring in this regard, such as the grading of nuclear opacities on higher decimalized point scales in epidemiological study protocols.20 3.ConclusionWe investigated the impact of ocular media opacities on the accuracy of AFI-based MP measurements. For this purpose, a clinical trial was carried out that involved a large number of patients, 59 females and 34 males, all diagnosed with significant lens opacities before cataract surgery, i.e., before surgical insertion of an intraocular prosthetic lens. Using a modified retinal camera platform, lipofuscin fluorescence images (AFI images) were recorded for each patient before and after surgery. Comparing the fluorescence intensities in the macular and peripheral retinal regions, the OD level in the peak of the MP distribution in each image was derived as a quantitative measure. The clinical results show that cataracts can severely degrade the obtainable AFI images via combined scattering and absorption of the blue excitation light used in the methodology. This causes a loss of contrast between lipofuscin fluorescence intensities in macular and peripheral retinal regions and, as a direct consequence, results in a nominal MP optical density level that is artifactually reduced. The cataract-induced image degradation can be quantified with parameters describing the pixel intensity histogram associated with each degraded image, specifically the base width of the histogram. This allows one to establish average correction factors for nominal MP levels measured before surgery. In other words, it is possible, using image analysis, to determine the presence or absence of ocular media opacities and, if present, predict certain ranges of corrected MP levels. As examples, the corrected MP level range is accurate 55% of the time for the highest correction factors (5 to 8), and it is accurate 80% of the time for relatively low correction factors (2 to 3). Subjective LOCS III scores of cataracts are found to be only a weak predictor for the degradation of AFI images. The described image analysis methods hold promise for accurate measurements of MP levels in the presence of ocular media opacities, including cataracts, and facilitate the screening of large populations for MP levels and tracking of MP changes with dietary supplementations. AcknowledgmentsWe acknowledge support from Image Technologies Inc., Salt Lake City, Utah, and the loan of instrumentation from Nidek Co. Ltd., Gamagori, Japan. ReferencesD. M. Snodderlyet al.,
“The macular pigment. I. Absorbance spectra, localization, and discrimination from other yellow pigments in primate retinas,”
Invest. Ophthalmol. Visual Sci., 25
(6), 660
–673
(1984). IOVSDA 0146-0404 Google Scholar
D. M. SnodderlyJ. D. AuranF. C. Delori,
“The macular pigment. II. Spatial distribution in primate retinas,”
Invest. Ophthalmol. Visual Sci., 25
(6), 674
–685
(1984). IOVSDA 0146-0404 Google Scholar
J. P. SanGiovanniM. Neuringer,
“The putative role of lutein and zeaxanthin as protective agents against age-related macular degeneration: promise of molecular genetics for guiding mechanistic and translational research in the field,”
Am. J. Clin. Nutr., 96
(5), 1223S
–1233S
(2012). http://dx.doi.org/10.3945/ajcn.112.038240 AJCNAC 0002-9165 Google Scholar
L. Maet al.,
“Lutein and zeaxanthin intake and the risk of age-related macular degeneration: a systematic review and meta-analysis,”
Br. J. Nutr., 107
(3), 350
–359
(2012). http://dx.doi.org/10.1017/S0007114511004260 BSJSE4 1057-6606 Google Scholar
E. Loaneet al.,
“Transport and retinal capture of lutein and zeaxanthin with reference to age-related macular degeneration,”
Surv. Ophthalmol., 53
(1), 68
–81
(2008). http://dx.doi.org/10.1016/j.survophthal.2007.10.008 SUOPAD 0039-6257 Google Scholar
J. M. Stringhamet al.,
“Macular pigment and visual performance in glare: benefits for photostress recovery, disability glare, and visual discomfort,”
Invest. Ophthalmol. Visual Sci., 52
(10), 7406
–7415
(2011). http://dx.doi.org/10.1167/iovs.10-6699 IOVSDA 0146-0404 Google Scholar
R. A. BoneJ. T. Landrum,
“Heterochromatic flicker photometry,”
Arch. Biochem. Biophys., 430
(2), 137
–142
(2004). http://dx.doi.org/10.1016/j.abb.2004.04.003 ABBIA4 0003-9861 Google Scholar
W. Gellermannet al.,
“In vivo resonant Raman measurement of macular carotenoid pigments in the young and the aging human retina,”
J. Opt. Soc. Am., 19
(6), 1172
–1186
(2002). http://dx.doi.org/10.1364/JOSAA.19.001172 JOSAAH 0030-3941 Google Scholar
M. Sharifzadehet al.,
“Resonance Raman imaging of macular pigment distributions in the human retina,”
J. Opt. Soc. Am. A, 25
(4), 947
–957
(2008). http://dx.doi.org/10.1364/JOSAA.25.000947 JOAOD6 0740-3232 Google Scholar
F. C. Delori,
“Autofluorescence method to measure macular pigment optical densities fluorometry and autofluorescence imaging,”
Arch. Biochem. Biophys., 430
(2), 156
–162
(2004). http://dx.doi.org/10.1016/j.abb.2004.05.016 ABBIA4 0003-9861 Google Scholar
M. SharifzadehP. S. BernsteinW. Gellermann,
“Nonmydriatic fluorescence-based quantitative imaging of human macular pigment distributions,”
J. Opt. Soc. Am. A, 23
(10), 2373
–2387
(2006). http://dx.doi.org/10.1364/JOSAA.23.002373 JOAOD6 0740-3232 Google Scholar
F. C. DeloriK. P. Pflibsen,
“Spectral reflection of the human ocular fundus,”
Appl. Opt., 28
(6), 1061
–1077
(1989). http://dx.doi.org/10.1364/AO.28.001061 APOPAI 0003-6935 Google Scholar
T. T. BerendschotD. van Norren,
“Objective determination of the macular pigment optical density using fundus reflection spectroscopy,”
Arch. Biochem. Biophys., 430
(2), 149
–155
(2004). http://dx.doi.org/10.1016/j.abb.2004.04.029 ABBIA4 0003-9861 Google Scholar
M. HammerD. Schweitzer,
“Quantitative reflection spectroscopy at the human ocular fundus,”
Phys. Med. Biol., 47
(2), 179
–191
(2002). http://dx.doi.org/10.1088/0031-9155/47/2/301 PHMBA7 0031-9155 Google Scholar
C. Bellmannet al.,
“Fundus autofluorescence imaging compared with different confocal scanning laser ophthalmoscopes,”
Br. J. Ophthalmol., 87
(11), 1381
–1386
(2003). http://dx.doi.org/10.1136/bjo.87.11.1381 BJOPAL 0007-1161 Google Scholar
D. Schweitzeret al.,
“Simple and objective method for routine detection of the macular pigment xanthophyll,”
J. Biomed. Opt., 15
(6), 061714
(2010). http://dx.doi.org/10.1117/1.3526358 JBOPFO 1083-3668 Google Scholar
Y. Sasamotoet al.,
“Effect of cataract in evaluation of macular pigment optical density by autofluorescence spectrometry,”
Invest. Ophthalmol. Visual Sci., 52
(2), 927
–932
(2011). http://dx.doi.org/10.1167/iovs.10-5664 IOVSDA 0146-0404 Google Scholar
L. T. Chylack Jr.et al.,
“The Lens Opacities Classification System III,”
Arch. Ophthalmol., 111
(6), 831
–836
(1993). http://dx.doi.org/10.1001/archopht.1993.01090060119035 AROPAW 0003-9950 Google Scholar
J. van de KraatsD. van Norren,
“Optical density of the aging human ocular media in the visible and the UV,”
J. Opt. Soc. Am. A, 24
(7), 1842
–1857
(2007). http://dx.doi.org/10.1364/JOSAA.24.001842 JOAOD6 0740-3232 Google Scholar
J. A. Mareset al.,
“Healthy diets and the subsequent prevalence of nuclear cataract in women,”
Arch. Ophthalmol., 128
(6), 738
–749
(2010). http://dx.doi.org/10.1001/archophthalmol.2010.84 AROPAW 0003-9950 Google Scholar
|


