
|
|
1.IntroductionWith the increasing prevalence of presbyopia and myopia worldwide, research into understanding the accommodation mechanism and its association with presbyopia and myopia have attracted great interest among ophthalmic research communities.1–5 Accommodation is defined as a dioptric change in the power of the eye to focus a near object onto the retina. When the eye accommodates, the ocular dimensions undergo a series of changes:6–15 an increase in lens thickness, a reduction of the lens’s equatorial diameter, a forward movement of the lens’s anterior pole, a backward movement of the lens’s posterior pole, and a contraction of the ciliary body with a reduction in the ciliary ring diameter. These changes lead to a concomitant decrease of the anterior chamber depth (measured from the cornea to the anterior lens surface) and an increase in the anterior segment length (measured from the cornea to the posterior lens surface). In addition to the dimensional changes in the anterior segment, changes in the posterior segment of the eye during accommodation also have been widely investigated,16–23 because retinal stretching or distortion with accommodation may be associated with accommodative micropsia24 and other accommodation-dependent perceptual phenomena. Moses and Adler16 photographed the leading edge of the retina (i.e., the ora serrata, which combines the choroid and ciliary body) using the transillumination method and demonstrated that there was stretching of the peripheral retina during substantial accommodation (10 D) with a 0.5-mm anterior movement of the ora serrata in young human subjects. Blank and Enoch17 found significant distortion in monocular space perception on the horizontal meridian induced by marked accommodation with a bisection technique, which suggested spatial asymmetrical retinal distortion. Hollins18 determined that the central region of the human retina stretched by during marked accommodation (9 D) with a Maxwellian view apparatus. Blank et al.20 found a shift in the peak of the foveal Stiles-Crawford effect with 9 D of accommodation, which also may imply central retinal distortion during accommodation. Recently, Croft et al.23 illustrated that the accommodative forward movement of retinal and choroidal tissue is located at least 4 to 7 mm posterior to the ora serrata in the rhesus monkey eye with ultrasound biomicroscopy imaging, which demonstrated that tissue stretching was not confined to the region of the ora serrata. However, most reported results16–22 supporting retinal stretching or distortion with accommodation were based on psychophysics and visual optics methods. Direct measurements of morphological changes of the human retina during accommodation using high-resolution three-dimensional (3-D) imaging techniques, such as optical coherence tomography (OCT), have not been reported before. This type of measurement is able to provide direct evidence and quantification of retinal stretching or distortion. In previous studies,12,13 we investigated dimensional changes of the anterior segment in different accommodated states using a dual-channel spectral domain OCT (SD-OCT) system, the results of which were in agreement with those of other groups.7,8,15 In this paper, we report on measurements of retinal thickness (RT) of the macular area using the same OCT system to investigate accommodation-induced morphological changes of the central retina. This study takes advantage of the imaging system’s capability of simultaneously measuring ocular dimensions, including RT and axial length.25 With the knowledge of axial length, correction for optical magnification of the eye can be performed to ensure a more objective comparison of RT between unaccommodated and accommodated states. 2.Methods2.1.Experimental System and PerformanceThe dual-channel SD-OCT system used in this study consists of two fiber-based Michelson interferometers (Fig. 1). The collimated light beams in the sample arm were combined by a beam-splitter cube. The combined probing beams were coaxial. By placing a lens after one of the collimated light beams, the divergence of the two probing beams was turned to make them focus at different depths in the eye. The light beam responsible for imaging the cornea [OCT-1, consisting of super luminescent diode 1 (SLD 1) light source, the optics of channel 1, and spectrometer 1] was focused at the anterior segment, while the other (OCT-2, consisting of SLD 2 light source, the optics of channel 2, and spectrometer 2) was focused at the retina. Two SLD light sources with the same full width at half maximum (FWHM) of 45 nm (IPSDD0807, Inphenix, Livermore, California) were used for two OCT subsystems. With the same center wavelength of 840 nm, the calibrated axial resolutions of OCT-1 and OCT-2 were 10 and in air, respectively. The linear CCD cameras (Aviiva-SM2-CL-2014, 2048 pixels with 14 micron pixel size operating in 12-bit mode, e2V, Chelmsford, Essex, England) in the two spectrometers were synchronized and operating at a rate of 24,000 A-lines per second. The calibrated imaging depths in air of OCT-1 and OCT-2 were 7.28 and 5.16 mm, respectively. The measured difference in optical path length between the two OCT images was 26.048 mm in air. With the knowledge of the distance between the images, a composite cross-sectional image, including the cornea and retina, can be constructed to calculate the ocular axial length [AL, the distance from the anterior corneal surface to the retinal pigment epithelium (RPE), Fig. 2(a)], which is essential for the correction of optical magnification. The two OCT subsystems had a similar sensitivity of 98 dB and a 42 dB sensitivity drop at the maximal imaging depth. The lateral resolutions of OCT-1 and OCT-2 were 12 and , respectively. The scan widths of OCT-1 and OCT-2 were 1 and 6 mm, respectively. The total exposure power in front of the corneal surface was 1.96 mW, which was safe for long-term exposure to the eye according to ANSI Z136.1. A Badal system26 was integrated to compensate for ocular refractive error and induce accommodation in each eye. Other technical details of the imaging system can be found in our previous publication.25 Fig. 1Schematic of the dual-channel spectral domain optical coherence tomography (SD-OCT) system. The inset is an illustration of the scanning path with a dual-focus configuration. L1 to L11, lenses; M1 and M2, mirrors; CCD 1 and CCD 2, charge-coupled devices.  Fig. 2Images acquired with the dual-channel SD-OCT system. (a) The constructed OCT image of the cornea and retina; image size: . (b) and (d) The constructed fundus images based on the OCT datasets at unaccommodated and maximally accommodated states, respectively; image size: with pixels. (c) and (e). The OCT cross-sectional images with the foveal center chosen from the location marked as a white line in (b) and (d); image size: . White bar: 0.5 mm.  2.2.SubjectsTwenty-three subjects (right eye, mean spherical error: ; astigmatism ; 10 men and 13 women) aged from 22 to 30 years (mean age: years) were recruited from among students of Shanghai Jiao Tong University for this study. The maximum amplitude of accommodation of each subject was measured with the push-up method (mean maximum amplitude of accommodation: ). All subjects had no abnormal ophthalmological findings and no history of ocular disease, surgery, or trauma. The study was performed in accordance with the tenets of the Declaration of Helsinki. The subjects understood the nature and possible consequences of this research and informed consent was obtained from all volunteers in this study. 2.3.Imaging ProcedureAll imaging procedures were performed by the same experienced operator. All eyes were scanned with a raster pattern in unaccommodated and maximally accommodated states successively. The crosshair fixation target was uniformly illuminated by a white light-emitting diode lamp. The subjects were instructed to keep the target in sharp focus throughout the imaging procedures. During the experiment, the subject was asked to sit in front of a modified slit-lamp and fixate at the crosshair target through a Badal system. The other eye was covered throughout the experiment to ensure reliable fixation of the test eye. The fixation target was first adjusted to the optical far point of the eye to compensate for its refractive error and maintain an unaccommodated state as much as possible. The central scanning line was adjusted to cover the foveal center. The OCT images were acquired when the cornea and retina were clearly visualized and a specular reflex appeared in the corneal image. Then, the operator moved the target to induce accommodation until the subject reported blurring of the target. At this point, subjective maximum accommodation was induced. Two repeated measurements were performed in unaccommodated and maximally accommodated states during each test session. Two independent test sessions were performed for each eye with a 15-min break to test the reproducibility of the measurements. 2.4.Data AnalysisWe developed a computer program to segment the layers of the internal limiting membrane (ILM) and RPE automatically using the acquired 3-D volumetric data covering a macular area. The segmented ILM and RPE boundaries from each cross-sectional image in the volumetric OCT data were manually examined and corrected to ensure accuracy by a professional operator who was blinded to the subjects’ information. The RT was determined by calculating the distance between the ILM and RPE boundaries. The refractive index used in the RT calculation was 1.380. The retinal volume (RV) is the sum of the pixel volume in the corresponding area. The area for RT analysis was selected to cover 2.00 mm of the areas nasal, temporal, superior, and inferior from the foveal center [the area marked with a red square in Figs. 2(b) and 2(d)]. Several factors may influence the comparison, e.g., eye movements during OCT scanning and/or accommodation, nodal point shift during accommodation, eye AL, and so on. To ensure that the calculations of the RT change were not affected by these factors, registration of the tested area together with a correction for optical magnification between unaccommodated and maximally accommodated states was performed. First, the OCT cross-sectional image that contained the deepest foveal pit (defined as the foveal center) was manually identified from the corresponding 128 cross-sectional images obtained from the unaccommodated and accommodated states, respectively [Figs. 2(c) and 2(e)]. Then, the position of the A-scan that corresponded to the smallest RT could be identified. Hence, the exact position of the foveal center can be obtained from each OCT volumetric dataset. Second, in consideration of the optical magnification caused by accommodation and various ALs, the actual scan distance at the retina and the corresponding scan resolution of each eye needed to be corrected individually. A schematic illustrating the correction is shown in Fig. 3. The actual distance being scanned at the retina is equal to the preset distance (6 mm) only for a schematic eye (AL: 23.9 mm; nodal position in an unaccommodated state: 7.4 mm) with no refractive error. The actual scan distance at the retina of each eye can be calculated based on geometric optics with a preset scan length () in a schematic eye. where , , , , , and are the actual scan distance, the corresponding AL, and the nodal positions in unaccommodated and accommodated states, respectively. For example, under the same preset scan length, the actual scan length in an eye with a longer AL is larger than that in the schematic eye in either unaccommodated () or accommodated states (). In addition, the actual scan length in an eye in an accommodated state is larger than that in an unaccommodated state (, ). Then, the corresponding actual scan resolution of each eye can be obtained according to the respective corrected scan length (i.e., the horizontal or vertical scan length/its containing A-scan number). With individually corrected scan resolutions, the number of A-scans contained in horizontal and vertical directions of 4 mm can be accurately calculated.Fig. 3Schematic of scan length correction based on a Gullstrand No. 2 schematic eye with no refractive error [unaccommodated and accommodated (approximately 8 D)]. A0, A1, A3, and A5 are the actual scan lengths in the unaccommodated schematic eye, unaccommodated eye with a longer AL, accommodated schematic eye, and accommodated eye with a longer AL, respectively. A2, A4, and A6 are the corrected scan lengths, which are equal to A0 (i.e., the preset scan length). The number of A-scans that intersect A2, A4, and A6 is fewer than those that intersect A1, A3, and A5, respectively. , objective node; , image node; AL, axial length.  Finally, according to the A-scan number corresponding to the position of the foveal center, the region of interest (i.e., a macular area centered at the foveal center) can be determined. A spline interpolation method was applied to guarantee the same transverse resolution of the tested area. By applying the registration process to the area of interest, the influence of eye position displacement on RT comparisons between unaccommodated and accommodated states could be minimized. 2.5.Statistical AnalysisSPSS v. 16.0 (SPSS Inc., Chicago, Illinois, USA) was used for the statistical analysis. The intraclass correlation coefficient (ICC) with a one-way random-effect model was used to evaluate measurement repeatability. A paired test was applied to analyze the statistical significance of the RT difference between unaccommodated and accommodated status. A one-way analysis of variance (ANOVA) was used to analyze quadrant differences in RV in the same state (unaccommodated or accommodated) in a macular area, as well as accommodation-induced RV changes. was considered statistically significant. 3.ResultsThe right eyes of all subjects were imaged at unaccommodated and maximally accommodated states in the study. The RT and AL measured with the dual-channel SD-OCT system showed good reproducibility between the two independent test sessions in the same state (, , one-way random ICC). The measured ALs ranged from 23.21 to 27.65 mm (mean AL: ) and from 23.22 to 27.66 mm (mean AL: ) at unaccommodated and maximally accommodated states, respectively. The RT of the horizontal cross-section passing through the foveal center (lateral length: 4 mm, centered at the fovea) was calculated based on the corrected cross-sectional OCT image. The result showed a small but statistically significant decrease in RT in the maximally accommodated state compared to that in the unaccommodated state (paired test, ). The corresponding average RT at the unaccommodated and maximally accommodated states and their difference (mean and standard deviation) are shown in Fig. 4 (mean of all subjects). Fig. 4(a) The mean retinal thickness (RT) averaged from corrected OCT cross-sectional images containing the fovea center of all subjects () at unaccommodated and maximally accommodated states and their differences (, maximum accommodated minus unaccommodated). (b) The mean and standard values of the change of RT (). 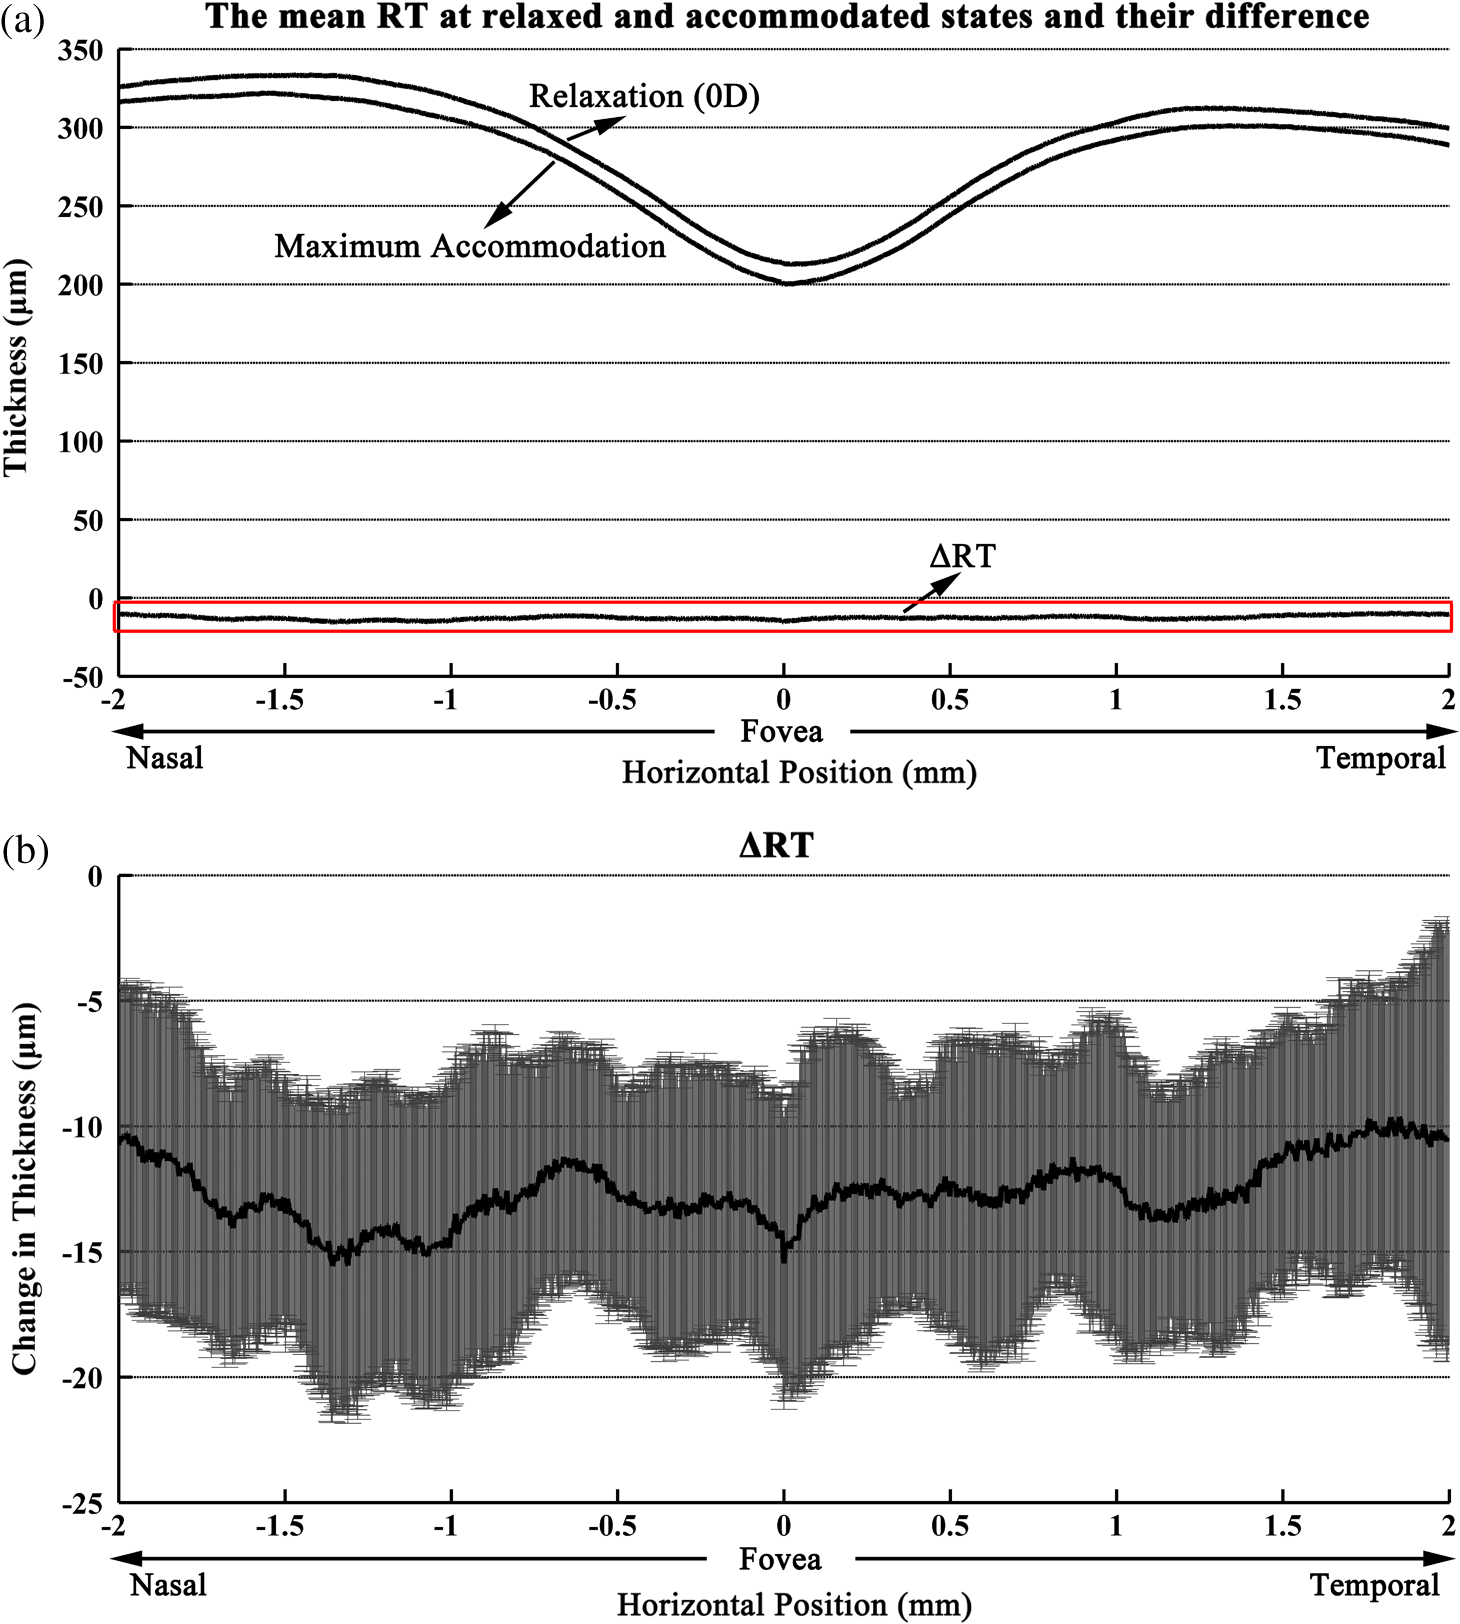 The RT of the macular area centered at the fovea was also calculated based on corrected OCT volumetric data. The maps of average RT at unaccommodated and maximally accommodated states and their differences are shown in Fig. 5 (mean of all subjects). There is an obvious RT decrease in the macular area with maximum accommodation [Fig. 5(c)]. In addition, the mean RV of all subjects in unaccommodated and accommodated states and their differences in the superior nasal, inferior nasal, superior temporal, and inferior temporal quadrants of the macular area are shown in Table 1. There was no significant difference in the mean RV among the four quadrants of the macular area (, one-way ANOVA). A significant decrease in the RV of the macular area around the fovea occurred with maximum accommodation (, paired test). The variation in RV induced by maximum accommodation was not significantly different among the four quadrants (, one-way ANOVA). Fig. 5Maps of mean RT in unaccommodated and maximally accommodated states averaged from corrected volumetric data of all subjects and their differences (). (a) and (b) The retinal thickness of the area around the fovea at unaccommodated and maximally accommodated states. (c) The difference between (a) and (b) (maximum accommodated minus unaccommodated).  Table 1Retinal volume of the four quadrants around the fovea (4 mm×4 mm) in unaccommodated and maximally accommodated states.
4.DiscussionUsing a dual-channel SD-OCT system manufactured in-house, we demonstrated that RT in the macular area surrounding the fovea underwent a small but significant change during maximum accommodation in a population of young adults. The retinal thinning observed during maximum accommodation may imply retinal stretching or distortion from another perspective, which is in line with previous reports.16–23 However, our results showed no significant difference in the RT change induced by maximum accommodation among the four quadrants of the macular area (, one-way ANOVA), as well as between the nasal and temporal area (, one-way ANOVA), which was inconsistent with that proposed by Blank and Enoch.17 The asymmetry of retinal distortion on the horizontal meridian during marked accommodation17 may be introduced because of the location of the optic nerve head. Hence, this inconsistency may result from the different areas tested in the studies (the tested area in our study was a macular area centered at the fovea, while the tested area in the study by Blank and Enoch17 included the whole retina on the horizontal meridian). Taking optical magnification of the eye into account, the corrections for AL and refractive power were applied to compensate for the difference in transverse image resolution before averaging and comparing the RT values. In this study, we used the nodal point position of the schematic eye instead of the individual nodal point position for the correction procedure, which may have caused a small calculation error in the retinal change. In order to assess this calculation error, we also calculated the change in RT without any correction with refractive power and AL. The results also demonstrated quadrant-independent retinal thinning with an RV decrease of in a macular area (the mean RV change was and the mean RT change was ) during maximum accommodation, which is similar, but smaller than those with correction (with correction, the decrease in RV was , i.e., the mean RV change was and the mean RT change was ). Hence, the possible calculation error caused by the small difference between the individual and schematic eye’s nodal point positions is unlikely to influence the conclusions in this work. The optical magnification associated with the change in refractive power of the eye influences not only the scan resolution of the tested area, but also the RT estimation, although the optical path length measured through the retina (ILM to RPE) should not be affected by an alteration in lens thickness induced by accommodation. To investigate the potential influences on intraocular distances caused by magnification, we performed additional measurements with a model eye. SD-OCT measurements on the ocular distances of a model eye with or without a lens placed i n front of it showed no difference, which suggested that the RT measurement was unlikely to be influenced by the magnification associated with 8 D of accommodation. The hypothesis for retinal thinning during accommodation is likely to be explained by the forward movement of the ora serrata caused by an accommodation-induced ciliary muscle contraction. However, the relationship and mechanism between RT variation and accommodation is complicated and still unknown. For example, whether retinal thinning is a passive response induced by accommodation or an active motion to enhance or even induce accommodation needs to be investigated further. Because of limitations in the imaging system, we did not investigate changes in the choroid and sclera induced by accommodation. It will be further studied with our newly developing experimental system with a 1050-nm light source in the future. In addition, the AL used for the correction of optical magnification was measured by a dual-channel SD-OCT with an average refractive index of 1.353, which may have slightly affected the accuracy of the true AL. Additionally, the maximally accommodated amplitude of the subjects varied by a small amplitude. Both factors will influence the correction for optical magnification and then affect the precision of the retinal change calculation between unaccommodated and accommodated states. Nevertheless, as mentioned above, the difference between accommodation-induced retinal changes with and without correction was only . Therefore, the calculation error was too small to influence retinal change consequences during maximum accommodation. Besides, as mentioned in Sec. 2.4, a registration procedure was performed to minimize the potential influence on the retinal change in the tested area between unaccommodated and accommodated states caused by the changes in fixation or by cyclo-rotational changes in eye position or by any tilts in the OCT scans. In conclusion, we demonstrate that the macular thickness between the ILM and RPE surrounding the fovea had a slight but significant decrease during maximum accommodation, and the change was not quadrant-dependent, which will provide new evidence for retinal stretching or distortion. This finding may be explained by an accommodation-induced ciliary muscle contraction, but the intrinsic mechanism is complicated and needs to be investigated further. AcknowledgmentsThis research was supported by the National Basic Research Program of China (Nos. 2011CB707504 and 2010CB933903) and by the National Natural Science Foundation of China (81171377 and 61307015). ReferencesJ. F. KoretzC. A. CookP. L. Kaufman,
“Accommodation and presbyopia in the human eye. Changes in the anterior segment and crystalline lens with focus,”
Invest. Ophthalmol. Vis. Sci., 38
(3), 569
–578
(1997). IOVSDA 0146-0404 Google Scholar
D. A. Atchison,
“Accommodation and presbyopia,”
Ophthalmic Physiol. Opt., 15
(4), 255
–272
(1995). http://dx.doi.org/10.1016/0275-5408(95)00020-E OPOPD5 0275-5408 Google Scholar
A. GlasserP. L. Kaufman,
“The mechanism of accommodation in primates,”
Ophthalmology, 106
(5), 863
–872
(1999). http://dx.doi.org/10.1016/S0161-6420(99)00502-3 OPANEW 0743-751X Google Scholar
H. M. CulhaneB. Winn,
“Dynamic accommodation and myopia,”
Invest. Ophthalmol. Vis. Sci., 40
(9), 1968
–1974
(1999). IOVSDA 0146-0404 Google Scholar
M. Rosenfield,
“Accommodation and myopia,”
Myopia and Nearwork, 91
–116 Butterworth-Heinemann, Oxford
(1998). Google Scholar
H. Helmholtz,
“Ueber die accommodation des auges,”
Graefes. Arch. Clin. Exp. Ophthalmol., 2
(2), 1
–74
(1855). http://dx.doi.org/10.1007/BF02720789 GACODL 0721-832X Google Scholar
M. DubbelmanG. L. Van der HeijdeH. A. Weeber,
“Change in shape of the aging human crystalline lens with accommodation,”
Vis. Res., 45
(1), 117
–132
(2005). http://dx.doi.org/10.1016/j.visres.2004.07.032 VISRAM 0042-6989 Google Scholar
G. Baikoffet al.,
“Static and dynamic analysis of the anterior segment with optical coherence tomography,”
J. Cataract Refract. Surg., 30
(9), 1843
–1850
(2004). http://dx.doi.org/10.1016/j.jcrs.2004.05.024 JCSUEV 0886-3350 Google Scholar
K. RichdaleM. A. BullimoreK. Zadnik,
“Lens thickness with age and accommodation by optical coherence tomography,”
Ophthalmic Physiol. Opt., 28
(5), 441
–447
(2008). http://dx.doi.org/10.1111/opo.2008.28.issue-5 OPOPD5 0275-5408 Google Scholar
C. Duet al.,
“Anterior segment biometry during accommodation imaged with ultralong scan depth optical coherence tomography,”
Ophthalmology, 119
(12), 2479
–2485
(2012). http://dx.doi.org/10.1016/j.ophtha.2012.06.041 OPANEW 0743-751X Google Scholar
M. Ruggeriet al.,
“Imaging and full-length biometry of the eye during accommodation using spectral domain OCT with an optical switch,”
Biomed. Opt. Express., 3
(7), 1506
–1520
(2012). http://dx.doi.org/10.1364/BOE.3.001506 BOEICL 2156-7085 Google Scholar
C. ZhouJ. WangS. Jiao,
“Dual channel dual focus optical coherence tomography for imaging accommodation of the eye,”
Opt. Express, 17
(11), 8947
–8955
(2009). http://dx.doi.org/10.1364/OE.17.008947 OPEXFF 1094-4087 Google Scholar
Y. Sunet al.,
“Noninvasive imaging and measurement of accommodation using dual-channel SD-OCT,”
Curr. Eye. Res., 39
(6), 611
–619
(2014). http://dx.doi.org/10.3109/02713683.2013.860991 CEYRDM 0271-3683 Google Scholar
Y. Shaoet al.,
“Simultaneous real-time imaging of the ocular anterior segment including the ciliary muscle during accommodation,”
Biomed. Opt. Express., 4
(3), 466
–480
(2013). http://dx.doi.org/10.1364/BOE.4.000466 BOEICL 2156-7085 Google Scholar
A. Tsorbatzoglouet al.,
“Anterior segment changes with age and during accommodation measured with partial coherence interferometry,”
J. Cataract Refract. Surg., 33
(9), 1597
–1601
(2007). http://dx.doi.org/10.1016/j.jcrs.2007.05.021 JCSUEV 0886-3350 Google Scholar
R. A. MosesF. H. Adler, Adler’s Physiology of the Eye: Clinical Application, 5th ed.Mosby, St. Louis, MO
(1975). Google Scholar
K. BlankJ. M. Enoch,
“Monocular spatial distortions induced by marked accommodation,”
Science, 182
(4110), 393
–395
(1973). http://dx.doi.org/10.1126/science.182.4110.393 SCIEAS 0036-8075 Google Scholar
M. Hollins,
“Does the central human retina stretch during accommodation?,”
Nature, 251
(5477), 729
–730
(1974). http://dx.doi.org/10.1038/251729a0 NATUAS 0028-0836 Google Scholar
J. M. Enoch,
“Marked accommodation, retinal stretch, monocular space perception and retinal receptor orientation,”
Am. J. Optom. Physiol. Opt., 52
(6), 376
–392
(1975). http://dx.doi.org/10.1097/00006324-197506000-00002 AOPOCF 0093-7002 Google Scholar
K. BlankR. R. ProvineJ. M. Enoch,
“Shift in the peak of the photopic Stiles-Crawford function with marked accommodation,”
Vis. Res., 15
(4), 499
–507
(1975). http://dx.doi.org/10.1016/0042-6989(75)90027-9 VISRAM 0042-6989 Google Scholar
J. M. Enoch,
“Effect of substantial accommodation on total retinal area,”
J. Opt. Soc. Am., 63
(7), 899
(1973). http://dx.doi.org/10.1364/JOSA.63.000899 JOSAAH 0030-3941 Google Scholar
N. Singhet al.,
“Influences of accommodation and myopia on the foveal Stiles–Crawford effect,”
J. Mod. Opt., 56
(20), 2217
–2230
(2009). http://dx.doi.org/10.1080/09500340902721915 JMOPEW 0950-0340 Google Scholar
M. A. Croftet al.,
“Accommodative movements of the vitreous membrane, choroid, and sclera in young and presbyopic human and nonhuman primate eyes,”
Invest. Ophthalmol. Vis. Sci., 54
(7), 5049
–5058
(2013). http://dx.doi.org/10.1167/iovs.12-10847 IOVSDA 0146-0404 Google Scholar
E. G. HeinemannE. TulvingJ. Nachmias,
“The effect of oculomotor adjustments on apparent size,”
Am. J. Psychol., 72
(1), 32
–45
(1959). http://dx.doi.org/10.2307/1420209 AJPCAA 0002-9556 Google Scholar
C. Daiet al.,
“Optical coherence tomography for whole eye segment imaging,”
Opt. Express, 20
(6), 6109
–6115
(2012). http://dx.doi.org/10.1364/OE.20.006109 OPEXFF 1094-4087 Google Scholar
D. A. Atchisonet al.,
“Useful variations of the Badal optometer,”
Optom. Vis. Sci., 72
(4), 279
–284
(1995). http://dx.doi.org/10.1097/00006324-199504000-00010 OVSCET 1040-5488 Google Scholar
BiographyShanhui Fan is a PhD candidate in the Department of Biomedical Engineering, Shanghai Jiao Tong University. She received her BS degree from the Department of Medical Information Engineering, Sichuan University, in 2010. Her research interests are in extended-depth optical coherence tomography and its applications in accommodation and whole-eye imaging. Yong Sun is a PhD candidate in the Department of Biomedical Engineering, Shanghai Jiao Tong University. He received his MD degree from Xinjiang Medical University. His research interests are in ophthalmology, including presbyopia, myopia, and its relationship with accommodation. Cuixia Dai is an associate professor at Shanghai Institute of Technology. She received her PhD degree in optical engineering from Shanghai Institute of Optics and Fine Mechanics, Chinese Academy of Sciences. Her research interests are in ophthalmology, optical coherence tomography, and multimodality imaging. Haihua Zheng is a professor and the director of the ophthalmology department of the Second Affiliated Hospital of Wenzhou Medical University. His interests are in the research of presbyopia and pathogenesis of PVR. He has published several articles on the core journal. Qiushi Ren is the professor and chairman of the Department of Biomedical Engineering at Peking University. He received his PhD in electrical engineering from the Ohio State University. His research focuses on laser medicine and biophotonics, neuromedical engineering, intelligent medical device and equipment, and microelectromechanical system for biomedical applications. Shuliang Jiao is an associate professor at Florida International University. Most recently, he was associate professor at the University of Southern California (USC). Before USC, he was an assistant professor at the University of Miami. He received his PhD in biomedical engineering from Texas A&M University. His research focuses on the development of technologies for imaging the anatomy and function of the eye, including a retinal imaging tool that enables the early diagnosis of diabetic retinopathy. Chuanqing Zhou is an associate professor at Shanghai Jiao Tong University. He obtained his PhD degree in biomedical engineering from Shanghai Jiao Tong University in 2007. He has published more than 50 papers in peer-reviewed journals and 2 book chapters, and holds 4 patents in the fields of ophthalmology and visual prosthesis. His research interests include biophotonics and visual optics. |
||||||||||||||||||||||||||||||||||


