
|
|
1.IntroductionCerebral autoregulation protects the brain by maintaining cerebral perfusion stable against changes in systemic arterial blood pressure (ABP). Disturbed cerebral autoregulation plays a role in the clinical course and outcome of many diseases such as traumatic brain injury, stroke, and stenosis of brain-supplying arteries.1 A noninvasive concept of assessing the individual integrity of autoregulation uses dynamic changes in cerebral blood flow velocity (CBFV) in basal cerebral arteries measured by transcranial Doppler sonography (TCD) and spontaneously occurring or noninvasively induced ABP changes (dynamic autoregulation).2 However, TCD-based measures of autoregulation provide a mixture of the global autoregulatory function within the vascular territory of the insonated basal cerebral artery [e.g., middle cerebral artery (MCA)], thus not yielding information on specific areas with focal dysautoregulation. Overall, it is not known so far whether there are specific areas of impaired autoregulation at all in carotid artery disease. Such information might be, however, important both for the detection of patients with internal carotid artery (ICA) stenosis prone to ischemic infarction and for the pathophysiological understanding of the disease. An established parameter of dynamic autoregulation is the phase shift between CBFV and ABP during spontaneous or respiratory-induced low frequency oscillations of ABP. Thereby, oscillations in CBFV normally lead those of ABP due to the fast and steady effort of the cerebral autoregulatory system to counter-regulate the repetitive falls and rises of cerebral blood flow during oscillating ABP.3,4 Using two-channel near-infrared spectroscopy (NIRS), we have previously shown that such a phase shift can also be observed with a certain intrinsic time lag between CBFV and NIRS signals.5 The theory of phase relations between ABP, TCD, and NIRS is illustrated in Fig. 1. Although there are first reports on the use of magnetic resonance imaging (MRI) for analyzing dynamic autoregulation in healthy adults,6,7 new multichannel NIRS devices now allow for bedside monitoring of cerebral cortical hemodynamics with a reasonable spatial resolution of . Fig. 1(a) Generation of the positive phase shift between arterial blood pressure (ABP) and cerebral blood flow velocity (CBFV) because of early continuous counter-regulatory activity of cerebral arterioles in response to falling (1 and 2) and rising (3) ABP. (b) Physiological situation. Leftward shift of CBFV toward ABP ( phase of ABP-CBFV). The NIRS signal (oxyHb) has a certain time lag (D) to CBFV. The phase between ABP and oxyHb thus is negative (, phase ABP-[oxyHb]). (c) Pathological situation. The positive phase between ABP and CBFV is diminished because of poorer dynamic autoregulation (). Since D is assumed to be unaltered, oxyHb is shifted toward the right side, resulting in a larger negative phase shift between ABP and oxyHb (P2). (d) Exemplary illustration of a multichannel near-infrared spectroscopy (mcNIRS) measurement over the frontal cortex (image shows a patient with simultaneous transcranial Doppler recording). (e) Raw recording of one NIRS channel and the finger plethysmographic ABP signal. 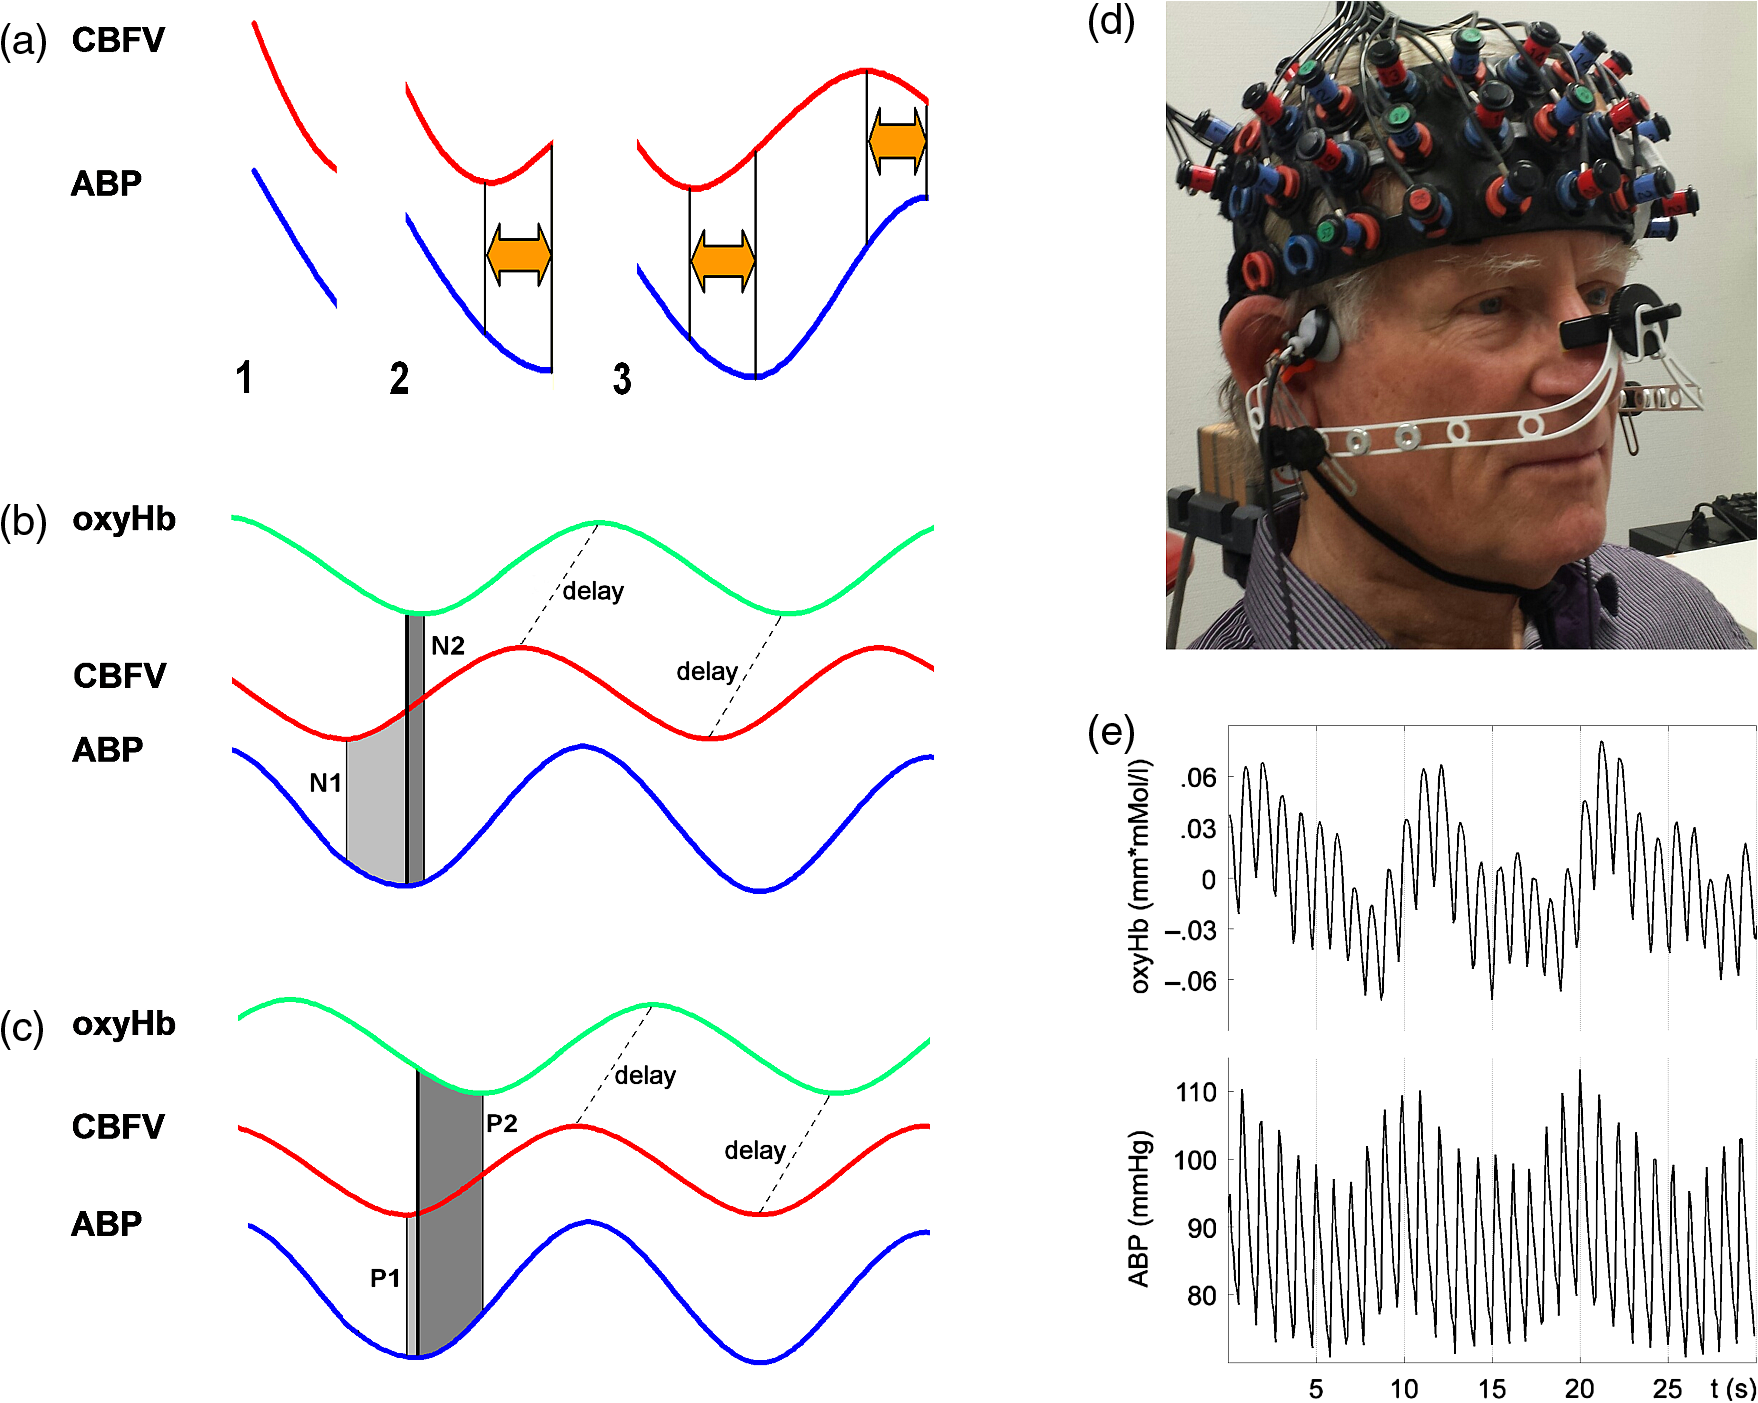 In this study, we explored the potential of 52-channel NIRS to spatially measure impairment of dynamic cerebral autoregulation in patients with severe obstructive carotid artery disease. 2.Patients and MethodsThe study was approved by the Ethics Committee of the University of Freiburg with experimental procedures being in accordance with the ethical standards of the Helsinki declaration of 1975 (and as revised in 1983). Fifteen patients with severe unilateral atherosclerotic carotid artery stenosis or occlusion were prospectively studied. All patients gave written informed consent prior to participation and underwent a careful history review of previous cerebral ischemic events and their medication. The degree of stenosis was determined by extra- and transcranial duplex sonography8; only patients with unilateral high-grade stenosis or occlusion of the ICA were included. The degree of intracranial collateral flow was rated by transcranial and periorbital sonography in all patients according to criteria which have been defined previously.9 In short, we dichotomized individual collateral flow patterns into “good” (only primary collaterals active, i.e., anterior/posterior communicating artery) or “poor” (additional or exclusive activation of secondary collateral flow patterns via ophthalmic artery and/or leptomeningeal flow or functional stenosis of primary pathways9). All patients received cranial MRI to scan for structural brain lesions. In 12 patients, a brain MRI was performed on the same day as the autoregulation measurement. In the remaining three patients, brain MRI had been performed 1 week, 9 weeks, and 5 months prior to the autoregulation measurement. 2.1.Measurement SetupContinuous noninvasive ABP recording was performed via a servo-controlled finger plethysmograph (Finapres© 2300, Ohmeda, Englewood, Colorado) with the subject’s hand positioned at heart level. End-tidal partial pressure was measured in kPa with an infrared capnometer (Normocap©, Datex, Finland) during nasal expiration. NIRS measurements were performed using a 52-channel near-infrared spectrometer with a sampling rate of 10 Hz (ETG 4000©, Hitachi Medical Co., Tokyo, Japan). The basic principle of NIRS is that near-infrared light easily penetrates the skull and brain, but is differentially absorbed by the chromophores oxyhemoglobin ([oxyHb]) and deoxyhemoglobin ([deoxyHb]). Assuming constant scattering, the changes in the different absorption spectra of these chromophores can be converted into changes in their concentrations using the modified Lambert—Beer law.10 The NIRS probes were placed in a standardized manner on the anterior circumference of the brain (aligning the center probes with the sagittal midline, positioning the lower center probe at a distance of 1.5 cm above the nasion). The resulting 52 NIRS channels evenly covered the bilateral frontal cortex (partly extending into superior temporal areas) that is usually supplied by the MCA and anterior cerebral artery (ACA). The measurement setup is illustrated in Fig. 1(d). Each pair of horizontally or vertically adjacent emitting and receiving probes constituted a channel, with each channel located equidistantly between its constituent probes (i.e., 1.5 cm distance to each probe). This resulted in diagonal distances between channels of , whereas the horizontal and vertical distances between the emitting and the receiving probes were 3 cm. In 11 patients, multichannel NIRS measurements were complemented by simultaneous TCD measurements of the bilateral MCA through the temporal bone window using 2 MHz probes (Multi-Dop-X, DWL, Singen, Germany). Due to TCD artefacts, only seven of these patients were eligible for further analysis. All signals were recorded at 1000 Hz. For further analysis, ABP was low-pass filtered (Fourier filter, 5 Hz cutoff frequency) and downsampled to the NIRS sampling frequency of 10 Hz for spectral analyses. The conversion of NIRS raw data into [oxyHb] concentration changes and spatial registration with anatomical MRI data was performed using custom routines developed in-house by Christoph P. Kaller and Björn Schelter (see also below). TCD data were analyzed with custom-written software developed in-house.9 2.2.Autoregulation TestingSubjects were placed in a supine position with 50 deg inclination of the upper body. After a 15-min period of rest, regular breathing at a rate of (i.e., 0.1 Hz) was performed over 200 s. Patients were carefully instructed to breathe with “low” tidal volumes in order to avoid hypocapnia. Figure 1 shows an illustrative raw data recording. 2.3.Data AnalysisTransfer function analysis was used to determine the phase shift between oscillations of ABP and NIRS parameters at the maximum coherence in the frequency band between 0.095 and 0.105 Hz.11,12 Briefly, power spectra and respective cross spectra (CS) were estimated by transforming the time series of ABP and NIRS signals with discrete Fourier transformation to the frequency domain. Smoothing the respective periodograms resulted in the power spectra and CS estimates. With the smoothing used (triangular window of half-width 0.02 Hz), the coherence (normalized modulus of CS) is significant at the 95% level if it exceeds 0.72. The phase represents a frequency resolved measure for the temporal lag between the input and output signal. In the present study, phase values were calculated for the relation between ABP and [oxyHb], as it had provided the clearest results in our previous study using two-channel NIRS.5 In our previous study using two-channel NIRS, we had examined the normal phase ABP-[oxyHb] in the frontal cortex in 38 older healthy adults.5 Note that in this study, the sign used for phase was inverse to that used in the present study. From individual data of healthy adults in that study, we have calculated a lower limit (90% quantile) phase ABP-[oxyHb] of to obtain an estimate of normal and pathological values in the frontal cortex. 2.4.Spatial Projection of the Phase ResultsFor illustration of the spatial distributions, individual phase shifts as well as group results were rendered on a standardized cortical surface. To this end, the average positions of the individual 52 NIRS channels in stereotactic Montreal Neurological Institute (MNI) standard space were estimated based on an independent sample of healthy subjects ().13 In this sample, NIRS probes were placed in the same standardized manner (see above) while location and irradiation angles of NIRS probes with respect to the subject’s head were recorded using a PATRIOT digitizer (Polhemus Inc., Vermont). Registration included recording of three fiducials (nasion, left/right preauricular points) and a scattered point-wise sampling of the head surface for co-registration with individual anatomical MRIs based on iterative closest point procedure. Group averages of individual channel positions were calculated after normalization of the channel’s positions from individual space into MNI space. Normalization of channel positions was done using deformation fields derived from the segmentation of anatomical MRIs with SPM814 based on default prior maps for gray and white matter and cerebrospinal fluid.15 2.5.Statistical AnalysisIntraindividual side-to-side differences in phase shifts were analyzed using one-sample -tests (one-tailed) comparing corresponding NIRS channels in the affected hemisphere versus the healthy hemisphere. Only phase values associated with coherence (corresponding to a 95% significance level) were included in this analysis. For group comparisons, a -value of (false discovery rate corrected for multiple comparisons) was considered statistically significant. 3.ResultsBaseline clinical characteristics of patients are given in Table 1. Initial inspections revealed that 10 of 15 patients (67%) showed absolute phase ABP-[oxyHb] values and overall phase responses in the expected (patho)physiological range observed in our previous two-channel NIRS study5 (i.e., between and , pathological cutoff: ). We defined this group as the “typical” group A. Five patients (33%) showed clearly outlying phase values with atypical patterns in the spatial distribution thereof (“atypical” group B). We will describe and analyze both groups separately. Table 1Clinical characteristics of patients.
Note: Stenosis: bold number indicates affected side. Previous symptoms: numbers indicate delay to current measurement in weeks (wk) or years (yrs). Collateral blood flow was dichotomized into good (+) and poor (−). MS, minor stroke. TIA, transient ischemic attack. wk, week. HTN, hypertension. HCHOL, hypercholesterolemia. DM, diabetes mellitus. SMOK, current smoking. 3.1.Group A (Typical Phase Values),Inspection of indiviudal cases revealed prolonged (i.e., poorer) phase values on affected sides in eight patients, and no difference was visible in one patient (pat. A4) (see Fig. 2 for individual phase maps). Paradoxically worse phase values on the unaffected left frontal cortex were observed in one patient (pat. A10) for whom the MRI showed a substantial structural brain lesion of this area after resection of a hemangioblastoma 12 years before (see case illustration in Fig. 3). In the majority of patients, the poorest phase values were localized on affected sides in the superior and middle frontal gyri covering the cortical MCA–ACA borderzone. Group analysis of nine patients (excluding the patient with hemangioblastoma) confirmed a significant side-to-side difference in the anterior borderzone [(Figs. 4(a) and 4(b)]. Of note, a rather equal distribution of phase shift within the normal range could be observed in the unaffected hemispheres [Fig. 4(a)] with a trend to a slightly longer phase shift in more rostral prefrontal areas. Fig. 2Plots show spatial distribution of phase ABP-[oxyHb] in nine patients. Note that plots for patients in which the right hemisphere was affected are flipped, so that the pathological side is always represented on the left hemisphere. The degree of internal carotid artery (ICA) stenosis is listed in Table 1 for every patient. Lower phase values indicate poorer dynamic autoregulation. Channels with significant coherence () are marked with black dots, channels with nonsignificant coherence with white dots.  Fig. 3Case illustration of patient A10 from Table 1. This patient had been included in the study without being aware of a craniotomy with resection of a left-hemispheric hemangioblastoma WHO grade I and Palacos cranioplasty 12 years before [see magnetic resonance imaging (MRI) images in panel A, radiological convention]. (b) Dynamic autoregulation (phase ABP-[oxyHb]) appears to be impaired above the structural brain lesion and not relevantly disturbed on the right side ipsilateral to the asymptomatic severe ICA stenosis. Channels with significant coherence are marked by black dots. 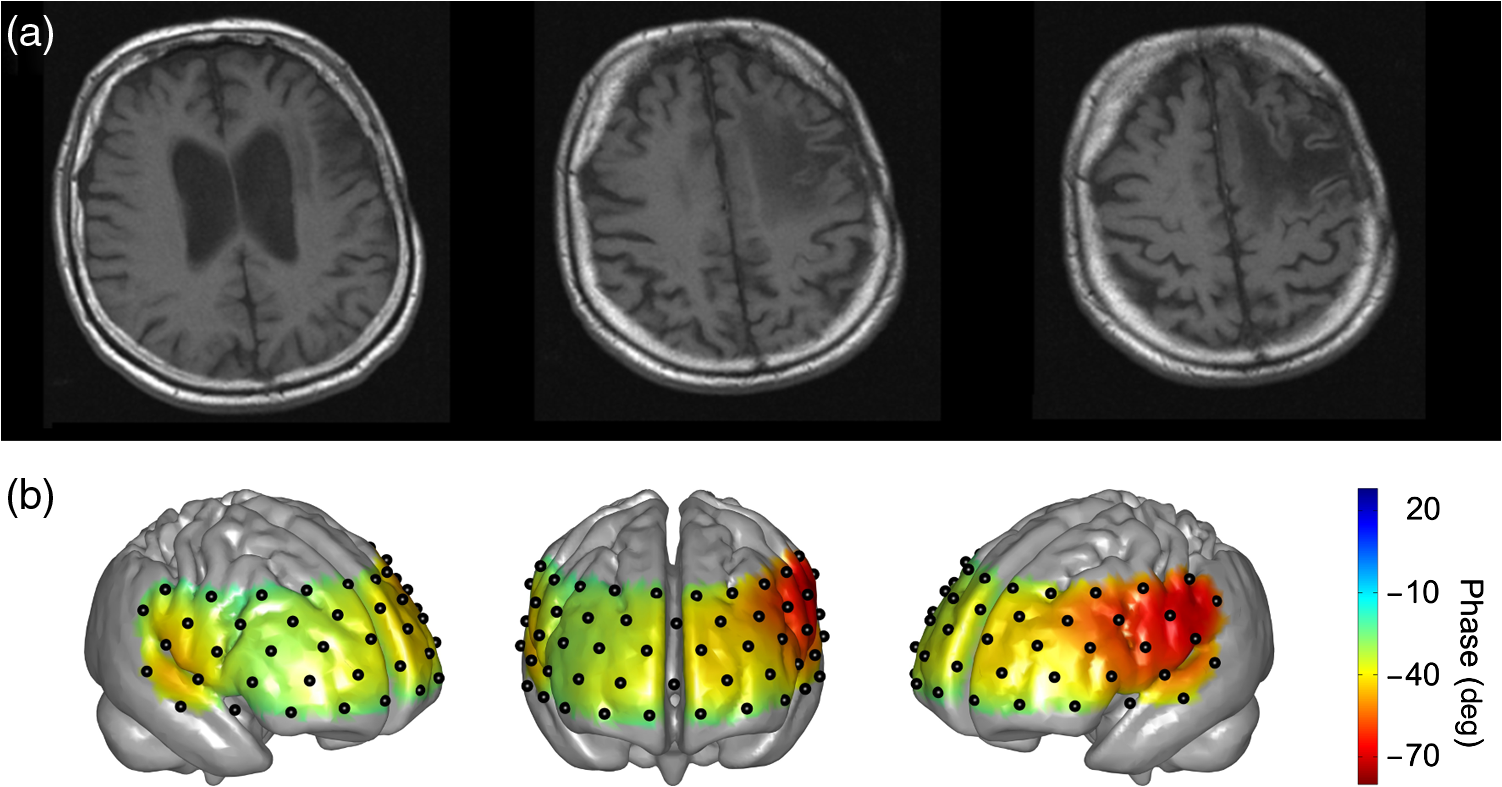 Fig. 4(a) Averaged phase ABP-[oxyHb] of all patients of Fig. 2. Before the group analysis, data of patients with affected right sides were flipped so that the left side represents the affected hemisphere for all patients. Note that only channels with a significant coherence of were considered for this analysis (13 of 468 data points excluded). (b) -map of differences between phase values in affected versus unaffected hemisphere. Channels revealing significantly lower phase values in the affected hemisphere than the corresponding channels in the unaffected hemisphere are marked by black dots (, false discovery rate corrected for multiple comparisons). Again, only values associated with a coherence were included in this analysis.  3.1.1.Association with collateral flow patternIn some patients, phase in the ACA territory of the affected hemisphere was also clearly prolonged beyond the vascular border zone (frontobasal cortex, pats. A1, A2, A7, A8, and A9). None of these patients showed a sufficient cross flow via the anterior communicating artery on ultrasound, thus leading to compromised hemodynamics also in the ACA territory. General grading of the collateral flow pattern by transcranial ultrasound into poor and good revealed a poor pattern in all but one patient of this group (pat. A3), impeding further analyses. Patient A3 with a good collateral flow pattern still showed the expected side-to-side difference in the ABP-[oxyHb] phase shifts (Fig. 2). 3.1.2.Role of coherencePat. A5 showed a low nonsignificant coherence of 0.21 in an upper frontal channel together with atypical negative phase values in this region (see Fig. 2). Inspection of raw data confirmed only weakly pronounced 0.1 Hz NIRS oscillations in this region. Pat. A6 showed a nonsignificant coherence in upper left temporal channels with phase ABP-[oxyHb] being unexpectedly a large negative (see Fig. 2). Inspection of raw data revealed artifacts with sudden steep changes in the NIRS signal. Pat. A4 had a nonsignificant coherence in a small right temporal area with a prolonged negative phase ABP-[oxyHb]. Raw data showed artifacts in the underlying NIRS signal. The coherence in all other patients of this group was at ceiling ( deviation: ). 3.1.3.Association with phase ABP–CBFVThe phase shift between oscillations of ABP and bilateral CBFV in the MCA was available for four patients of this group (see Fig. 2). Three of four patients showed clearly pathological phase values on the affected hemispheres [i.e., ; note different phase limits for TCD in comparison with NIRS, Figs. 1(a)–1(c)]. Phase ABP-[oxyHb] was also reduced on respective sides mainly in the MCA–ACA border zone. Contralateral phase ABP–CBFV values were normal in all patients, but patients with borderline normal values also tended to have a lower phase ABP-[oxyHb] in the respective MCA territory (pats. A5 and A8 versus pats. A7 and A9). 3.2.Group B (atypical phase values, )Spatial patterns of ABP-[oxyHb] phase shifts of the five patients with atypical responses are shown in Fig. 5. Fig. 5Plots show spatial distribution of phase ABP-[oxyHb] in five patients. Plots for patients in which the right hemisphere was affected are flipped, so that the pathological side is always represented on the left hemisphere. Channels with significant coherence () are marked with black dots, channels with nonsignificant coherence with white dots. Results of simultaneously measured phase ABP-CBFV are available for four patients. The degree of ICA stenosis is listed in Table 1 for every patient.  “Pat. B1” showed highly negative phase values on the unaffected right side and a slightly pathological pattern (phase around to ) on the affected left side. The coherence analysis revealed significant lower values on the unaffected side ( versus , ), but most of the channels still reached a significant coherence. Raw data frequently showed faint oscillations and were artifactious in some channels. “Pat. B2” showed extremely negative phase values bilaterally in inferior frontal/superior temporal areas in contrast to all other regions. Phase spectra showed clear artifacts (wrap-around) at 0.1 Hz for the respective NIRS channels, but coherence was nonsignificant only in some of these, yet with a mean coherence of being clearly lower than in group A patients. The phase between ABP and CBFV in the MCA was slightly reduced on both sides, definitely not explaining the extremely negative phase ABP-[oxyHb]. “Pat. B3” showed poorer phase values in the affected left MCA territory. This is in line with poorer phase ABP–CBFV on the affected side. This patient had, however, strongly negative and thus pathologocial phase values in both ACA territories. Neither routine clinical examination nor transcranial Duplex ultrasound (collateral pattern) nor brain MRI provided any explanation for this finding. Coherence was very high and phase spectra were unremarkable. We thus assume that this patient has a poor autoregulation in the bilateral dorsolateral prefrontal cortex. “Pat. B4” showed phase values beyond the usual pathological range on both sides. Coherence was nonsignificant in various channels of both sides, yielding a possible explanation for the aberrant results. “Pat. B5” showed a paradoxically positive phase shift bilaterally in inferior frontal/superior temporal areas and highly negative phase values in all other channels, even on the unaffected side. Coherence was nonsignificant mainly over the right temporal area and phase sprectra showed clear wrap-around artifacts in the respective areas. Overall coherence values were, however, not so low (). The phase ABP–CBFV in the MCA was completely normal on the unaffected side and slightly reduced on the affected side, thus not explaining the atypical NIRS finding. 4.DiscussionThis is, to our knowledge, the first study assessing the spatial distribution of cerebral autoregulation over the frontal cortex in human carotid artery disease. Phase shift indicated dynamic autoregulatory impairment on affected sides mainly in the cortical border zone between MCA and ACA territory. Prior to any physiological interpretation, the fact that only two thirds of the patients showed a “typical” phase response should be emphasized. In general, patients with typical responses mostly had significant coherence values around all channels. Already in this group, however, some smaller outlying areas were observed mainly due to nonsignificant coherence and artifacts in the NIRS signals. Together with the generally lower coherence in the “atypical” group B (even if still significant at many points), it appears that not only a significant coherence (here significant at 95% level) but also a high absolute value of coherence (e.g., above 0.85 or 0.90) between ABP and NIRS signals is important for the assessment of cerebral autoregulation using multichannel NIRS. To be sure to avoid channels with potential noise, only channels with a high coherence should be considered for analysis. A longer measurement duration than is currently performed might increase the coherence and reliability of phase relationships. Analysis of the patients with “atypical” patterns showed either reduced coherence or phase spectra artifacts (wrap-around) to be responsible for the observed deviations in four of five patients. At least in one patient it is, however, possible that results represent a true autoregulatory disturbance in the unaffected hemisphere (pat. B3). A number of transcranial Doppler studies on dynamic autoregulation have been performed in severe carotid artery disease using phase shift between oscillations of ABP and CBFV in the MCA.9,16–18 Phase shift was impaired with poor collateral flow, increasing the degree of stenosis and predicted future stroke. In the present study, we found a quite good fit of phase ABP–CBFV with overall results of phase ABP-[oxyHb] in group A, although the number of eligible patients was too small to draw firm conclusions. Using multichannel NIRS, we have found the expected side-to-side difference in the ABP-[oxyHb] phase shifts in the majority of patients. This is in line with the available phase ABP–CBFV results and the fact that a poor collateral flow pattern was predominant in the present patients. Of interest, dysautoregulation was significantly focused to the anterior cortical border zone (watershed) and less pronounced in the MCA territory. As of yet, the spatial distribution of dynamic cerebral autoregulation within a vascular territory is largely unknown, particularly in disease processes such as carotid stenosis. In healthy adults, no differences in dynamic autoregulation between various cortical regions were found using MRI.7 One recent study using 12-channel NIRS found regional variations of cerebral autoregulation in critically ill infants.19 Multichannel NIRS has also been applied for perfusion measurement in adults with MCA stenosis and a delayed perfusion predominantly in the vascular border zone has been found in Ref. 20. Although the anterior cortical border zone is a well described area for (hemodynamic) infarction in carotid artery disease,21 no experimental studies examining cerebral autoregulation in this area exist in humans so far because of possible harm during pharmacological blood pressure reduction. Interestingly, studies assessing the dilatory reserve capacity of cerebral arterioles, which does not exactly mirror the intrinsic ability of autoregulation, did not consistently show the poorest values in the cortical vascular border zones.21–23 The present finding of poorest dynamic autoregulation in the anterior cortical border zone (watershed) supports a significant hemodynamic component of infarctions in this area, perhaps in the sense of impaired washout of coexisting emboli.24 4.1.LimitationsBecause of the limited depth of near-infrared light scattering, mainly cortical hemodynamics is reflected by NIRS. We thus cannot assess other areas of interest such as internal watershed areas. Superficial leptomeningeal collateral flow, which usually indicates a poor collateral situation, can occur in ICA occlusion via the posterior cerebral artery.25 Although this could have influenced the results of NIRS hemodynamics, additional measures by means of transcranial ultrasound have provided evidence for strong leptomeningeal collateralization via the posterior cerebral artery in only one of the present patients who did not show a specifically altered hemodynamic pattern (pat. A4). The main methodological limitation of the NIRS methodology is the extra-cranial contamination. With the applied relatively small separation of optodes, a considerable sensitivity to skin blood flow dynamics might be assumed. This extracranial contribution will potentially be different for those probes residing on top of the temporal muscles as opposed to those on the forehead. Thus, the presented phase ABP-[oxyHb] will probably contain a component in phase with ABP (when corrected for the delay) and a phase-shifted component coming from the cerebral circulation. Further, the intrinsic delay of [oxyHB] signal to ABP from the extra- and intracranial part will potentially also be different. Still, we found a quite good qualitative agreement between individual phases ABP–CBFV and ABP-[oxyHb] in our study. Also in our previous study, we found a highly significant correlation between these phase shifts.5 The present multichannel NIRS approach does not allow for the separation of intracranial and extracranial signal contributions, but recent advances in NIRS technology for recordings at higher densities may provide this possibility in future studies. By injection of an exogenic contrast agent, the feasibility of providing in-depth resolution using a tomographic approach with high-density constant wave NIRS has already been demonstrated.26 4.2.ConclusionsDynamic cerebral autoregulation can be spatially assessed from slow hemodynamic oscillations with multichannel near-infrared spectroscopy and transfer function analysis if a high coherence of ABP and NIRS oscillations and the absence of phase spectra artifacts (wrap-around phenomena) are respected. In high-grade carotid artery disease, cortical dynamic autoregulation is affected most in the vascular border zone. Spatial mapping of dynamic autoregulation by multichannel NIRS may serve as a powerful tool in identifying brain regions at specific risks for ischemia in various neurovascular diseases. AcknowledgmentsThis research was partly supported by the BrainLinks-BrainTools Cluster of Excellence funded by the German Research Foundation (DFG; grant number EXC 1086). ReferencesM. Czosnykaet al.,
“Monitoring of cerebrovascular autoregulation: facts, myths, and missing links,”
Neurocrit. Care, 10
(3), 373
–386
(2009). http://dx.doi.org/10.1007/s12028-008-9175-7 NCEACB 1541-6933 Google Scholar
R. B. Panerai,
“Transcranial Doppler for evaluation of cerebral autoregulation,”
Clin. Auton. Res., 19
(4), 197
–211
(2009). http://dx.doi.org/10.1007/s10286-009-0011-8 CAURE9 0959-9851 Google Scholar
T. B. Kuoet al.,
“Mechanisms underlying phase lag between systemic arterial blood pressure and cerebral blood flow velocity,”
Cerebrovasc. Dis., 16
(4), 402
–409
(2003). http://dx.doi.org/10.1159/000072564 CDISE7 1015-9770 Google Scholar
R. R. Diehlet al.,
“Spontaneous blood pressure oscillations and cerebral autoregulation,”
Clin. Auton. Res., 8
(1), 7
–12
(1998). http://dx.doi.org/10.1007/BF02267598 CAURE9 0959-9851 Google Scholar
M. Reinhardet al.,
“Oscillatory cerebral hemodynamics--the macro- vs. microvascular level,”
J. Neurol. Sci., 250
(1–2), 103
–109
(2006). http://dx.doi.org/10.1016/j.jns.2006.07.011 JNSCAG 0022-510X Google Scholar
N. P. Saeedet al.,
“Measurement of cerebral blood flow responses to the thigh cuff maneuver: a comparison of TCD with a novel MRI method,”
J. Cereb. Blood Flow Metab., 31
(5), 1302
–1310
(2011). http://dx.doi.org/10.1038/jcbfm.2010.225 JCBMDN 0271-678X Google Scholar
M. A. Horsfieldet al.,
“Regional differences in dynamic cerebral autoregulation in the healthy brain assessed by magnetic resonance imaging,”
PLoS One, 8
(4), e62588
(2013). http://dx.doi.org/10.1371/journal.pone.0062588 1932-6203 Google Scholar
J. M. de BrayB. Glatt,
“Quantification of atheromatous stenosis in the extracranial internal carotid artery,”
Cerebrovasc. Dis., 5 414
–426
(1995). http://dx.doi.org/10.1159/000107895 CDISE7 1015-9770 Google Scholar
M. Reinhardet al.,
“Dynamic cerebral autoregulation and collateral flow patterns in patients with severe carotid stenosis or occlusion,”
Ultrasound Med. Biol., 29
(8), 1105
–1113
(2003). http://dx.doi.org/10.1016/S0301-5629(03)00954-2 USMBA3 0301-5629 Google Scholar
J. S. Wyattet al.,
“Quantitation of cerebral blood volume in human infants by near-infrared spectroscopy,”
J. Appl. Physiol., 68
(3), 1086
–1091
(1990). JAPYAA 0021-8987 Google Scholar
M. Reinhardet al.,
“Transfer function analysis for clinical evaluation of dynamic cerebral autoregulation - a comparison between spontaneous and respiratory-induced oscillations,”
Physiol. Meas., 24
(1), 27
–43
(2003). http://dx.doi.org/10.1088/0967-3334/24/1/303 PMEAE3 0967-3334 Google Scholar
J. Timmeret al.,
“Cross-spectral analysis of physiological tremor and muscle activity. I. Theory and application to unsynchronized electromyogram,”
Biol. Cybern., 78
(5), 349
–357
(1998). http://dx.doi.org/10.1007/s004220050439 BICYAF 0340-1200 Google Scholar
C. P. KallerK. Schumacher, Google Scholar
“Statistical Parametric Mapping (SPM),”
(2009) http://www.fil.ion.ucl.ac.uk/spm/software/spm8/ ( April ). 2009). Google Scholar
J. Ashburner,
“A fast diffeomorphic image registration algorithm,”
Neuroimage, 38
(1), 95
–113
(2007). http://dx.doi.org/10.1016/j.neuroimage.2007.07.007 NEIMEF 1053-8119 Google Scholar
H. H. Huet al.,
“Transfer function analysis of cerebral hemodynamics in patients with carotid stenosis,”
J. Cereb. Blood Flow Metab., 19
(4), 460
–465
(1999). http://dx.doi.org/10.1097/00004647-199904000-00012 JCBMDN 0271-678X Google Scholar
R. R. Diehlet al.,
“Phase relationship between cerebral blood flow velocity and blood pressure. A clinical test of autoregulation,”
Stroke, 26
(10), 1801
–1804
(1995). http://dx.doi.org/10.1161/01.STR.26.10.1801 SJCCA7 0039-2499 Google Scholar
C. Haubrichet al.,
“M-wave analysis and passive tilt in patients with different degrees of carotid artery disease,”
Acta Neurol. Scand., 109
(3), 210
–216
(2004). http://dx.doi.org/10.1034/j.1600-0404.2003.00210.x ANRSAS 0001-6314 Google Scholar
M. D. Papademetriouet al.,
“Multichannel near infrared spectroscopy indicates regional variations in cerebral autoregulation in infants supported on extracorporeal membrane oxygenation,”
J. Biomed. Opt., 17
(6), 067708
(2012). http://dx.doi.org/10.1117/1.JBO.17.6.067008 JBOPFO 1083-3668 Google Scholar
A. Oldaget al.,
“Assessment of cortical hemodynamics by multichannel near-infrared spectroscopy in steno-occlusive disease of the middle cerebral artery,”
Stroke, 43
(11), 2980
–2985
(2012). http://dx.doi.org/10.1161/STROKEAHA.112.656710 SJCCA7 0039-2499 Google Scholar
I. Momjian-MayorJ. Baron C,
“The pathophysiology of watershed infarction in internal carotid artery disease: review of cerebral perfusion studies,”
Stroke, 36
(3), 567
–577
(2005). http://dx.doi.org/10.1161/01.STR.0000155727.82242.e1 SJCCA7 0039-2499 Google Scholar
M. Wiartet al.,
“Vasodilatory response of border zones to acetazolamide before and after endarterectomy: an echo planar imaging-dynamic susceptibility contrast-enhanced MRI study in patients with high-grade unilateral internal carotid artery stenosis,”
Stroke, 31
(7), 1561
–1565
(2000). http://dx.doi.org/10.1161/01.STR.31.7.1561 SJCCA7 0039-2499 Google Scholar
D. A. CarpenterR. L. Grubb Jr.W. J. Powers,
“Borderzone hemodynamics in cerebrovascular disease,”
Neurology, 40
(10), 1587
–1592
(1990). http://dx.doi.org/10.1212/WNL.40.10.1587 NEURAI 0028-3878 Google Scholar
L. R. CaplanM. Hennerici,
“Impaired clearance of emboli (washout) is an important link between hypoperfusion, embolism, and ischemic stroke,”
Arch. Neurol., 55
(11), 1475
–1482
(1998). http://dx.doi.org/10.1001/archneur.55.11.1475 ARNEAS 0003-9942 Google Scholar
M. Kawashimaet al.,
“Leptomeningeal collateral and cerebral hemodynamics in patients with ICA and MCA steno-occlusion,”
Neurol. Res., 33
(3), 307
–313
(2011). http://dx.doi.org/10.1179/016164110X12714125204434 Google Scholar
C. HabermehlC. H. SchmitzJ. Steinbrink,
“Contrast enhanced high-resolution diffuse optical tomography of the human brain using ICG,”
Opt. Express, 19
(19), 18636
–18644
(2011). http://dx.doi.org/10.1364/OE.19.018636 OPEXFF 1094-4087 Google Scholar
BiographyMatthias Reinhard is an adjunct professor of neurology, faculty of medicine of the University of Freiburg, and a consultant neurologist at the Department of Neurology, University Medical Center Freiburg. He is the head of the Stroke Unit and the Ultrasound Laboratory of the department. He has further specialized in neurointensive care medicine and geriatrics. His research focus lies in neurovascular medicine, autonomic disorders, and cerebral hemodynamics. |


