|
|
1.IntroductionNanomanipulation in the context of biology is a well discussed and reviewed topic in the scientific community in the last decades.1 The ability to control an arm at the nanoscale level has shown promise in material sciences and biology.2,3 A simple way to achieve this small scale manipulation in a lab is to use an atomic force microscope (AFM), a derivative from scanning probe microscopes (SPMs).4 AFM measures the deflection of a cantilever, which is caused by the interaction with the surface of the sample and a sharp tip that extends from the free end of the cantilever. This deflection characterizes the distance from the sample and force felt by the tip. The SPM methods initially worked on conductive samples and vacuum conditions giving resolution at the subangstroms scale, but AFM gained its popularity and demand because of its ability to work also on insulating materials and in liquid environments; especially in physiological conditions.5 Commercial AFMs are now designed to work in a dry environment for material sciences applications and wet environments for investigating biological systems. AFM is an established technique in the study of cellular morphology and local stiffness, understanding protein folding mechanisms, checking model membranes stability, etc.6–9 As pointed out before, the AFM cantilever with the help of its extended stylus reaches the sample and precisely calculates the surface height. However, if more force is applied on this stylus, the stylus mechanically interacts with the sample. The spatial precision of this interaction is defined by the AFM tip size that could be tens of nanometres, but this manipulation is limited by its nonspecific nature in identifying the sample10,11 or selecting a target for manipulation. An optical microscope coupled to an AFM can recognize and target an area of interest with the help of specific identification markers like fluorescence tags. In the past years, superresolution (SR) fluorescence microscopes have taken the place of conventional fluorescence microscopes like confocal and widefield microscopes. The SR microscopy methods visualize the fluorescence below the classical optical diffraction limit () and reach nanometre level lateral resolution. An example of SR microscope techniques such as stimulated emission depletion (STED)12 microscope is an improvement over the confocal microscopes. This article demonstrates how to build an STED microscope from a commercial multiphoton microscope with its complete building blueprint. An STED microscope coupled to an AFM enables the AFM tip with nanoscale manipulation capabilities.10 The SR visualization helps in fast and specific identification of subdiffraction cellular structures and manoeuvring of the AFM tip onto the target. In addition, the movement can be traced live with the microscope for understanding real time responses because of the manipulation.10 Bionanomanipulation is demonstrated under the popular science terms like nanorobotics, single-molecule manipulation, etc.13,14 From the manipulation of chromosomes two decades ago, science advanced to single-molecule experiments in which viruses, nucleic acids, or proteins could be manipulated with discrete units of force.15–17 Although many of these nanomanipulation techniques lack targeting ability, this can be overcome now by visualizing the movement in real-time with STED AFM.10 Cellular structures, in particular cytoskeletal structures are compelling for their distinct AFM signature because of its rigidity and subresolution sizes ().18 Concisely, this article demonstrates how to build and use a high-resolution STED microscope coupled with an AFM to perform bio-manipulation with subdiffraction precision. 2.Materials and MethodsSTED microscopy19 is a fluorescence-based optical SR imaging technique, and it works by the principle of reversible saturable optical fluorescence transitions.20 The key element of STED is the selective switching off of the fluorescence using the principle of stimulated emission.21 Switching off fluorescence from the periphery of the excitation focus leaves fluorescence originating only from a subdiffraction sized spot at the center. Scanning the sample with this focal spot results in a superresolved image, whereas the conventional confocal spot is limited by the diffraction, and the image will look blurred. This controlled spatial switching off in STED is done by a phase engineered laser beam (STED beam) that takes the shape of a doughnut at the optical focus. From the principle of stimulated emission, light at a suitable wavelength chosen within the fluorescence emission spectrum of a fluorophore can deplete its fluorescence with a finite probability. A complete depletion from the periphery can be ensured by increasing the number of potential events, which is simply done by increasing the power of this depletion laser.22,23 2.1.Building the STED MicroscopeWhen it comes to build an STED setup, the basic architecture has changed a lot in the last decade. Cost efficient continuous wave laser-based STED,24 multicolor STED imaging,25 live cell STED imaging,26 single-wavelength STED,27 time gated STED,28 and modulated STED (Ref. 29) are a few of them. The selection of laser lines used for STED and excitation plays an important role in defining the resolution and uses a good part of the budget. If built from a multiphoton setup,30 the same multiphoton laser can be used as the STED laser, resulting in a cost efficient STED unit. However, using a pulsed laser to do STED also means that the temporal synchronization of the beams plays a role as crucial as the spatial overlay of the excitation and STED beams.24 In effect, these spatial and temporal alignments must be finely controlled in order to maximize the depletion ratio for a particular fluorescent dye and thence obtain an STED microscope.31,32 The STED microscope was custom made, based on a multiphoton microscope Nikon A1R-MP (Nikon Instruments Inc., Melville, New York). The system employs a pulsed STED system combining a triggered excitation from a pulsed diode laser PDL-800 (PicoQuant GmbH, Berlin, Germany) and the multiphoton excitation laser for STED. The excitation wavelength was 640 nm and the depletion laser wavelength was set to 760 nm. Two polarizing beam splitters (PBS1, PBS2) were mounted in the laser path to split the laser from the multiphoton excitation laser beam path and combine the paths back before the beam enters the scan head of the multiphoton microscope (refer Fig. 1). A mechanical shutter placed before the fiber coupler in this path controls the switching on/off of the STED laser. This extra path helps not to alter any characteristic of the IR beam path and includes a complete optical geometry to build an STED beam [illustrated in blue color in Fig. 1(b)]. Fig. 1The schematic of the setup: (a) the multiphoton laser path and (b) the laser path (red) with the extra optical components used for enabling stimulated emission depletion (STED) microscopy in blue color. PBS: polarizing beam splitter, SMF: single-mode polarizing maintaining optical fiber, MP: multiphoton, Amp: electronic amplifier, : half wave plate, : quarter wave plate. An optional shutter could be placed before SMF that is not shown in the figure. 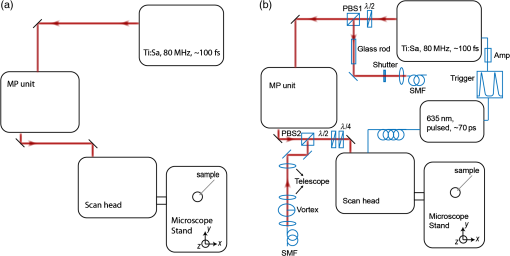 The laser pulse from the polarizing beam splitter (PBS1) is coupled into a 100-m polarization-maintaining single-mode optical fiber (SMF) using a fiber coupler facilitated with a pair of rectangular glass prisms to prestretch the pulse. This prestretching the laser pulse will protect the optical fiber entrance from potential damages caused by misaligned large photon densities. The output laser beam from this SMF will have a clean Gaussian beam shape and larger pulse width. A phase plate (RPC Photonics, Rochester, New York) is placed at the fiber collimator output to create the doughnut shape at the focus. The beam rejoins with the multiphoton excitation beam after this phase engineering. In case of a mismatch of the beam widths of the multiphoton laser beam and the modified STED beam at the IR entrance port of the scan head, the beam width of the STED laser beam has to be matched using a telescope setup or by changing the fiber collimator [refer Fig. 1(b)]. A doughnut shaped focus is ensured by circularly polarizing this phase engineered laser beam with a helical phase of wavelength intervals. A pair of half-wave plate and a quarter-wave plate placed after the phase plate forces circular polarization to the beam with a high degree of polarization. The polarization at the objective back focal plane is verified with the help of a polarization analyser tool (Schäfter + Kirchhoff GmbH, Hamburg). Notice that one particular face of the phase plate matches to either right or left circular polarization. In the excitation path, the pulsed picosecond diode laser is triggered using an electronic trigger output from the multiphoton laser source. Another polarization maintaining fiber was used to transfer the light into the auxiliary fiber input of the scan head. This coupling can vary depending on the microscope unit used. A 1.4 NA oil-immersion objective lens (Nikon Instruments) was used for all the measurements. The dichroic filter inside the scan head was replaced with a custom dichroic (LaserOptik GmbH, Garbsen, Germany), which reflects the STED and excitation wavelengths and transmits the emission wavelength. A custom dichroic filter with reflection bands at 635 to 645 nm and 730 to 820 nm was used in combination with an emission band pass filter (). Standard dichroics used in regular confocal/multiphoton excitation do not match these particular set of wavelengths. Hence, this dichroic has to be procured before all other steps and fixed on the dichroic wheel/unit inside the scanner. 2.2.Testing STED SystemThree-dimensional (3-D) imaging of reflective gold beads of 80-nm diameter was used to visualize the point spread function (PSF). The overlay of the excitation laser on the STED laser is tuned by walking either one of the beams over the other. Most of the microscope scan boxes are equipped with a reflection imaging beam splitter in the dichroic selection wheel, which transmits less than 1e−2 of the excitation laser beam power to the detection unit while a dichroic would filter out the excitation spectrum. Commercial microscope software can plot this stack of two channels in live, which simplifies the alignment of the PSF (refer to Fig. 2). The phase plate’s lateral position can be verified by examining spatial superposition of the doughnut shaped beam onto the excitation beam. Fig. 2STED microscope: (a) three-dimensional (3-D) visualization of 150-nm-gold beads imaged with STED and excitation beams to align them spatially one over the other. The 3-D visualization shows three planes: plane (top left) and projections of to and -axes ( at bottom and toward right). STED efficiency: (b) and (c) a pair of images of 40-nm crimson fluorescent spheres imaged by confocal and STED, respectively. (d) and (e) Images of a PtK2 cell imaged with confocal and STED, respectively. Abberior Star635P was used to label the microtubules inside the cell. (f) The line profiles of the dotted line in the zoom inset of the beads image. The red graph shows the STED, and three individual beads can be completely separated in STED. (g) The line profile of the dotted line shown in the microtubule image inset in (d) and (e). 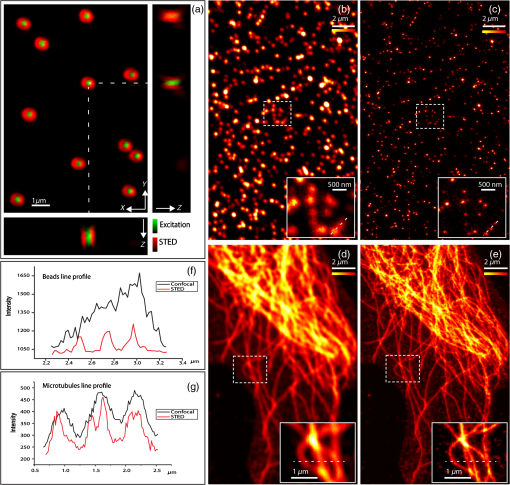 The temporal overlay of the laser pulses arriving at the focus can be studied with the help of a photodiode and an oscilloscope. The delay between pulses is adjusted by changing the length of the cable used for triggering the excitation laser. This delay is accounted by finding the optical path difference between the two laser paths. The maximum delay length unit corresponding to the repetition rate from the femtosecond laser, which in this case (80 MHz laser) is 12.5 ns () and is equivalent to an optical path length of 1.875 m. The electronic signal speed in the copper cables lies in the range between () and (). The speed in the cables was calibrated with a known length of cable, and a sufficient cable length was used to account for the delay. Additionally, a short optical delay is employed using the fiber coupler of the laser on a precise micrometer stage with a range of a few centimetres. This small movement can fine-tune the pulse position. Continuous/live imaging of a fluorescent dye solution like Atto647N can be carried out to measure the fluorescence depletion (the reduction of fluorescence signal when the STED light is switched on) by comparing the fluorescence histograms with and without the STED beam. Maximize this fluorescence depletion, and the system will be enabled with STED imaging. In order to evaluate the resolution of the STED setup, subdiffraction sized fluorescent beads (40-nm crimson fluorospheres) were imaged in confocal mode (excitation laser only) and STED mode (both excitation and STED lasers are on). The resolution of the image increases when the STED laser power is increased. Refer to Fig. 2 for crimson beads (40 nm) images shown in both imaging modalities [Confocal Fig. 2(b) and STED Fig. 2(c)] to show the resolution enhancement. These resolution values can evaluate the efficiency of the setup. Fluorescent microspheres () are a common technical calibration sample for estimating resolution in SR microscopy because of their brilliant fluorescence and spherical shape. In fact, a fine-tuning of the phase plate position is still possible by looking at the brightness of the beads, which are at possible maximum values when the center of the doughnut aligns to the excitation maxima. An excitation laser power of and an STED laser power below were measured at the back aperture of the objective. The images were collected at pixel dwell time, and the line averaged 8 times to give a good signal-to-noise ratio. Both STED and confocal are measured with the same imaging settings. The system efficiency can also be checked in biological samples as shown in Fig. 2 [confocal in Fig. 2(d), STED in Fig. 2(e)]. Immunostained samples for this excitation—STED wavelength pair can be used to evaluate the resolution enhancement. A standard sample used for this purpose is fluorescently marked microtubules because the microtubule filaments can be as small as in diameter. The labeling protocol for STED imaging was optimized by using methanol fixation33 for Abberior Star 635P antibodies for alpha-tubulin on fixed Ptk2 cell line. These measurements used an excitation laser power below and an STED laser power below , measured at the back aperture of the objective lens with a power meter. The images were collected at pixel dwell time and line averaged to give a good signal-to-noise ratio. The dynamic range of detection can be optimized by the photomultiplier tube (PMT) gain adjustment. The crucial part that determines the efficiency of an STED setup is the STED laser power delivered at the focus. This can be optimized by adjusting the beam width of the STED laser at the back aperture of the objective lens, adjusting the pulse width of the STED laser by controlling the length of fiber used, choosing the right wavelength for depletion, etc. Planning a daily routine check of the fiber power throughput is also advisable. Commercial ultrafast lasers are spectrally tunable, and this tunability should be used to maximize depletion in the sample. Keep in mind that the power output could change with respect to the wavelength of operation and also could move the position in time. However, the beam can be aligned back within a few minutes by following this protocol. 2.3.STED AFMA commercial AFM (JPK NanoWizard II, JPK Systems, Berlin, Germany) was coupled to the abovementioned microscope enabled with STED imaging. The microscope stage was exchanged with an AFM compatible stage, which features minimum mechanical coupling of noise to the AFM cantilever (refer Fig. 3). This procedure of stage replacement is designed and carried out by the AFM manufacturer. Fig. 3STED atomic force microscope (AFM): (a) STED microscope design that looks very similar to a normal microscope (b) STED AFM stage change. The blue color shows the AFM stage and the AFM. (c) A schematic of the STED AFM with details (sizes are not proportional). 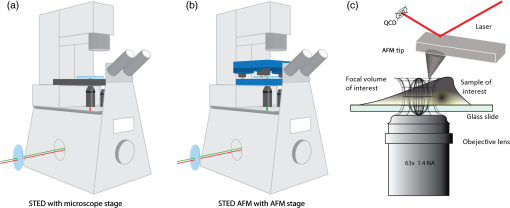 Figure 3(b) shows the new parts added to achieve AFM modality on the system. Figure 3(c) shows a clear representation of how STED and AFM can work together. The direct overlay (JPK Systems) is an option available in the AFM software that visualizes an optical image and underlays it as the background of the AFM image coordinate system with a new color scale range. A short AFM scan helps to fix a common point of origin between the two image coordinates by shifting the STED image.22 Direct overlay requires an image calibration file created for an objective and field-of-view from an image sequence of AFM movements. In case the AFM overlay calibration is not sufficient, it is possible to manually input the calibration values for matching the image position.10 Different AFM manufacturers give different programs for similar visualization. 2.4.ManipulationAcquire a high-resolution STED image with high STED laser power. Transfer this file and use this image as the map for AFM targeting (which gives a higher localization of structures than a confocal image). However, for a live monitoring of the movement, use STED video acquisition at low STED power modes to avoid field enhancement near the tip.10 Coordinates can be input on the AFM for designing an arbitrary pattern for manipulation. The AFM manipulation software support interactive movement of the tip in any direction with variable force and velocity. This is used for different type of AFM movements. As mentioned before, STED AFM unit based on Ti:Sapphire laser is used with a lower STED laser power to avoid strong field enhancement effects.32 This reduces photodamages but hinders the unit from live monitoring with its maximum resolution. This effect of the AFM tip is more prominent when it is approached on to the sample. Hence, the STED power for an experiment can be optimized by approaching the tip to the glass and increases the laser power and monitoring the scattering intensity from the tip. In experience, we have found that working below 60-mW STED laser power was safe for beads and cells. Presence of impurities or rough glass surface could possibly change these values. However, choosing to build an STED unit in the greener side of the spectrum34 can help to minimize this. STED microscope software and AFM software work on different platforms; faster data transfer can be achieved by integrating the software into one or using a transfer software like Samba. If a stage scanning AFM unit is used, visualization of fluorescence can be done within the AFM software as well, but it will be limited by the speed of the stage scanning. 3.Results and DiscussionThe multiphoton setup was successfully adapted to a high resolution STED microscope, and high-resolution manipulation schemes are available through the coupled AFM. The STED microscope evaluation results were presented in Sec. 2.2. 3.1.STED AFM Manipulation of BeadsThe targeting capability of STED AFM was previously described by using a coordinate adjustment in Sec. 2.3. A live monitoring can overcome the hassle of underlaying the map and can visualize “live” the tip-sample responses. As shown in Fig. 4, a high resolution map given to the AFM helps to fix the coordinate system for the manipulation. The video shows a sample of crimson fluorescent beads of 40-nm drop casted on a glass coverslip coated with Poly-L-lysine. In the video, an AFM movement is carried out at , and the movement is imaged at a low resolution (lower STED laser power) so that sample is not affected by laser intensity near the AFM.10 This video imaging resolution () is higher than confocal () and used a speed of 2 fps with a pixel size of 40 nm. The high resolution map is useful in committing different targeted motions in one single go. But if the aim is to have a real-time feedback from the movement, the live imaging with lower STED resolution will serve the purpose. We can follow the same bead in motion or same molecule of interest without losing the molecule. The high resolution map can still be used in defining routes for particles of interest without hitting another particle or hit a targeted particle. Fig. 4The low resolution monitoring for AFM movement: in a sample of crowded 40-nm crimson fluorescent beads sample, the AFM tip is moved between two adjacent beads without touching or moving any of them. This is achieved by the high resolution map that separates the beads completely. The low resolution STED imaging can still distinguish the two beads where you can see the tip moving around the beads in the marked trajectory in the map. (MPEG, 1.46 MB) [URL: http://dx.doi.org/10.1117/1.JBO.19.10.105003.1]. 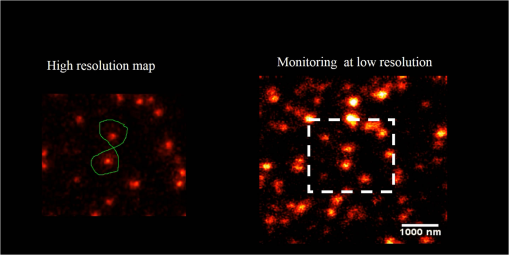 The movement was made by patterns of manipulation (hand drawn in the software) with a targeting ability in the order of tens of nanometers (refer the left panel in the video). The video illustrates that the tip can move between two closely lying beads without touching them. We assume that the fluorescence seen at the end of the tip is contact staining because the tip came in contact with other beads before finding a common point of origin. 3.2.STED AFM Manipulation of CellsWith the ability to target and move, the next step in targeted manipulation was to check on biological samples like cells. But cells are larger and elastic compared with material samples like beads, and they have membranes that hinder a direct impact of the AFM tip. The cells are in a wet medium, and the manipulation movements are hindered by the presence of unobserved nonfluorescent parts of the cell. The tests were carried out on microtubules labeled with Abberior Star 635P inside the cells of fixed fibroblast cells. AFM tip probed the cell surface with a higher force to mechanically interact with the cell exterior. The live monitoring is more useful in case of cellular manipulation because the cell sets back to its position after the mechanical push (refer Fig. 5). Figure 6 stands as an explanation for Fig. 5. In Fig. 5, we demonstrate the movement of the cell in different targeted directions with different amounts of force. The STED image and the confocal image were taken to visualize the resolution enhancement shown in Figs. 6(b) and 6(c). The STED image was used as a map for AFM movements like in the case of beads. Fig. 5Manipulation performed on a fixed cell: three different movement areas are recorded in this video segment. The confocal and STED images are shown to demonstrate resolution difference. The three different movements shown uses different forces. The still images were done at the lower most part of the cell, and the AFM interaction is recorded at a different height so that movement can be visualized. (MPEG, 1.68 MB) [URL: http://dx.doi.org/10.1117/1.JBO.19.10.105003.2]. 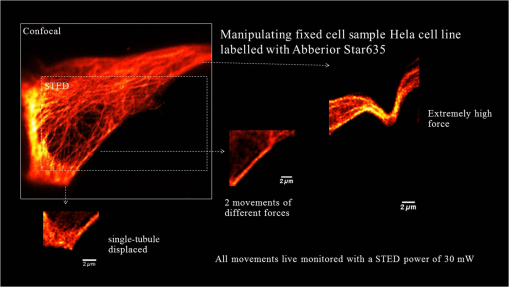 Fig. 6Manipulation performed on a fixed cell: (a) the sample seen in the large field of view. (b) and (c) The confocal and STED images of the selected cell. (c) Two targeted areas close to the periphery of the cell that are shown in (d, e) and (f, g). (d) and (e) A small movement carried out in order of hundreds of nanometers. (f) and (g) Manipulation performed with a higher force in order to visualize stretching of a single microtubule bundle. (h) The zoomed in view of the selected area in (g) to visualize a tubule being separated. 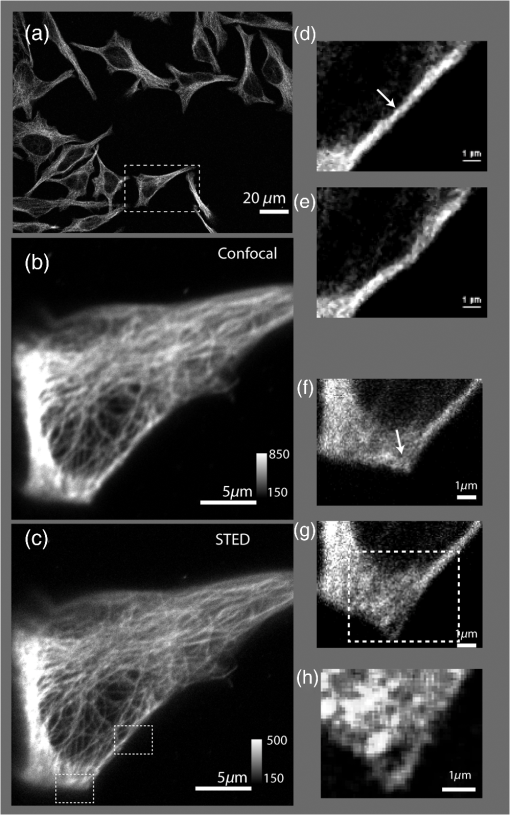 The still high resolution images were done at the lower most part of the cell close to the glass, and the AFM interaction was recorded at a different height. Live monitoring helps to navigate and find the interacting section of the cell. The video shows three different regions and movements imaged at 1 fps at pixel size of 75 nm, so that the entire cell remains in the field-of-view. STED pixel size is always chosen below half the diffraction limit, and the frame rate is decided by the field-of-view (interest), speed of manipulation, and the response from the sample. Only two motions are examined in Figs. 6(d,e) and 6(f,g). These panels show small movements made at the border of the cell. A single tubule is stretched and visualized in Fig. 5, which can be seen in Fig. 6(h). These different recorded mechanical drag motions are demonstrated for pointing the manipulation and visualization capability with STED AFM. Notice that the images in Figs. 6(b) and 6(c) are raw images without the aid of any deconvolution algorithms. On the contrary, using deconvolution algorithms on STED images can give these images an even better visualization.35 It is also possible to switch the normal PMT detector with a single-photon counting avalanche photodiode (APD) in the external detector channel or a Gallium arsenide phosphide detector (GaAsP). APDs and GaAsPs are highly sensitive compared with PMTs, and this helps to work at even lower excitation laser powers and minimize any potential photodamages. The images of the cells were acquired using a GaAsP detector and an excitation laser power below , and STED laser power was measured below 70 mW. The STED power was optimized for every experiment while working to achieve a good balance between resolution and tip-induced damage. In a crowded sample, targeting is important to question one particular cell or its structure. As seen in Fig. 5, the filaments go back to their positions rapidly, and only a fast correlative imaging is able to follow such a reaction. The imaging time is crucial in cells because these responses are quick, and a fast monitoring is necessary to follow the scene of interest. This asserts the need for SR monitoring in nano-bio-manipulation and this combination of STED AFM for cellular level manipulation. 3.3.Precise ManipulationA different cell type was labeled with Abberior star 635 is visualized, and a filament is moved (refer to Fig. 7). Note that this cell was immunostained as per the methanol fixation protocol33 for avoiding the membrane stopping from direct interaction with the microtubules. Although this experiment is a proof of principle, this can be possibly extended to physiological samples labeled with good fluorescent dyes that work for labeling structures in live cell for STED imaging. Figure 7 shows the STED recording of an area of interest, where a single microtubule is broken by the sheer force applied by the AFM. Fig. 7Cutting a microtubule: The live monitoring with STED AFM allows you to do surgeries at nanoscale with a precision determined the localization of tip seen by STED AFM. In this video, a single tubule is cut by the AFM tip without interfering nearby tubules or structures with the help of STED SR imaging. (MPEG, 2.55 MB) [URL: http://dx.doi.org/10.1117/1.JBO.19.10.105003.3]. 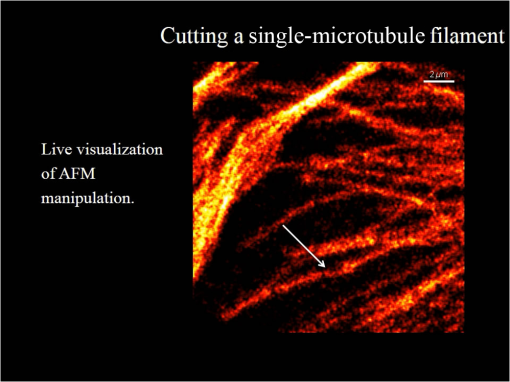 AFM nanomanipulation of living cell and biomolecules is a challenging topic that has emerged in the last decade as one of the most promising approach in the field of biology and nanomedicine. It has been previously demonstrated that by using an AFM probe it is possible to change the fate of individual cell by single cell DNA transfection.36,37 AFM was employed to create selective holes on the cell membrane and to extract single-membrane protein from cell via single-covalent bonds.38 One of the main technical limits to these applications is related to the precise positioning of the AFM probes on the target site and to the capability in terms of monitoring of the manipulation effects. Here, we demonstrate the capacity to achieve an optical localization of the sample with a lateral precision of tens of nanometers working in quasiphysiological environment, together with an improved control of the relative position of the AFM probe on the sample and of the trajectory followed by it during in situ manipulation. This step up significantly decreases the time that is necessary to bring the AFM probe in contact with a target site. Because this is an improvement achieved using an optical microscope, the effect of the manipulation could be monitored also in real time. A combined STED-AFM system can work in liquid on a complex biological system and address manipulation trajectories, incisions, and conduct physical stress stimulus experiments on cells. In particular, we present how the AFM can be used to manipulate a cell with and extremely high precision while an optical microscope looks at the manipulation effect with a resolution that is below the diffraction limit (). This work paves the avenue to a series of new and exciting applications. In particular, working on living cells, it would be possible to induce a stimulus on the cell (mechanical, but also a chemical stimulation by dragging interacting molecule in contact with the cell/molecule) looking at the response in real-time. The AFM could operate on single-cell compartments or molecules; for example cutting single filaments of the cytoskeleton or releasing molecules in cell nucleus or in other more localized part of the cell. 4.ConclusionTargeted manipulation assisted with SR fluorescent image is a newly endowed capability, among nanomanipulation systems. Any lab with a working multiphoton microscope can build such a nanomanipulation system by coupling an AFM and following the protocol given for building STED. Other contemporary methods to achieve this biomanipulation include environmental scanning electron microscope nanomanipulation units, electrical force-based micromanipulation,39 optical and laser tweezers,40 acoustophoresis, etc.41–43 These methods can be applied to single proteins stripped from the cell44 or even on living cells.45 For AFM-based manipulation, many nanorobotics groups use a fast AFM rendering for monitoring the manipulation. However, unlike in a material sample, biological samples and elastic samples show fast responses, and real-time monitoring is very important. Designing these experiments in bacteria and live cells may reveal decision-making processes under a force stimulus. Another existing option for SR-aided AFM imaging is STORM-AFM,46 which can work for even molecular level dimensions. STORM-AFM lacks speed but supports high precision algorithms and molecular tracking while STED AFM gives live high resolution monitoring.26 Another prospect of this system is to move into thicker and different cells to understand cellular behaviors as well as to characterize cellular surfaces with force maps to test its pathogenicity level. The genome-based research for chromosome dissection can be extended to the cellular level with these advancements. An integrated technique such as STED AFM provides a unique dataset that opens new doors in visualizing the nanoworld in a different way, and this protocol helps one to implement such a powerful technique. AcknowledgmentsThe authors acknowledge Dr. Marta d’Amora and Dr. Francesca Cella Zanacchi for necessary aid in immunostaining. The authors thank Dr. Luca Lanzano for reading the initial drafts of the manuscript. The authors also thank Dr. Giuseppe Vicidomini and Dr. Paolo Bianchinni for fruitful discussions. ReferencesJ. CastilloM. DimakiW. E. Svendsen,
“Manipulation of biological samples using micro and nano techniques,”
Integr. Biol., 1
(1), 30
–42
(2009). http://dx.doi.org/10.1039/b814549k IBNIFL 1757-9694 Google Scholar
C. Bauret al.,
“Nanoparticle manipulation by mechanical pushing: underlying phenomena and real-time monitoring,”
Nanotechnology, 9
(4), 360
–364
(1998). http://dx.doi.org/10.1088/0957-4484/9/4/011 NNOTER 0957-4484 Google Scholar
A. Requicha,
“Nanomanipulation with the atomic force microscope,”
Nanotechnology, 3
(8), 239
–273
(2008). http://dx.doi.org/10.1002/9783527628155.nanotech027 NNOTER 0957-4484 Google Scholar
G. BinnigH. Rohrer,
“Scanning tunneling microscopy—from birth to adolescence (Nobel Lecture),”
Angew. Chem. Int. Ed. Engl., 26
(7), 606
–614
(1987). http://dx.doi.org/10.1002/(ISSN)1521-3773 ACIEF5 1433-7851 Google Scholar
F. J. Giessibl,
“Advances in atomic force microscopy,”
Rev. Mod. Phys., 75
(3), 949
–983
(2003). http://dx.doi.org/10.1103/RevModPhys.75.949 RMPHAT 0034-6861 Google Scholar
H. J. ButtB. CappellaM. Kappl,
“Force measurements with the atomic force microscope: technique, interpretation and applications,”
Surf. Sci. Rep., 59
(1–6), 1
–152
(2005). http://dx.doi.org/10.1016/j.surfrep.2005.08.003 SSREDI 0167-5729 Google Scholar
C. Canaleet al.,
“Force spectroscopy as a tool to investigate the properties of supported lipid membranes,”
Microsc. Res. Tech., 73
(10), 965
–972
(2010). http://dx.doi.org/10.1002/jemt.v73:10 MRTEEO 1059-910X Google Scholar
C. RotschM. Radmacher,
“Drug-induced changes of cytoskeletal structure and mechanics in fibroblasts: an atomic force microscopy study,”
Biophys. J., 78
(1), 520
–535
(2000). http://dx.doi.org/10.1016/S0006-3495(00)76614-8 BIOJAU 0006-3495 Google Scholar
P. M. Williamset al.,
“Hidden complexity in the mechanical properties of titin,”
Nature, 422
(6930), 446
–449
(2003). http://dx.doi.org/10.1038/nature01517 NATUAS 0028-0836 Google Scholar
J. V. Chackoet al.,
“Sub-diffraction nano manipulation using STED AFM,”
PLoS ONE, 8
(6), e66608
(2013). http://dx.doi.org/10.1371/journal.pone.0066608 1932-6203 Google Scholar
F. LandolsiF. H. GhorbelJ. B. Dabney,
“Adhesion and friction coupling in atomic force microscope-based nanopushing,”
J. Dyn. Syst. Meas. Control, 135
(1), 011002
(2013). http://dx.doi.org/10.1115/1.4006370 JDSMAA 0022-0434 Google Scholar
S. W. HellJ. Wichmann,
“Breaking the diffraction resolution limit by stimulated emission: stimulated-emission-depletion fluorescence microscopy,”
Opt. Lett., 19
(11), 780
–782
(1994). http://dx.doi.org/10.1364/OL.19.000780 OPLEDP 0146-9592 Google Scholar
D. Fotiadiset al.,
“Imaging and manipulation of biological structures with the AFM,”
Micron, 33
(4), 385
–397
(2002). http://dx.doi.org/10.1016/S0968-4328(01)00026-9 MICNB2 0047-7206 Google Scholar
S. Thalhammeret al.,
“The atomic force microscope as a new microdissecting tool for the generation of genetic probes,”
J. Struct. Biol., 119
(2), 232
–237
(1997). http://dx.doi.org/10.1006/jsbi.1997.3869 JSBIEM 1047-8477 Google Scholar
W. KalleP. Strappe,
“Atomic force microscopy on chromosomes, chromatin and DNA: a review,”
Micron, 43
(12), 1224
–1231
(2012). http://dx.doi.org/10.1016/j.micron.2012.04.004 MICNB2 0047-7206 Google Scholar
M. BaclayonG. J. L. WuiteW. H. Roos,
“Imaging and manipulation of single viruses by atomic force microscopy,”
Soft Matter., 6
(21), 5273
–5285
(2010). http://dx.doi.org/10.1039/b923992h 1744-683X Google Scholar
J. Huet al.,
“Nanomanipulation of single DNA molecules and its applications,”
Surf. Interface Anal., 36
(2), 124
–126
(2004). http://dx.doi.org/10.1002/(ISSN)1096-9918 SIANDQ 0142-2421 Google Scholar
J. V. ChackoF. C. ZanacchiA. Diaspro,
“Probing cytoskeletal structures by coupling optical superresolution and AFM techniques for a correlative approach,”
Cytoskeleton, 70
(11), 729
–740
(2013). http://dx.doi.org/10.1002/cm.v70.11 CYTOBO 1949-3584 Google Scholar
S. W. HellJ. Wichmann,
“Breaking the diffraction resolution limit by stimulated emission: stimulated-emission-depletion fluorescence microscopy,”
Opt. Lett., 19
(11), 780
–782
(1994). http://dx.doi.org/10.1364/OL.19.000780 OPLEDP 0146-9592 Google Scholar
S. W. Hell,
“Fluorescence nanoscopy: breaking the diffraction barrier by the RESOLFT concept,”
Nanobiotechnology, 1
(3), 296
–297
(2005). http://dx.doi.org/10.1007/s12030-005-0048-2 1551-1294 Google Scholar
V. WestphalL. KastrupS. W. Hell,
“Lateral resolution of 28 nm () in far-field fluorescence microscopy,”
Appl. Phys. B Lasers Opt., 77
(4), 377
–380
(2003). http://dx.doi.org/10.1007/s00340-003-1280-x APBOEM 0946-2171 Google Scholar
B. Harkeet al.,
“Resolution scaling in STED microscopy,”
Opt. Express, 16
(6), 4154
–4162
(2008). http://dx.doi.org/10.1364/OE.16.004154 OPEXFF 1094-4087 Google Scholar
Optical Fluorescence Microscopy: From the Spectral to the Nano Dimension, 1st ed.Springer, Berlin, Heidelberg
(2010). Google Scholar
K. I. Williget al.,
“STED microscopy with continuous wave beams,”
Nat. Methods, 4
(11), 915
–918
(2007). http://dx.doi.org/10.1038/nmeth1108 1548-7091 Google Scholar
G. Donnertet al.,
“Two-color far-field fluorescence nanoscopy,”
Biophys. J., 92
(8), L67
–L69
(2007). http://dx.doi.org/10.1529/biophysj.107.104497 BIOJAU 0006-3495 Google Scholar
U. V. Nägerlet al.,
“Live-cell imaging of dendritic spines by STED microscopy,”
Proc. Natl. Acad. Sci. U. S. A., 105
(48), 18982
(2008). http://dx.doi.org/10.1073/pnas.0810028105 PMASAX 0096-9206 Google Scholar
P. Bianchiniet al.,
“Single-wavelength two-photon excitation-stimulated emission depletion (SW2PE-STED) superresolution imaging,”
Proc. Natl. Acad. Sci. U. S. A., 109
(17), 6390
–6393
(2012). http://dx.doi.org/10.1073/pnas.1119129109 PMASAX 0096-9206 Google Scholar
G. Vicidominiet al.,
“Sharper low-power STED nanoscopy by time gating,”
Nat. Methods, 8
(7), 571
–573
(2011). http://dx.doi.org/10.1038/nmeth.1624 1548-7091 Google Scholar
E. RonzittiB. HarkeA. Diaspro,
“Frequency dependent detection in a STED microscope using modulated excitation light,”
Opt. Express, 21
(1), 210
–219
(2013). http://dx.doi.org/10.1364/OE.21.000210 OPEXFF 1094-4087 Google Scholar
A. DiasproG. ChiricoM. Collini,
“Two-photon fluorescence excitation and related techniques in biological microscopy,”
Q. Rev. Biophys., 38
(02), 97
–166
(2005). http://dx.doi.org/10.1017/S0033583505004129 QURBAW 0033-5835 Google Scholar
S. Galianiet al.,
“Strategies to maximize the performance of a STED microscope,”
Opt. Express, 20
(7), 7362
–7374
(2012). http://dx.doi.org/10.1364/OE.20.007362 OPEXFF 1094-4087 Google Scholar
M. LeuteneggerC. EggelingS. W. Hell,
“Analytical description of STED microscopy performance,”
Opt. Express, 18
(25), 26417
–26429
(2010). http://dx.doi.org/10.1364/OE.18.026417 OPEXFF 1094-4087 Google Scholar
C. A. Wurmet al.,
“Sample preparation for STED microscopy,”
Methods Mol. Biol. Clifton NJ, 591 185
–199
(2010). http://dx.doi.org/10.1007/978-1-60761-404-3 MMBIED 0097-0816 Google Scholar
J. Yuet al.,
“Nanoscale imaging with an integrated system combining stimulated emission depletion microscope and atomic force microscope,”
Chin. Sci. Bull., 58
(33), 4045
–4050
(2013). http://dx.doi.org/10.1007/s11434-013-6011-z CSBUEF 1001-6538 Google Scholar
R. Zanellaet al.,
“Towards real-time image deconvolution: application to confocal and STED microscopy,”
Sci. Rep., 3 1
–8
(2013). http://dx.doi.org/10.1038/srep02523 SRCEC3 2045-2322 Google Scholar
O. Guillaume-Gentilet al.,
“Force-controlled fluidic injection into single cell nuclei,”
Small, 9
(11), 1904
–1907
(2013). http://dx.doi.org/10.1002/smll.v9.11 1613-6829 Google Scholar
R. Afrinet al.,
“Atomic force microscopy for cellular level manipulation: imaging intracellular structures and DNA delivery through a membrane hole,”
J. Mol. Recognit., 22
(5), 363
–372
(2009). http://dx.doi.org/10.1002/jmr.v22:5 JMORE4 1099-1352 Google Scholar
R. Afrinet al.,
“Extraction of membrane proteins from a living cell surface using the atomic force microscope and covalent crosslinkers,”
Cell Biochem. Biophys., 39
(2), 101
–117
(2003). http://dx.doi.org/10.1385/CBB:39:2:101 CBBIFV 1085-9195 Google Scholar
J. Voldman,
“Electrical forces for microscale cell manipulation,”
Annu. Rev. Biomed. Eng., 8
(1), 425
–454
(2006). http://dx.doi.org/10.1146/annurev.bioeng.8.061505.095739 ARBEF7 1523-9829 Google Scholar
F. Difatoet al.,
“Combined optical tweezers and laser dissector for controlled ablation of functional connections in neural networks,”
J. Biomed. Opt., 16
(5), 051306
(2011). http://dx.doi.org/10.1117/1.3560268 JBOPFO 1083-3668 Google Scholar
J. Castillo-LeónW. E. SvendsenM. Dimaki, Micro and Nano Techniques for the Handling of Biological Samples, CRC Press, Boca Raton, Florida
(2011). Google Scholar
D. Fotiadiset al.,
“Imaging and manipulation of biological structures with the AFM,”
Micron, 33
(4), 385
–397
(2002). http://dx.doi.org/10.1016/S0968-4328(01)00026-9 MICNB2 0047-7206 Google Scholar
M. Sitti,
“Survey of nanomanipulation systems,”
in 2001 IEEE-NANO 2001 Proc. 2001 1st IEEE Conf. on Nanotechnology,
75
–80
(2001). Google Scholar
C. Marasiniet al.,
“Visualization of single proteins from stripped native cell membranes: a protocol for high-resolution atomic force microscopy: AFM on single membrane proteins,”
Microsc. Res. Tech., 76
(7), 723
–732
(2013). http://dx.doi.org/10.1002/jemt.v76.7 MRTEEO 1059-910X Google Scholar
G. Liet al.,
“Manipulating nano scale biological specimen in liquid,”
in 2003 IEEE-NANO 2003 Third IEEE Conf. on Nanotechnology,
68
–71
(2003). Google Scholar
J. V. ChackoF. C. ZanacchiA. Diaspro,
“Probing cellular structures by coupling optical super resolution and atomic force microscopy techniques for a correlative approach,”
Cytoskeleton, 70
(11), 729
–740
(2013). http://dx.doi.org/10.1002/cm.21139 Google Scholar
BiographyJenu Varghese Chacko got his PhD degree from the University of Genoa, Italy, on May 3, 2014, for successfully defending his thesis titled “Correlative optical SR methods with AFM.” Benjamin Harke was a group leader in the Nanophysics Department at the Italian Institute of Technology. He is a cofounder of the Abberior Instrument GmbH ( www.abberior-instruments.net), a spin-off from the Max Planck Institute of Biophysical Chemistry in Göttingen and the German Cancer Research Institute in Heidelberg. The company is based in the Laser Laboratorium Göttingen GmbH Technology Park located on the north campus of the University of Göttingen, Germany. Claudio Canale is the head researcher at the scanning probe microscopy facility in the Nanophysics Department of the Italian Institute of Technology (Istituto Italiano di Tecnologia). Alberto Diaspro is currently the director of the Nanophysics Department of the Italian Institute of Technology (IIT), deputy director of IIT, and director of the Nikon Imaging Center at IIT. He is a professor in applied physics at the University of Genova, Italy, and he founded the Laboratory for Advanced Microscopy, Bioimaging and Spectroscopy-LAMBS in 2003. He is a Fellow of SPIE and a senior member of IEEE. |


