
|
|
1.IntroductionLaser irradiation in the visible and near-infrared (NIR) wavelength regions will result in retinal injury when the radiant exposure exceeds a threshold level that varies with exposure duration.1 The primary retinal damage mechanism for exposure to a single pulse in the range of 10 ns to duration is microcavitation, or the formation of small bubbles around the melanosomes in the retinal pigmented epithelium (RPE) cells.2–10 The primary mechanism for exposures longer than a few microseconds is understood to be the thermal denaturation of retinal tissue heated by absorption of the laser radiation within the RPE. In the current laser safety guidelines, the transition between the two injury mechanisms is treated as if it was abrupt and occurred at for visible wavelength lasers and for NIR lasers.11,12 Experimental data show the transition to be more gradual, with injury resulting from microcavitation for a -duration pulse and an increasing contribution from thermal denaturation for longer exposures. Lee et al. determined the thresholds for both laser-induced microcavitation and RPE cell death, and provided evidence that microcavitation was the dominate mechanism for exposure durations up to at least .13 In similar experiments, Schüle et al. provided evidence that microcavitation continued to contribute for exposures.6 It should be noted that both Lee and Schüle performed their studies ex vivo using bovine or porcine retinal explants. The nature of the single-pulse damage mechanism becomes important when considering the additivity of effect for exposures to a train of repetitive pulses. If the time between pulses (inverse of repetition frequency) is longer than the characteristic time of the underlying damage mechanism,14 then each pulse in the exposure can be treated as an isolated event independent of the other pulses in the exposure. Experimental evidence8 suggests that when the injury mechanism is microcavitation, the pulses act independently. The dependence of the injury threshold upon the number of pulses is then well described by the probability summation (PS) model of Menendez et al.15–17 For this injury mechanism, the cumulative threshold is dependent only on the number of pulses in the exposure and is independent of the pulse repetition frequency (PRF). When the injury mechanism is thermal denaturation, the pulses do interact, with the peak temperature for each pulse being affected by the residual temperature contributed by all preceding pulses.18 Because the residual temperature is affected by thermal diffusion during the interpulse interval, the cumulative threshold is dependent both upon the number of pulses in the exposure and upon the PRF. Repetitive-pulse studies offer a method for experimentally investigating the threshold-level damage mechanism for retinal laser exposure. Single-pulse data suggest that the pulse duration is in the transition between microcavitation and thermal damage mechanisms. This paper reports a study to obtain experimental data in vivo for repetitive-pulse exposures to -duration pulses at PRFs of 50 and 1000 Hz. 2.Methods2.1.SubjectsThe for multiple-pulse exposure to -duration pulses at was measured in the macular region of the retina of Rhesus macaques (Macaca mulata). This study was conducted in compliance with the Animal Welfare Act, the implementing Animal Welfare Regulations, and the principles of the Guide for the Care and Use of Laboratory Animals. All experiments involving animals used appropriate levels of anesthesia so that the subjects did not experience pain or distress. Prior to selection for use in the study, subject animals were screened for normal retina and clear ocular media and were required to have a refractive error diopters from emmetropia. In preparation for laser exposure, each animal was sedated using an intramuscular injection of Telazol. A subcutaneous injection of Atropine Sulfate was given for control of excessive salivation and bronchial secretions. Anesthesia was then induced using an intravenous administration of propofol. An intravenous line of Lactated Ringer’s solution was placed for fluid resuscitation. A retrobulbar injection of 4% lidocaine was used in the exposed eye to reduce ocular motion during the exposures. Cycloplegia and pupil dilation were induced using two drops of 0.5% proparacaine hydrochloride, 2.5% phenylephrine hydrochloride, and 1% tropicamide. A lid speculum held the eye open for exposure. The cornea was periodically irrigated with a 0.9% saline solution to maintain clarity. 2.2.Exposure SetupThe experimental setup used to produce minimal spot size and extended diameter retinal exposures in the eye of a rhesus macaque is illustrated in Fig. 1. A Coherent Verdi G10 Diode-Pumped Solid-State laser (Coherent, Santa Clara, California, USA) produced continuous-wave laser radiation at a wavelength of 532 nm. The beam was focused onto the plane of a Bentham Instruments Model 218 optical chopper (Bentham Instruments Ltd., Reading, United Kingdom) set up with two interleaved chopping blades to produce square-wave -duration pulses at a PRF of either 50 or 1000 Hz. A timing shutter determined the total exposure time and, therefore, the total number of pulses. Fig. 1Experimental setup. ND, frequency-doubled, continuous wave laser (). FL, focusing lens; RL, recollimating lens; OC, optical chopper; BS, brick shutter; TS, timing shutter; NDF, neutral density filters; IR, variable aperture; WBS, glass wedge beam splitter; MB, marker beam path; PC, pulse counter; OS, oscilloscope; EM, energy meter; PI, pulse integrator; FC: fundus camera; M, movable mirror.  A wedge beam splitter deflected portions of the beam into detectors to measure the pulse width and count the number of pulses. Pulse width was measured with a UDT Instruments model 247 detector (UDT Instruments, San Diego, California, USA) coupled to a Tektronix TDS3045C oscilloscope (Tektronix, Beaverton, Oregon, USA). Figure 2 shows a typical pulse temporal profile produced by the beam chopper. Pulse rate and total number of pulses were measured using a UDT Instruments model 248 detector and a Hewlett-Packard model 5316B Universal Counter (Hewlett-Packard, Palo Alto, California, USA). Fig. 2Typical temporal profile for the pulses for the beam having a 1000 Hz pulse repetition frequency. (a) A single pulse. (b) Average of 16 pulses. 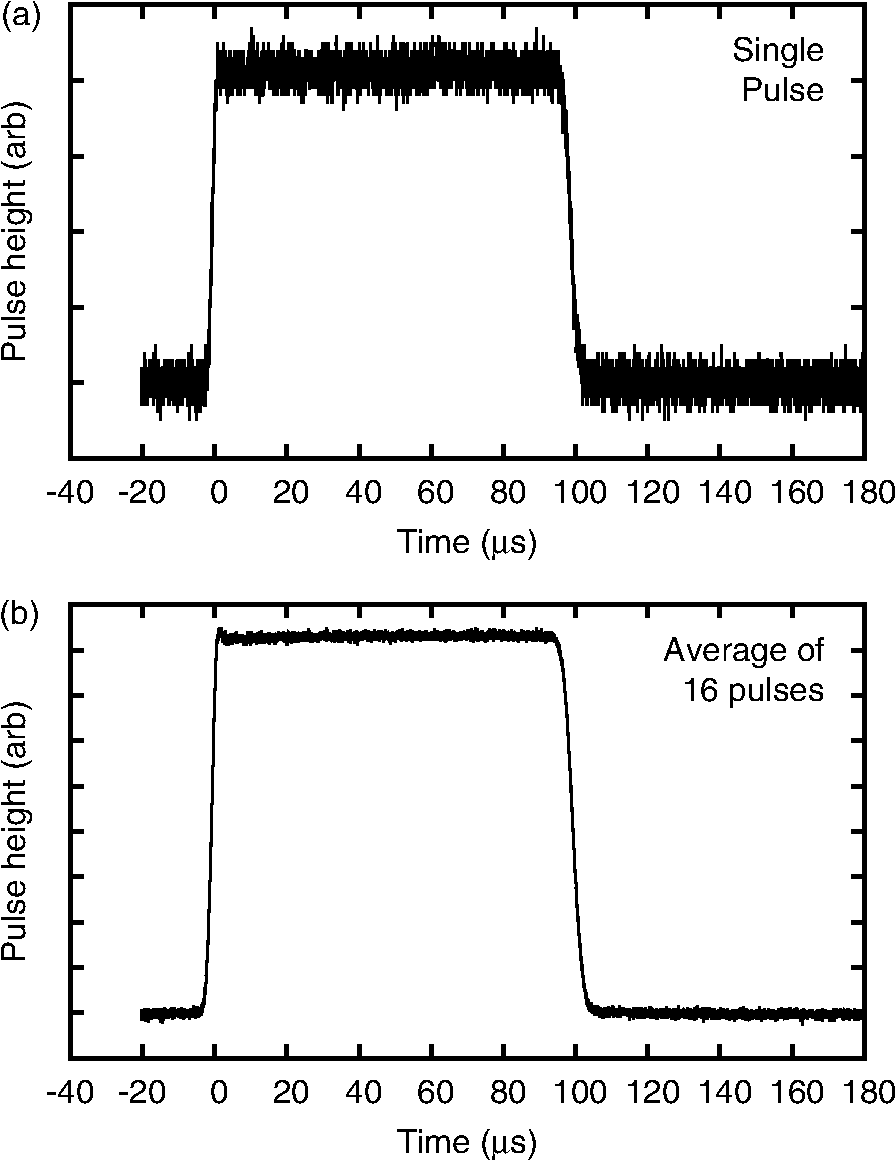 A second wedge beam splitter deflected portions of the beam into detectors to measure the pulse energy. For single-pulse exposures, a Laser Probe RjP-765a detector (Laser Probe Inc., Utica, New York, USA) read out by a Laser Probe Rj-7620 Dual Channel Energy Meter was used to measure the pulse energy in the reference beam. Prior to exposing a retina, a Laser Probe RjP-735 detector was placed at the eye position to measure the energy incident to the eye. The ratio of the two measurements was used to calibrate the exposure system for single-pulse exposures. For multiple-pulse exposures, an International Light Technologies SED033 detector (International Light Technologies, Peabody, Massachusetts, USA) read out by an IL1700 pulse integrator was used to measure the total energy in the reference beam. This system was calibrated by placing a Scientech model 380101 detector (Scientech, Boulder, Colorado, USA) read out by a Scientech model 36-5002T2 power meter placed at the eye position prior to retinal exposures. The central, uniform portion of the beam was selected using an adjustable aperture (labeled IR in Fig. 1). For extended retinal beam spot exposures, a 400 mm focal length lens (LNS in Fig. 1) was inserted into the setup to bring the beam to a focus some distance in front of the eye, so that the beam was diverging as it entered the eye. The diameter of the aperture IR was adjusted so that the beam divergence was 7.4 mrad, producing a -diameter top-hat retinal beam spot in the macaque retina (). The divergence of the beam was verified using a WinCamD-UCD12 CCD camera (DataRay Inc., Bella Vista, California, USA) placed at the focal plane of a 200 mm focal length lens. Lens LNS was removed for collimated beam exposures. The beam diameter at the cornea was 3 mm for both exposure conditions. Neutral density filters were used to attenuate the beam, determining the pulse energy for each exposure. Moveable mirrors (M) were inserted into the beam path (MB) to bypass the optical chopping system for placing marker lesions into the eye. Lens LNS was removed to provide a collimated beam of 40 mW and 100 ms pulse duration to induce marker lesions. 2.3.ProcedureThe laser-induced retinal injury threshold was measured for exposures to a collimated laser beam, leading to a minimal retinal spot size exposure, and for a beam having a 7.4 mrad divergence. Assuming an effective focal length for the macaque eye of , the diverging beam produced a top-hat retinal beam spot having a irradiance diameter of . The laser-induced retinal injury threshold was measured for PRFs of 50 and 1000 Hz. At the slower PRF (50 Hz), the injury threshold was measured for pulse trains of up to pulses (a 10-s exposure). The threshold was measured for pulse trains of up to 1000 pulses (a 1-s exposure) for the higher PRF (1000 Hz). Data from at least three eyes were used to determine the from each exposure condition, defined by the PRF, beam divergence, and number of pulses. A series of marker lesions were placed around the macula to define a test exposure grid within the macula and to aid in locating the exposure sites during subsequent examination of the retina. The laser was used to produce the markers, using the beam path bypassing the beam chopper (Fig. 1). Twenty-five sites were exposed within the macular of each eye. The pulse energy was varied from site to site, although all pulses were identical within a given exposure. Exposure sites were nominally evaluated 24 h after exposure. Retinas were photographed using a digital fundus camera and were examined visually using an ophthalmoscope. The response criterion was defined as any ophthalmoscopically visible alteration of the retina at the exposure site. Dose-response data for 35 to 70 exposures were collected for each exposure condition. Probit analysis19,20 was used to extract an from each dose-response data set. The is defined to be the dose at which there is a 50% probability of producing a detectable retinal alteration. The dose is given as the total intraocular energy (TIE), which is the energy incident on the cornea that passes through the pupil of the eye. TIE is expressed in this paper as the energy per pulse in the pulse train. 3.ResultsThe thresholds obtained for the 24-h postexposure endpoint are listed in Table 1 for the collimated beam exposures and in Table 2 for the retinal beam spot exposures. The is expressed as the energy per pulse incident at the cornea. The tables include 95% confidence limits on the , the ratio , and the slope of the probit fit. In some cases, the data were not sufficient to determine the 95% limits or slope. This was due to insufficient overlap between the dose region of positive response (lesions) and the dose region of negative response (no lesion), preventing the probit analysis from determining an accurate slope. To correct this would have required more animal subjects than were available for this study. Note that the slope of the probit fit and the standard deviation σ of the log-normal dose-response probability distribution are related through .20 Table 1ED50 measured for exposure to a collimated beam of 100-μs-duration pulses at λ=532 nm. 95% confidence limits (CLs) on the ED50 are given in parentheses. A “–” indicates data insufficient to obtain CLs.
Table 2ED50 measured for exposure to a 7.4-mrad divergent beam of 100-μs-duration pulses at λ=532 nm. Retinal beam spot diameter is 100 μm. 95% CLs on the ED50 are given in parentheses. A “–” indicates data insufficient to obtain CLs.
The for the divergent beam for at is low by a factor of about two compared to the trend of the other points. This can happen if one or more of the eyes used for that exposure condition were somewhat more susceptible to laser injury than the average of the eyes used for other exposure conditions. Variability from eye-to-eye is inescapable in these studies. Given sufficient resources, the effects of the variability can be averaged out by adding more eyes to each exposure condition. Resources were limited in this study. Figure 3 shows plots of the measured versus the number of pulses for both the collimated beam exposures and the divergent beam exposures. 4.Discussion4.1.Threshold-Level Damage MechanismThe values reported here for repetitive-pulse exposures to -duration pulses are very nearly identical for the two pulse repetition frequencies, 50 and 1000 Hz (Fig. 3). In Fig. 4, PS model predictions based on the experimentally determined single-pulse and probit slope are compared to the experimental data.17 The data are well described by the PS model curves. Thermal models have not shown that the mechanism of thermal denaturation can lead to a condition wherein the , expressed as energy per pulse, can be independent of the interpulse spacing (PRF). The observed result that for -duration pulses the expressed as energy per pulse is independent of the interpulse spacing (PRF) for two widely separated frequencies supports a conclusion that the threshold-level damage mechanism for exposure to single -duration pulses is microcavitation. Fig. 4Comparison of probability summation (PS) model calculations with the experimentally measured for repetitive-pulse exposures to pulses at . The PS calculations are based on the experimentally determined single-pulse and probit slope. (a) Collimated beam (minimal retinal beam spot). (b) retinal beam spot.  Thermal retinal injury models predict a significant difference in the versus number of pulses for PRFs of 50 and 1000 Hz. In Fig. 5, threshold predictions from the thermal model of Jean and Schulmeister21,22 are compared to the experimentally measured values. The thermal model prediction for a 1000 Hz PRF conforms reasonably well to the data. However, the model provides poor prediction for the 50 Hz PRF data (Fig. 5). Differences in the model predictions for the two PRFs arise essentially from the cooling that can or cannot occur during the interpulse periods. At the lower PRF (50 Hz), the model retina has enough time to cool to its original baseline temperature through thermal diffusion to surrounding tissue. At the higher PRF (1000 Hz), there is insufficient time for thermal diffusion to cool the tissue back to the baseline temperature, and subsequent pulses hit tissue at an already elevated temperature, further increasing the temperature and, thus, the tissue damage rate.18,23 Fig. 5Comparison of thermal model calculations with the experimentally measured for repetitive-pulse exposures to pulses at . (a) Collimated beam (minimal retinal spot size). (b) retinal beam spot diameter.  It is argued that when the dominant damage mechanism for a threshold-level exposure to pulses is microcavitation, the expressed as energy per pulse depends only on the number of pulses and is independent of the PRF. When the dominant damage mechanism for a threshold-level exposure to pulses is thermal, the is dependent upon both and the PRF, and, in fact, becomes lower as the PRF is increased. It follows that in the case that the dominant mechanism for the single-pulse injury is microcavitation, the expressed as the energy pulse will be independent of the PRF for low frequencies, but at higher PRF, the cumulative pulse thermal damage contribution may become dominant and the for pulses expressed as energy per pulse will drop below the constant value predicted by the probability summation model. It further follows that, in this case, there will be a PRF wherein the can be equally well explained by both the microcavitation model and the thermal denaturation model. The data of this experiment for a PRF of 1000 Hz are equally well described by both the thermal model and the PS model. The data for 50-Hz exposures are poorly described by the thermal model but are well described by the PS model. It is, therefore, reasonable to conjecture that for exposure to -duration pulses, the microcavitation threshold-level damage mechanism dominates for , while the thermal denaturation injury mechanism dominates for . At 1000 Hz, thermal denaturation occurs at near the same level that microcavitation occurs. Data for a higher PRF are needed to clarify this conjecture. If there is a crossover between threshold-level injury mechanisms, an experiment performed at a higher pulse repetition rate, say 2000 Hz, should result in a thermal injury at a lower threshold. Figure 6 compares the single-pulse data of this paper to data from the literature4,6–8,10,13,24 and shows the transition between the temporal domain of microcavitation-dominated threshold retinal injury and the temporal domain of thermal denaturation-dominated threshold retinal injury. The predicted by thermal models of laser-induced RPE injury is included for comparison.25 The bubble formation and cell death data, obtained via ex vivo exposures in retinal explants, show that RPE cell death correlates well with the observation of microcavitation for exposure durations , while for exposures to , cell death occurs at radiant exposures lower than that required to produce microcavitation. The transition from microcavitation as the dominant threshold-level injury mechanism to thermal denaturation appears to occur between 50 μs and . The in vivo threshold data for exposures to extended sources (nominally 5 mrad visual angle) are included in this plot as the retinal image diameters are more accurately known for these data.26–28 The in vivo data for a 24-h ophthalmoscopically visible endpoint lie consistently below the ex vivo data; however, it should be noted that the ocular transmission was set to one when calculating the retinal radiant exposure. The trend of the in vivo data follows that of the ex vivo data. This indicates that microcavitation cannot be excluded as a threshold injury mechanism for single-pulse -duration exposures. Fig. 6The for laser-induced retinal injury (retinal radiant exposure) as a function of exposure duration. Open squares and closed triangles are ex vivo data. Microcavitation (bubble formation) correlates with cell death for exposure duration but occurs at higher radiant exposure for durations . In vivo data are for extended source exposures. Twenty-four-hour data follow a trend similar to the ex vivo data. The line is the predicted by thermal models of laser-induced retinal pigmented epithelium injury.  4.2.Maximum Permissible Exposure for Repetitive-Pulse ExposuresIn Fig. 7, the maximum permissible exposure (MPE) levels for repetitive-pulse exposures for pulses defined in the current ANSI Z136.1-2014 (Ref. 11) and the old ANSI Z136.1-2007 (Ref. 29) are compared to the experimental data obtained in this study. For this comparison, the MPE, given in the guidelines as the corneal irradiance (), was multiplied by the area of a 7-mm pupil to give the allowable TIE. is a multiplicative correction factor applied to the single-pulse MPE to determine the exposure limit for an exposure to pulses. In the ANSI Z136.1-2007, the correction factor was set as for all repetitive-pulse exposures.29 As can be seen in Fig. 7(a), for collimated beam exposures to pulses, this resulted in a safety factor of for a single-pulse exposure, which increased as the number of pulses increased. In the current ANSI Z136.1-2014, the correction factor has been set to for all collimated beam exposures.11 The data for this experiment indicate that this continues to afford an adequate safety factor for large . Fig. 7Comparison of maximum permissible exposure (MPE) limits for repetitive-pulse exposures to -duration pulses at with the data of this study. The solid curve is the MPE published in the 2014 edition of the ANSI Z136.1. The dashed curve is the MPE from the 2007 edition of the ANSI Z136.1. (a) Collimated beam (minimal retinal spot size). (b) retinal beam spot diameter, corresponding to a source angular subtense in the human eye.  In the human eye (effective focal length ), a -diameter retinal beam spot size is produced when the divergence of the incident beam is 5.9 mrad. For a single -duration exposure, the MPE promulgated in the ANSI Z136.1-2014 is slightly higher than the MPE published in the 2007 version.11,29 As seen in Fig. 7(b), both versions provide an adequate safety factor of for a single -duration exposure. But setting as is done for collimated beam exposures in the 2014 standard would result in a safety factor of only 2 for pulses. For a beam having a divergence of 5.9 mrad, the ANSI Z136.1-2014 has defined for up to pulses, and for pulses. This results in a safety factor that continues to be adequate for exposures to a large number of pulses. 5.ConclusionThis paper reports laser-induced retinal injury thresholds for repetitive-pulse exposure to -duration pulses at repetition rates of 50 and 1000 Hz at a wavelength of 532 nm. The for exposures to pulse was found to be independent of the PRF for pulse rates up to 1000 Hz. The data were described well by the PS model of Menendez, et al.15 This is strong evidence that the threshold-level damage mechanism for single-pulse -duration retinal exposures is microcavitation. The MPE values published in the most recent laser safety standards11,12 were compared to the data and found to provide an adequate safety factor for repetitive-pulse retinal laser exposures to -duration pulses. AcknowledgmentsKarl Schulmeister, from Seibersdorf Research Laboratories, Austria, kindly provided the thermal model calculations. We thank André Akers from the Army Institute of Surgical Research, Ocular Trauma Research Group, and Carrie Crane and Bryanna Derderian from the Naval Medical Research Unit of San Antonio for their help in conducting this study. Thanks to Benjamin Rockwell of the Air Force Research Laboratory, Optical Radiation Bioeffects Branch for providing laboratory space to conduct this study. ReferencesD. J. Lund,
“The new maximum permissible exposure: a biophysical basis,”
Laser Safety: Tools and Training, 145
–175 CRC Press, Boca Raton
(2014). Google Scholar
B. S. Gerstmanet al.,
“Laser induced bubble formation in the retina,”
Lasers Surg. Med., 18
(1), 10
–21
(1996). http://dx.doi.org/10.1002/(ISSN)1096-9101 LSMEDI 0196-8092 Google Scholar
B. Gerstman,
“Theoretical modeling of laser-induced explosive pressure generation and vaporization in pigment cells,”
Proc. SPIE, 3902 41
–53
(2000). http://dx.doi.org/10.1117/12.379340 PSISDG 0277-786X Google Scholar
R. Brinkmannet al.,
“Origin of retinal pigment epithelial cell damage by pulsed laser irradiance in the nanosecond to microsecond time regimen,”
Lasers Surg. Med., 27
(5), 451
–464
(2000). http://dx.doi.org/10.1002/(ISSN)1096-9101 LSMEDI 0196-8092 Google Scholar
G. Schüleet al.,
“Optoacoustic control system for selective treatment of the retinal pigment epithelium,”
Proc. SPIE, 4256 71
–76
(2001). http://dx.doi.org/10.1117/12.429323 PSISDG 0277-786X Google Scholar
G. Schüleet al.,
“RPE damage thresholds and mechanisms for laser exposure in the microsecond-to-millisecond time regimen,”
IOVS, 46
(2), 714
–719
(2005). http://dx.doi.org/10.1167/iovs.04-0136 IOVSDA 0146-0404 Google Scholar
C. Altet al.,
“Monitoring intracellular cavitation during selective targeting of the pigment epithelium,”
Proc. SPIE, 4951 48
–55
(2003). http://dx.doi.org/10.1117/12.477956 PSISDG 0277-786X Google Scholar
J. RoegenerR. BrinkmannC. P. Lin,
“Pump-probe detection of laser induced microbubble formation in retinal pigment epithelium cells,”
J. Biomed. Opt., 9
(2), 367
–371
(2004). http://dx.doi.org/10.1117/1.1646413 JBOPFO 1083-3668 Google Scholar
M. W. KellyC. P. Lin,
“Microcavitation and cell injury in RPE cells following short-pulsed laser irradiation,”
Proc. SPIE, 2975 174
–179
(1997). http://dx.doi.org/10.1117/12.275473 PSISDG 0277-786X Google Scholar
M. W. Kelly,
“Intracellular cavitation as a mechanism of short-pulse laser injury to the retinal pigment epithelium,”
Tufts University,
(1997). Google Scholar
American National Standard for Safe Use of Lasers Z136.1-2014, Orlando
(2014). Google Scholar
“Guidelines on limits of exposure to laser radiation of wavelengths between 180 nm and 1000 nm,”
Health Phys., 105
(3), 271
–295
(2013). HLTPAO 0017-9078 Google Scholar
H. Leeet al.,
“Optical detection of intracellular cavitation during selective laser targeting of the retinal pigment epithelium: dependence of cell death mechanism on pulse duration,”
J. Biomed. Opt., 12
(6), 064034
(2007). http://dx.doi.org/10.1117/1.2804078 JBOPFO 1083-3668 Google Scholar
J. M. SunB. S. GerstmanB. Li,
“Bubble dynamics and shock waves generated by laser absorption of a photoacoustic sphere,”
J. Appl. Phys., 88
(2), 2353
–2362
(2000). http://dx.doi.org/10.1063/1.1288507 JAPIAU 0021-8979 Google Scholar
A. R. Menendezet al.,
“Probability-summation model of multiple laser-exposure effects,”
Health Phys., 65
(5), 523
–528
(1993). http://dx.doi.org/10.1097/00004032-199311000-00008 HLTPAO 0017-9078 Google Scholar
D. J. LundD. Sliney,
“A new understanding of multiple-pulsed laser-induced retinal injury thresholds,”
Health Phys., 106
(4), 505
–515
(2014). http://dx.doi.org/10.1097/HP.0b013e3182a2a837 HLTPAO 0017-9078 Google Scholar
B. J. LundD. J. LundP. R. Edsall,
“Damage threshold from large retinal spot size repeitive-pulse laser exposures,”
Health Phys., 107
(4),
(2014). http://dx.doi.org/10.1097/HP.0000000000000121 HLTPAO 0017-9078 Google Scholar
K. SchulmeisterM. Jean,
“Manifestation of the strong non-linearity of thermal injury,”
in Proc. of the Int. Laser Safety Conf.,
201
–204
(2011). Google Scholar
D. J. Finney, Probit Analysis, Cambridge University Press, New York
(1971). Google Scholar
B. J. Lund,
“The probit fit program to analyze data from laser damage threshold studies,”
(2006). Google Scholar
M. JeanK. Schulmeister,
“Validation of a computer model to predict laser induced thermal injury thresholds of the retina,”
in Proc. of the Int. Laser Safety Conf.,
229
–238
(2013). Google Scholar
B. J. Lund,
“Laser retinal thermal damage threshold: impact of small scale ocular motion,”
J. Biomed. Opt., 11
(5), 064033
(2006). http://dx.doi.org/10.1117/1.2393091 JBOPFO 1083-3668 Google Scholar
K. Schulmeisteret al.,
“Ex vivo and computer model study on retinal thermal laser-induced damage in the visible wavelength range,”
J. Biomed. Opt., 13
(5), 054038
(2008). http://dx.doi.org/10.1117/1.2982526 JBOPFO 1083-3668 Google Scholar
K. SchulmeisterF. EdthoferB. Seiser,
“Modelling of the laser spot size dependence of retinal thermal damage,”
in ILSC 2005,
48
–57
(2005). Google Scholar
D. J. Lundet al.,
“Variation of laser-induced retinal injury with retinal irradiated area: 0.1 s, 514 nm exposures,”
J. Biomed. Opt., 12
(2), 024023
(2007). http://dx.doi.org/10.1117/1.2714810 JBOPFO 1083-3668 Google Scholar
B. J. LundD. J. LundM. L. Holmes,
“Retinal damage thresholds in the 1 ns to 100 ns exposure duration range,”
in Proc. of ILSC,
183
–186
(2011). Google Scholar
J. A. Zuclichet al.,
“New data on the variation of laser-induced retinal damage threshold with retinal image size,”
JLA, 20
(2), 83
–88
(2008). http://dx.doi.org/10.2351/1.2900536 JLAPEN 1042-346X Google Scholar
American National Standard for Safe Use of Lasers, Z136.1-2007,
(2007). Google Scholar
BiographyBrian J. Lund, PhD, has conducted research on the effects of laser irradiation on ocular tissue for over a decade for the purpose of establishing safe exposure limits. He is a member of several ANSI Z136 subcommittees. David J. Lund has actively engaged in laser-related research and development since graduating from Western Illinois University in 1961. He was one of the original members of the Joint Army Laser Safety Team established in 1968 at the Frankford Arsenal in Philadelphia, Pennsylvania, to study laser bioeffects. His focus for the past 40 years has been on the effect of laser radiation on ocular tissue and the visual system. |


