
|
|
1.IntroductionArthritis is a chronic inflammatory disease characterized by perpetual inflammation of the synovial membrane and extensive angiogenesis, leading to articular cartilage damage, bone erosion, and joint destruction.1 Arthritis is one of the leading causes of disability and is associated with substantial limitation in daily activity, work disability, low quality of life, and high healthcare costs.2,3 Many animal studies4–12 have been performed to find solutions for treating arthritis. Although histology has conventionally been used as a gold standard method to evaluate arthritis through animal studies, it has some drawbacks, such as (1) sacrificing animals given the invasive methods; (2) difficulty of continuous monitoring of arthritis progress in a single animal; and (3) need for sacrificing many animals for making observations over extended periods. Although such drawbacks may be partially overcome through using conventional radiography, ultrasound imaging, and magnetic resonance imaging,13–15 no appropriate evaluation methods have been established for animal studies because of the absence of powerful yet cost-effective joint-imaging modalities.2 Therefore, it would be beneficial to develop cost-effective imaging modalities that are readily available in routine laboratories and enable continuous monitoring of arthritis. The optical imaging modalities of cross-polarization color (CPC) imaging, erythema index (EI) imaging, and laser speckle contrast (LSC) imaging may be employed to continuously monitor and evaluate the development of arthritis in animal models. Unlike conventional color imaging, CPC imaging, which utilizes only diffuse reflected light, provides glare-free color images that are useful for qualitative evaluation of vasculature information. The EI image can be calculated from a CPC image and is utilized to evaluate the degree of redness in dermatology. Therefore, it may be usefully utilized to extract quantitative information on arthritis. LSC imaging is a simple and noninvasive two-dimensional (2-D) optical imaging technique for the evaluation of blood flow velocity in biological tissue.16 Arthritis is characterized by angiogenesis, which occurs at the edge of the synovial lining (pannus).3,17 Therefore, CPC imaging, EI imaging, and LSC imaging may be employed as indirect evaluation methods of arthritis. This study aimed to investigate the feasibility of the optical imaging modalities for continuous evaluation and monitoring of arthritis in an animal model. After inducing arthritis in mice, CPC imaging and LSC imaging were performed on mice feet. Furthermore, arthritis was quantitatively evaluated using LSC image and EI image, and was evaluated from its initial stage through 144 h after arthritis induction. The results were then compared to histological results to verify the correlation between both results. 2.Materials and Methods2.1.Principles of LSC ImagingLSC imaging is based on intensity fluctuation analysis of scattered laser light from an object containing moving scattering particles, which, in the case of biomedical applications, are particles such as blood cells; the intensity fluctuation correspondingly shows a time-varying speckle pattern. The motion of scattering particles leads to blurring of the speckles. This blurring, when statistically analyzed, provides 2-D velocity information of moving particles and is expressed quantitatively by speckle contrast: Here, is the speckle contrast, is the standard deviation of the speckle intensity, and is the average intensity. 2.2.Laser Speckle Imaging ModalityFigure 1 shows the schematic diagram of the laser speckle imaging modality used for LSC image. A diode laser (HL6512MG; 658 nm, 50 mW; Thorlabs, Newton, New Jersey, USA) was coupled into an optical fiber. A laser beam was passed through a holographic diffuser for even illumination and directed onto a beam splitter to eliminate shade from the sample. Mice feet were imaged using a charge coupled device camera (XC-HR57; Sony, Tokyo, Japan). Imaging area was , and images were acquired at 30 Hz with a frame-grabber (DOMINO IOTA; Euresys, Angleur, Belgium). 2.3.Polarization Color Imaging ModalityCPC imaging was performed using a MAGVision (OptoBioMed Co. Ltd., Wonju, Korea). The light source consisted of 16 white light-emitting diodes (LEDs) for uniform light illumination. The MAGVision was equipped with two linear polarization filters (NT45-204, Edmund, Barrington, New Jersey). A polarizer was placed in front of the LEDs in order to linearly polarize illumination. A rotating analyzer was placed in front of the in-built digital single-lens reflex camera to provide continuous rotation from 0 through 360 deg. In this study, CPC images of mice feet were acquired by rotating the analyzer 90 deg to the polarizer. The EI image was calculated from CPC image using the following simple equation:18 Here, and indicate normalized red and green channel images, respectively. The EI image indirectly provides vasculature information that is related to the degree of erythema. 2.4.Optical Evaluation of ArthritisEighteen C57BL/6 mice (six weeks old) were used for the optical evaluation of arthritis. Six mice were used for each group ( soles for each group): arthritis mice group (AMG), positive control mice group (PCMG), and negative control mice group (NCMG). Complete Freund’s adjuvant (CFA; Cat No. 7009, Chondrex Inc., Redmond, Washington), mineral oil, and saline of were injected into the footpad of the right hind leg for AMG, PCMG, and NCMG, respectively. LSC imaging and CPC imaging were employed at 0, 6, 12, 18, 24, 30, 36, 42, 48, 54, 60, 66, 72, 84, 96, 108, 120, 132, and 144 h after injection. The sole position was maintained as much as possible to avoid location artifacts by the use of two different imaging modalities. The camera parameter and surround lighting were controlled and maintained at the same condition for every image acquisition to ensure image quality. The mice were anesthetized with a mixture of (), (), and isoflurane (1.5 to 2 minimum alveolar concentration) before image acquisition. The experimental protocol was approved by the Institutional Animal Care and Use Committees (IACUC) at Catholic University, Korea. The feet area and EI were calculated from each EI image and speckle index (SI) was calculated from each LSC image. The variations of each parameter represent relative changes to the initial state as a function of time and were calculated for each animal and averaged by each group. 2.5.Histological Evaluation of ArthritisAdditional 18 C57BL/6 mice were used for histological evaluation. Six mice each were used for AMG, PCMG, and NCMG ( soles for each group). The experimental procedure is the same as that in Sec. 2.4. Histological examinations were performed as previously described.19 Two mice from each group were sacrificed at 1 (24), 3 (72), and 7 (168) days (h) after the injection, respectively. All hind paws were harvested from all mice and fixed overnight in 10% formalin, then decalcified in 5% formic acid for two weeks while changing the solution every two days (48 h) at room temperature, dehydrated in a graded series of ethanol (70, 80, 95, and 100%) and xylene, and, finally, embedded in paraffin. Thin sections ( thick) were stained with hematoxylin and eosin and optical micrographs were obtained. The degree of inflammation, synovial proliferation, and joint destruction were analyzed using a standard scoring protocol.19 The severity was scored on a scale of 0 to 3, where , , , . The experimental protocol was approved by IACUC at Catholic University, Korea. 3.ResultsFigure 2 shows CPC, EI, and LSC images of NCMG. The CPC images [Fig. 2(a)] show no significant changes in erythema and edema over time. Figure 2(b) shows the EI images, calculated from Fig. 2(a), which also show no significant changes, similar to the CPC images, over time. LSC images [Fig. 2(c)] show a slightly different SI among all images, but the change is not noticeable. Fig. 2(a) Cross-polarization color images, (b) erythema index images, and (c) laser speckle contrast images of negative control mice group (NCMG). The images were acquired at 0, 6, 12, 18, 24, 30, 36, 42, 48, 54, 60, 66, 72, 84, 96, 108, 120, 132, and 144 h after saline injection. Image sequence begins from the top left and moves to the right.  Figure 3 shows CPC, EI, and LSC images of PCMG. In the CPC images [Fig. 3(a)], increased erythema and edema are observed 6 h after mineral oil injection, but no further significant changes are seen with increasing time. Edema remained constant, while erythema decreased only a little over time. The EI [Fig. 3(b)] rapidly increased up to 6 h after mineral oil injection, but gradually decreased over time beyond that. The LSC images [Fig. 3(c)] show a rapid increase of SI 6 h after mineral oil injection, and such a change is continuously observed up to 54 h after the injection. However, 60 h after injection, the SI decreases greatly and continues to decrease over time. Fig. 3(a) Cross-polarization color images, (b) erythema index images, and (c) laser speckle contrast images of positive control mice group (PCMG). The images were acquired 0, 6, 12, 18, 24, 30, 36, 42, 48, 54, 60, 66, 72, 84, 96, 108, 120, 132, and 144 h after mineral oil injection. Image sequence begins from the top left and proceeds to the right.  Figure 4 shows CPC, EI, and LSC images of AMG. Changes in erythema and edema are observed 6 h after CFA injection, and such changes are observed to continuously increase over time. The CPC images [Fig. 4(a)] show that erythema gradually increased over time. The blood vessel in the middle of the sole shows higher erythema, edema, and vasodilation over time. The EI [Fig. 4(b)] rapidly increased after CFA injection and was maintained at a high value over time. The EI value somewhat seems to be random but still represents a high EI. In the LSC images [Fig. 4(c)], the SI greatly increases 6 h after CFA injection and then somewhat decreases, but a high SI is continuously maintained over the entire duration. The vascular region shows a higher SI than other regions in this image. Fig. 4(a) Cross-polarization color images, (b) erythema index images, and (c) laser speckle contrast images of the arthritis mice group (AMG). The images were acquired at 0, 6, 12, 18, 24, 30, 36, 42, 48, 54, 60, 66, 72, 84, 96, 108, 120, 132, and 144 h after adjuvant injection. Image sequence begins from the top left and proceeds to the right. 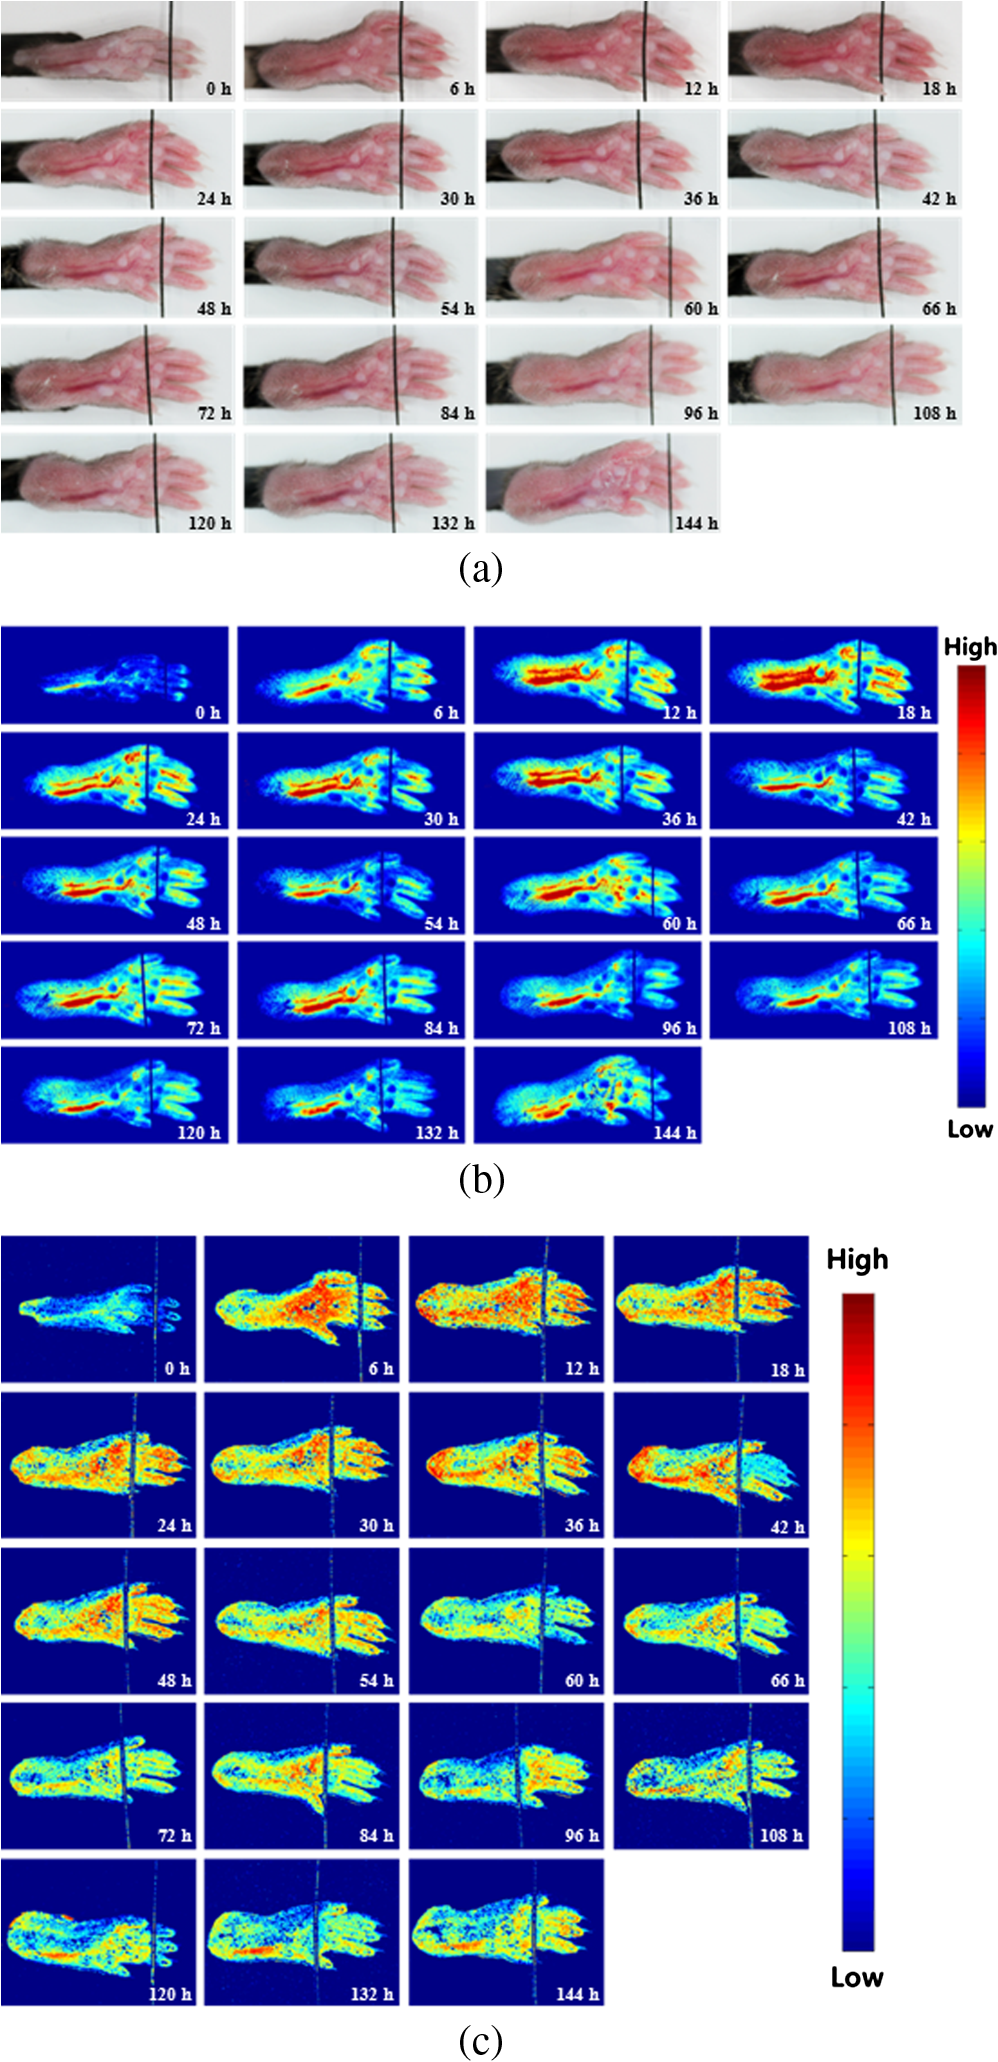 Figure 5(a) represents feet area variations in each group. There is almost no change observed in the NCMG over time. The feet area of the PCMG rapidly increases up to 6 h and then only slightly increases up to 24 h, beyond which it decreases up to 66 h. In AMG, mice feet area rapidly increases up to 6 h after CFA injection, the area after which is maintained up to 60 h; beyond that, the area continuously increases. Fig. 5Variations of (a) feet area, (b) erythema index, and (c) speckle index of each mice group over time.  Figure 5(b) shows no significant variations of EI in NCMG over time. The EI in PCMG increases up to 6 h after injection, after which it exhibits a decreasing trend with random fluctuations. In the AMG, the EI rapidly increases up to 6 h after injection, beyond which it gradually decreases over time. However, such a decrease seems a high deviation. Figure 5(c) shows SI variations over time. In the NCMG, almost no variations are observed over time. The SI in PCMG dramatically increased up to 6 h after injection, stayed constant after that up to 24 h, and then decreased to . In the AMG, the SI also dramatically increased up to 6 h after injection, remained constant up to 54 h, and then somewhat decreased after 54 h. Figure 6(a) shows the histological analysis of each group stained with hematoxylin and eosin. NCMG presented little inflammation as determined by the amount of infiltrated inflammatory cells, indicated by the purple color. One day (24 h) after the injection of mineral oil and CFA, some stained cells were observed in both the PCMG and AMG. The stained cells were mostly observed in superficial skin regions, especially in the AMG. Differences between the AMG and PCMG were observed only three days (72 h) after injection. The layer of stained cells, indicated by their purple color, was thickened three days (72 h) after CFA injection, whereas no noticeable variations were observed in the PCMG. Such differences increased seven days (168 h) after injection. The stained cell layer and the thickness dramatically increased in the AMG. On the other hand, little variation had occurred in the PCMG three days (72 h) after injection. Fig. 6(a) Hematoxylin and eosin staining of mice feet for NCMG and PCMG and AMG at 1 (24 h), 3 (72 h), and 7 (168 h) days after respective solution injection. The rectangular areas in upper panel are magnified in lower panel. (b) Mean histological scores of inflammatory cell infiltration (IFLM), synovial proliferation (SP), and joint destruction (JD) in mice feet for each group at 1 (24 h), 3 (72 h), and 7 (168 h) days after respective solution injection.  Figure 6(b) shows quantitative analysis of the histological results for the degree of inflammation, synovial hyperplasia, and joint destruction. PCMG resulted in a mild degree of inflammation only seven days (168 h) after injection. In the AMG, the degree of inflammation increased as a function of time. The AMG showed a dramatic increase of inflammatory cells and a moderate degree of joint destruction seven days (168 h) after injection. The mean histological score also presented a similar trend to the histological results. The AMG showed a time-dependent increase of the mean histological score on inflammation, synovial hyperplasia, and joint destruction. On the other hand, little change had occurred in the PCMG. 4.DiscussionAs the trend in the treatment of inflammatory arthritis has moved toward early detection and aggressive therapy to delay or prevent further increase in joint damage, new techniques that are fast, accurate, aid early evaluation, and enable prognosis are critically required to replace current methods and to develop a proper treatment plan in arthritis animal model studies.2 The PCMG and AMG are easily distinguishable from the NCMG in the CPC images. Erythema and edema were greatly increased by the time the very first measurements (6 h after injection) were taken for the PCMG and AMG. When mineral oil and CFA were injected into the footpads of mice, an anti-inflammatory response was provoked because both materials are exogenous. This response results in the sudden and rapid increase in erythema and edema in the footpads of mice. The SI shows a similar behavior in the PCMG and AMG because of the increased erythema up to after injection. However, the EI exhibited a slightly different tendency up to 24 h after injection. The CFA induced inflammation in biological tissue, but the mineral oil did not. This distinction in reactions to the two materials, CFA and mineral oil, has resulted in the difference in EI between the two groups. Therefore, an EI image may be a helpful and good indicator for differentiating early-stage arthritis between the PCMG and AMG when used together with an LSC image. The measurement of feet area variations may also be helpful for evaluating arthritis because each group clearly shows different variations of the feet area starting from the first measurement, and the differences among the groups are maintained over time. Angiogenesis and morphological changes in arthritic mice are likely related to the pathology of inflammatory arthritis. Joint damage in arthritis, which causes permanent morphological alterations, begins with the proliferation of synovial macrophages and fibroblasts after a triggering incident, possibly an autoimmune response or an infectious disease. Lymphocytes infiltrate the perivascular regions, causing endothelial cells to proliferate, and then angiogenesis occurs.20,21 In the present study, new blood vessels may have formed around the synovium in the toe joint and near the large blood vessels in the sole. These new blood vessels possibly affected blood perfusion in the tissue. The results from this study suggest that an LSC image may help in evaluating the severity of arthritis by measuring tissue blood perfusion and may be used to differentiate between arthritic regions. Furthermore, a previous study reported that newly formed blood vessels were detected during early rheumatoid arthritis even with the small inflammatory change caused during biopsy.20,22,23 LSC image can also be utilized to evaluate such early-stage arthritis. The three phenotypes (inflammation, synovial hyperplasia, and join destruction) can be observed from the histological results. The stained hematoxylin cells, as indicated by the purple color in Fig. 6(a), illustrate the degree of inflammation that accompanies angiogenesis. Inflammation occurred and greatly increased in the entire sole. SI variations were also observed over the entire sole and showed remarkable changes. The difference, which was not noticeable between the PCMG and AMG, gradually increased over time. The two phenotypes (synovial hyperplasia and join destruction), which are the most representative indicators of arthritis severity, also presented a similar trend to the degree of inflammation. Although the histological results were found to be correlated with optical imaging results, there was little difference between them. The histological results from AMG showed that inflammation was maximized in seven days (168 h) while LSI or EI images showed the maximum SI and EI within one day (24 h). Such difference may have occurred because a sudden and rapid increase in erythema was provoked after the injection of the mineral oil and CFA and affected the SI and EI related to the erythema information of tissue. Most previous studies related to animal model studies of arthritis performed histology to evaluate arthritis.1,4,7 Although histological results provide accurate pathophysiological information, histology itself is not suitable for continuous monitoring of prognosis because of the sacrifice of the animal. Histology requires time-consuming and complex processing, and results from it can be analyzed only by a pathologist or a trained expert. However, optical imaging methods—CPC imaging, EI imaging, and LSC imaging—enable noninvasive evaluation, are easy to use, and allow continuous monitoring of prognosis. Moreover, it is possible for nonexperts to easily evaluate arthritis, since optical imaging provides quantitative results. In this study, optical imaging modalities were utilized to continuously evaluate and monitor arthritis in mice. Quantitative analysis by LSC imaging resulted in a high correlation with histological results, and combining LSC imaging and EI imaging results helped evaluate early-stage arthritis. In conclusion, optical imaging modalities can be utilized for the evaluation of early-stage arthritis and arthritis severity, and also enable continuous monitoring of arthritis over time without sacrificing animals. AcknowledgmentsThis study was supported by a grant from the Korean Health Technology R&D Project, Ministry for Health & Welfare, Republic of Korea (A092258). This research was supported by the Leading Foreign Research Institute Recruitment Program through the National Research Foundation of Korea (NRF) funded by the Ministry of Science, ICT & Future Planning (2010-00757). This work was supported (in part) by the Yonsei University Research Fund of 2014. ReferencesO. MinetP. ScheibeU. J. Zabarylo,
“Diagnosis of rheumatoid arthritis using light: correction of motion artefacts and color visualization of multispectral images,”
J. Biophotonics, 3
(3), 130
–137
(2010). http://dx.doi.org/10.1002/jbio.v3:3 JBOIBX 1864-063X Google Scholar
D. ChamberlandY. JiangX. Wang,
“Optical imaging: new tools for arthritis,”
Integr. Biol., 2
(10), 496
–509
(2010). http://dx.doi.org/10.1039/b926506f IBNIFL 1757-9694 Google Scholar
D. L. ScottF. WolfeT. W. Huizinga,
“Rheumatoid arthritis,”
Lancet, 376
(9746), 1094
–1108
(2010). http://dx.doi.org/10.1016/S0140-6736(10)60826-4 LANCAO 0140-6736 Google Scholar
L. L. Gompelset al.,
“In vivo fluorescence imaging of E-selectin: quantitative detection of endothelial activation in a mouse model of arthritis,”
Arthritis Rheum., 63
(1), 107
–117
(2011). http://dx.doi.org/10.1002/art.30082 0004-3591 Google Scholar
E. J. Suttonet al.,
“In vivo magnetic resonance imaging and optical imaging comparison of viable and nonviable mesenchymal stem cells with a bifunctional label,”
Mol. Imaging, 9
(5), 278
–290
(2010). MIOMBP 1535-3508 Google Scholar
V. S. Schaferet al.,
“A novel arthritis in vivo fluorescence optical imaging technology pushed to the limits,”
Rheumatology (Oxford), 52
(6), 1144
–1145
(2013). http://dx.doi.org/10.1093/rheumatology/kes301 1462-0324 Google Scholar
C. H. Choiet al.,
“In vivo high-resolution synchrotron radiation imaging of collagen-induced arthritis in a rodent model,”
J. Synchrotron Radiat., 17
(3), 393
–399
(2010). http://dx.doi.org/10.1107/S0909049510009581 JSYRES 0909-0495 Google Scholar
R. Meieret al.,
“Indocyanine green-enhanced imaging of antigen-induced arthritis with an integrated optical imaging/radiography system,”
Arthritis Rheum., 62
(8), 2322
–2327
(2010). http://dx.doi.org/10.1002/art.v62:8 0004-3591 Google Scholar
J. D. Petersonet al.,
“Optical tomographic imaging discriminates between disease-modifying anti-rheumatic drug (DMARD) and non-DMARD efficacy in collagen antibody-induced arthritis,”
Arthritis Res. Ther., 12
(3), R105
(2010). http://dx.doi.org/10.1186/ar3038 ARTRCV 1478-6354 Google Scholar
K. Lichaet al.,
“Fluorescence imaging with multifunctional polyglycerol sulfates: novel polymeric near-IR probes targeting inflammation,”
Bioconjug. Chem., 22
(12), 2453
–2460
(2011). http://dx.doi.org/10.1021/bc2002727 BCCHES 1043-1802 Google Scholar
S. Putet al.,
“SPECT imaging of joint inflammation with nanobodies targeting the macrophage mannose receptor in a mouse model for rheumatoid arthritis,”
J. Nucl. Med., 54
(5), 807
–814
(2013). http://dx.doi.org/10.2967/jnumed.112.111781 JNMEAQ 0161-5505 Google Scholar
S. Kundu-Raychaudhuriet al.,
“In vivo quantification of mouse autoimmune arthritis by PET/CT,”
Int. J. Rheum. Dis.,
(2014). http://dx.doi.org/10.1111/1756-185X.12410 Google Scholar
J. Podlipskaet al.,
“In vivo quantitative ultrasound image analysis of femoral subchondral bone in knee osteoarthritis,”
Sci. World J., 2013 182562
(2013). http://dx.doi.org/10.1155/2013/182562 THESAS 2356-6140 Google Scholar
Y. K. TanP. G. Conaghan,
“Imaging in rheumatoid arthritis,”
Best Pract. Res. Clin. Rheumatol., 25
(4), 569
–584
(2011). http://dx.doi.org/10.1016/j.berh.2011.10.002 1521-6942 Google Scholar
D. Golovkoet al.,
“Optical imaging of rheumatoid arthritis,”
Int. J. Clin. Rheumatol., 6
(1), 67
–75
(2011). http://dx.doi.org/10.2217/ijr.10.105 IJCRHH 1758-4280 Google Scholar
T. B. Riceet al.,
“Quantitative, depth-resolved determination of particle motion using multi-exposure, spatial frequency domain laser speckle imaging,”
Biomed. Opt. Express, 4
(12), 2880
–2892
(2013). http://dx.doi.org/10.1364/BOE.4.002880 BOEICL 2156-7085 Google Scholar
S. Y. YooS. M. Kwon,
“Angiogenesis and its therapeutic opportunities,”
Mediators inflammation, 2013 127170
(2013). http://dx.doi.org/10.1155/2013/127170 MNFLEF 0962-9351 Google Scholar
B. Junget al.,
“Real-time measurement of skin erythema variation by negative compression: pilot study,”
J. Biomed. Opt., 17
(8), 081422
(2012). http://dx.doi.org/10.1117/1.JBO.17.8.081422 JBOPFO 1083-3668 Google Scholar
H. J. Yoonet al.,
“NF-AT5 is a critical regulator of inflammatory arthritis,”
Arthritis Rheum., 63
(7), 1843
–1852
(2011). http://dx.doi.org/10.1002/art.v63.7 0004-3591 Google Scholar
S. AshrafP. I. MappD. A. Walsh,
“Contributions of angiogenesis to inflammation, joint damage, and pain in a rat model of osteoarthritis,”
Arthritis Rheum., 63
(9), 2700
–2710
(2011). http://dx.doi.org/10.1002/art.30422 0004-3591 Google Scholar
I. B. McInnesG. Schett,
“The pathogenesis of rheumatoid arthritis,”
N. Engl. J. Med., 365
(23), 2205
–2219
(2011). http://dx.doi.org/10.1056/NEJMra1004965 NEJMAG 0028-4793 Google Scholar
L. C. Vasanthet al.,
“Using magnetic resonance angiography to measure abnormal synovial blood vessels in early inflammatory arthritis: a new imaging biomarker?,”
J. Rheumatol., 37
(6), 1129
–1135
(2010). http://dx.doi.org/10.3899/jrheum.090063 JRHUA9 0315-162X Google Scholar
E. Choy,
“Understanding the dynamics: pathways involved in the pathogenesis of rheumatoid arthritis,”
Rheumatology (Oxford), 51
(Suppl. 5), v3
–11
(2012). http://dx.doi.org/10.1093/rheumatology/kes113 1462-0324 Google Scholar
|


