
|
|
1.IntroductionPedicle screw (PS) fixation has been widely used as a spine fusion operation. However, PS fixation operations by conventional methods, including surgeon’s subjective feeling, anatomic landmarks, and fluoroscopy, have a failure rate of 10% to 55%.1,2 Therefore, the successful use of PS for spinal operation has sparked the development of a variety of approaches aimed at improving the safety and accuracy during these procedures. Several methods have been utilized to increase the accuracy of screw placement,3,4 such as somatosensory evoked potentials,5 motor evoked potentials,6 compound muscle action potentials,7 electromyography recordings (EMG),8,9 computed tomography (CT),10,11 intraoperative fluoroscopy,12,13 and computer-aided frameless stereo axis.14–16 All of these methods offer varying degrees of benefit; however, they all have limitations.17 Neurophysiologic monitoring requires the presence of trained neurophysiology personnel in the operating theater during PS placement. Recording the sensory or motor evoked potentials relies on the detection of impingement on nervous tissue. Considering a warning system, these methods are flawed because the surgeon is alerted too late in the whole process when the crisis of the impaired nervous function has already been detected. All neurophysiologic recordings are influenced by numerous intraoperative parameters including anesthetic agents, body temperature, blood pressure, electrical interference, electrical contacts, and blood chemistry. Researchers have reported the false-negative results as high as 23% using EMG monitoring method during PS placement.18,19 With the development of computer technology, image-guidance in the spine has become an interactive and effective navigation method. Computer-aided stereotactic navigation can provide a three-dimensional (3-D) guide for PS placement. The image guidance facilitates preoperative planning, which can determine the optimal trajectory for PS placement. Although computer image guidance remains a very useful tool in complex spinal cases, it also has some drawbacks. The system is expensive and complicated to use, requiring preoperative CT scanning and registration techniques. The surgeons need a wide range of experience and formal training. Furthermore, it is relatively time consuming especially if more than one registration is necessary for multilevel problems.20,21 Intraoperative fluoroscopy method has resulted in prolonging the time and radiation exposure for the surgical personnel and the patient. Finally, the CT has been employed for the assessment of PS position after surgery, but by that time it is too late.22 Considering the limitations of the current guidance methods, a new portable electrical conductivity-measuring device was used to detect the pedicle violation. The technology allows real-time monitoring of the detection of perforation through impedance variation and evoked muscle contractions.23 This measurement has a high sensitivity for the detection of breaches. The limitation is that it cannot judge the PS location in the pedicle during the surgery. Compared with the above methods, a device based on near-infrared spectroscopy (NIRS) was first used to guide PS during pedicle surgery. The dual-fiber probe method provides a simple, safe, and sensitive method to guide PS during routine perforation of the pedicle, based on the steady-state diffuse reflectance spectroscopy.24–28 In this paper, we used a new strategy to explore the optical reflectance along the PS fixation trajectory. We presented the design and implementation of a device for in-vitro assessment of the reduced scattering coefficient () from the optical spectrum. The variation of in different regions along the trajectory of PS was resolved with reasonable accuracy. The change curves of the three trajectories were significantly different, which would be helpful for the guidance of the PS operation. This NIRS technique has been used to study the optical properties of biological tissue, identify tissue types, diagnose cancer, and monitor drug delivery processes.29 Basically, light is delivered to the tissue surface and undergoes multiple elastic scatterings and absorptions. Part of it returns to the surface as a diffuse spectrum, carrying quantitative information about the structure and composition of the measured tissue. Wavelength-dependent absorption can be used to quantify the concentrations of biologically important chromospheres, such as hemoglobin, water, fat, and near-infrared absorbing drugs.30,31 Light scattering can also provide information in real time on scatterer size and density within the measured tissue, providing a possible marker used in optical biopsy and optical identifications of tissue.32 In this research, a needle-like dual-fiber probe was employed to explore the characteristic spectrum along the placement trajectory of PS in vertebrae bones. The monitoring technology allows real-time monitoring of the direction of perforation. The reduced scattering coefficient () of different regions related to the trajectory of PS was measured, including compact bone, boundary (between compact bone and spongy bone), spongy bone outside, and spongy bone inside. In addition, the changes in the reduced scattering coefficient were also measured and studied along the different paths, including the normal puncture path, the lateral perforation path, and the medial perforation path. The results show that this method based on NIRS has potential for improving the accuracy of PS placement. 2.Material and Methods2.1.System SetupA custom-made near-infrared spectroscopy (NIRS) measurement system is schematically shown in Fig. 1(a). The system consists of a needle-like dual-fiber probe, a stabilized fan-cooled broadband light source (HL 2000, Ocean Optics Inc., Dunedin, Florida), an optic spectrometer (USB2000, Ocean Optics Inc., Dunedin, Florida), and a computer with our specific software. Fig. 1Near-infrared spectroscopy measurement system and light spectrum: (a) schematic of measurement system; (b) dual-fiber probe; and (c) diffuse reflectance spectrum. 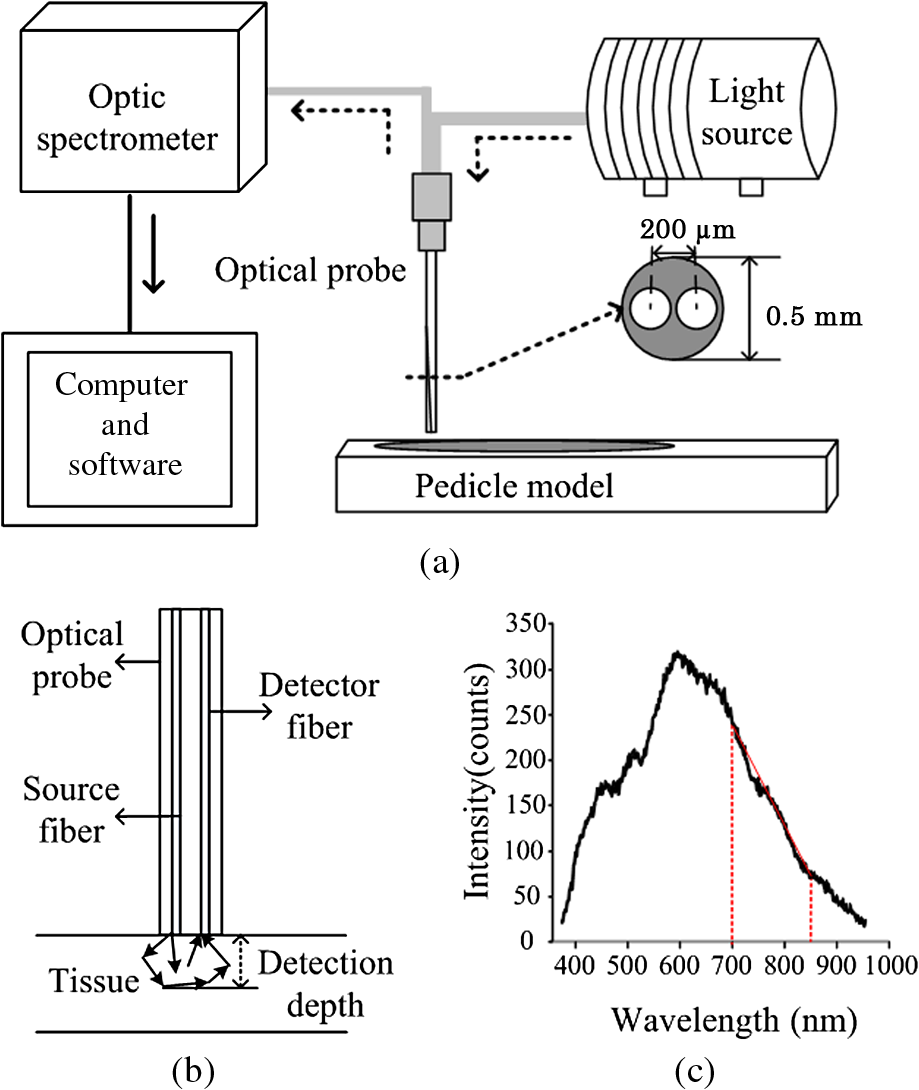 The source was a stabilized fan-cooled broadband light source (20 W). The integration time was 150 ms. The spectral values of each point were recorded for 0.5 s and the data for 10 s (20 values) were averaged. The needle-like dual-fiber probe had two optic fibers with a diameter of , which were connected to the light source and optic spectrometer, respectively. The two fibers were arranged in parallel at a core-to-core distance of in a steel tube. Light was emitted from the light source and went through the optical fiber to the surface of the tissue, which has a wide wavelength range of 360 to 2000 nm. Because of the scattering nature of light, the diffuse reflectance contained information of tissues, which were at a certain depth in front of the probe tip [Fig. 1(b)]. The optic spectrometer detected the light spectrum and the signal was analyzed and stored in e computer. Characteristic factors (CF) of different tissues in vertebra bones such as the reduced scattering coefficient () were deduced. The details in calculation of reduced scattering coefficient were given.33 The slope (700 to 850 nm) of the spectrum was calculated. It was relevant to the reduced scattering coefficient in some wavelength (e.g., 690 nm).34,35 Several experiments with extensive phantom models with different were performed to deduce the empirical equation as follows: In this equation, the unit of the values is , and is the slope of the spectrum curve from 700 to 850 nm, as shown in Fig. 1(c). According to the equation, the value (690 nm) was measured by the NIRS system for a specific probe. Considering the influence of the source on the measurement of the reduced scattering coefficient, a calibration phantom model (ISS, Inc., Champaign, Illinois) will be used to obtain a reference spectrum before the experiment on tissues. Then, all the measurement spectra are normalized to this reference spectrum. The results of the bones were validated by Oximeter (model 96208, ISS, Inc.). Furthermore, the average of the reduced scattering coefficient value for bones is , which is similar to the results in this study.36,37 2.2.Experiment MethodsFresh porcine lumbar vertebrae, which came from mature pig cadavers weighing 38 to 45 kg, were fixed on the bracket. Muscle tissue on the bone surface was removed by operation blades to expose the confluence of the transverse process and the facet joint. Considering that the detection depth was approximately , the vertebra model was simplified.38 Then each vertebra was cut into two halves and the smooth cross sections are shown in Fig. 2. Fig. 2Section of porcine vertebrae: the medial perforation (left arrow line), the normal puncture (middle arrow line), the lateral perforation (right arrow line), compact bone (the region between black solid line and brown solid line), boundary (the region on brown solid line), spongy bone outside (the region between brown solid line and black dotted line), and spongy bone inside (the region between black dotted line and brown dotted line).  The fresh vertebrae were divided into two groups (). In group 1, measurement points were located at four different regions along the trajectory, which were compact bone (the region between black solid line and brown solid line in Fig. 2), boundary (the region on brown solid line in Fig. 2), spongy bone outside (the region between brown solid line and black dotted line in Fig. 2), and spongy bone inside (the region between black dotted line and brown dotted line in Fig. 2). In each region, 10 measurement points were randomly chosen. The reduced scattering coefficient was used as the most important parameter of the NIRS system during the experiment. The values of each point were recorded every 0.5 s and the data for 10 s (20 values) were averaged. The steps above were repeated and values were obtained for all regions of one vertebra. Finally, values for each region and values for all regions were analyzed. Maximum and minimum values were analyzed according to the averages of the maximum and minimum values of each bone. Group 2 was used for the measurement along the different insertion trajectories, including the normal puncture path (middle arrowed line in Fig. 2), the lateral perforation path (right arrowed line in Fig. 2), and the medial perforation path (left arrowed line in Fig. 2). The three different insertion trajectories were marked on the section of each vertebra. The measurement points were chosen every 1 mm along each path, which passed through compact bone, boundary, spongy bone outside, and spongy bone inside. The different lengths of the three trajectories led to the different numbers of measurement points, such as 9 points along the medial perforation path, 17 points along the normal puncture path, and 14 points along the lateral perforation path. A set of values along different paths were obtained. 3.Results3.1.Reduced Scattering Coefficients in Different RegionsIn group 1, the values in porcine vertebra were recorded in different regions, including compact bone, bone boundary (between compact bone and spongy bone), spongy bone outside, and spongy bone inside. Figure 3(a) shows the anatomical photograph of vertebra and the black arrows representing specific places of different regions. Along the red dotted line left to right, the regions are compact bone, bone boundary, spongy bone outside, and spongy bone inside. Fig. 3The values in different regions: (a) the section photograph of vertebra bone and (b) comparison of values in four different lines according to (a). 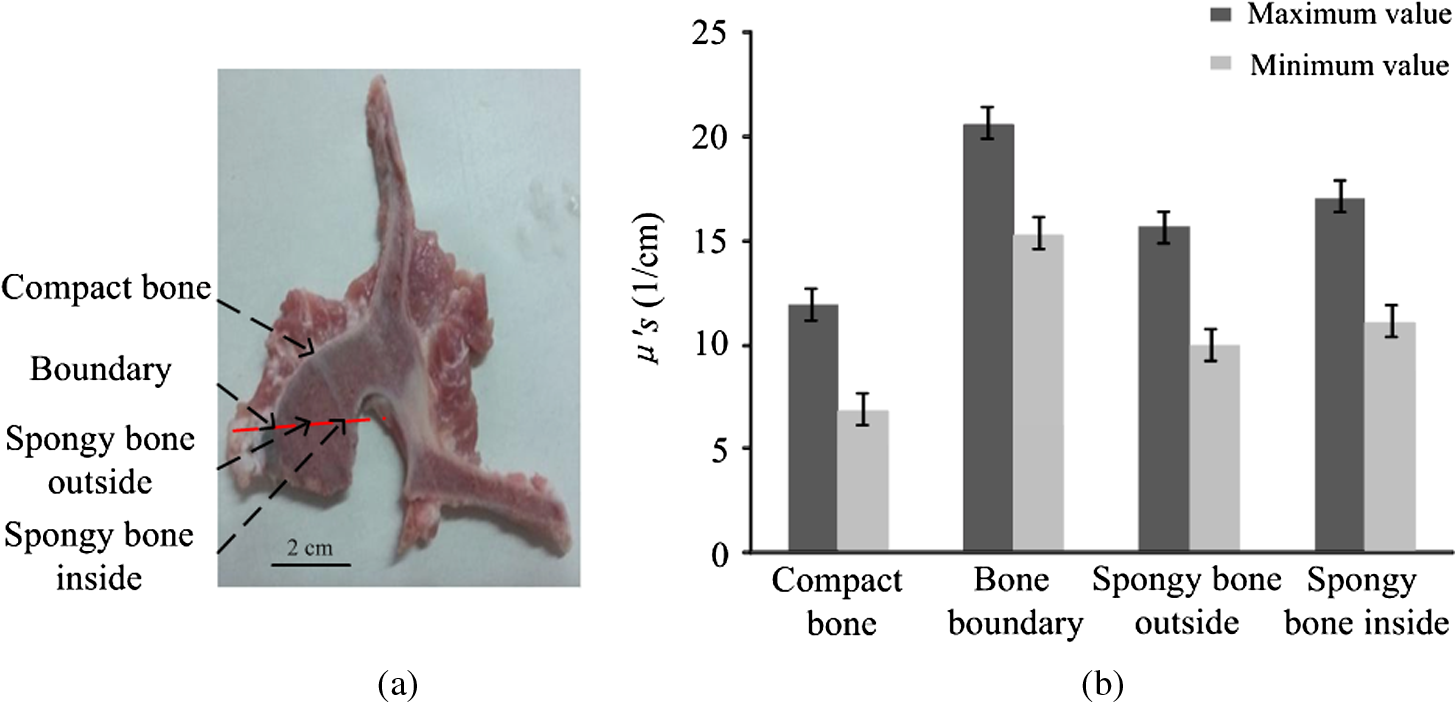 Figure 3(b) shows that the values are distinguished in the four regions and that the calculated maximum values and minimum values are not same. The values were for compact bone, for bone boundary, for spongy bone outside, and for spongy bone inside. A Student -test is a fundamental statistical process to compare the two means of two groups of data. After such statistical analysis, we learned that the differences with values in every two regions among four regions were significant (). Thus, there was a significant difference in the values, especially between compact bone and bone boundary. The values in compact bone were smaller than those in bone boundary. The maximum values for the compact bone were smaller than those for the spongy bone outside and spongy bone inside. The minimum values for the compact bone were also smaller than those for the spongy bone outside and spongy bone inside. The structures of spongy bone outside and spongy bone inside were a little different. The values in spongy bone inside had a wider range than that in spongy bone outside. In previous research, the values were from 9.08 to , which validated the values measured by our method.36,37 3.2.Reduced Scattering Coefficients Along Different PathsIn group 2, the changes of along the different paths (the normal puncture path, the lateral perforation path, and the medial perforation path) were observed. Figure 4(a) shows the anatomical photograph of half a vertebra and three marked paths (black arrow line). Figure 4(b) gives the section of vertebra and the three colored lines are the same as the lines in Fig. 4(a). Figures 4(c)–4(e) illustrate the along the normal puncture, the lateral perforation, and the medial perforation, respectively. The points A, B, C, D, and E in Figs. 4(c)–4(e) corresponded to that in Fig. 4(b) and the points were in different tissues. Point A indicated the starting point, point B was located in bone boundary, point C was in spongy bone, and point E was the terminal point. Along the lateral perforation path and the medial perforation path, point D was in bone boundary. But along the normal puncture path, point D and point E were both located in spongy bone. The results confirmed that the different paths had distinguished curves. Fig. 4The values along different paths: (a) section photograph of vertebra bone, (b) section of porcine vertebrae, (c) the values along medial perforation, (d) the values along normal puncture, (e) the values along lateral perforation, and (f) the values along different paths.  To quantify the data in points A–E, the values were shown in Table 1. In the puncture process, the reduced scattering coefficient at point A (compact bone) was small. Then the curve began to increase and reached (bone boundary) the maximum value at point B. This process indicated that the trajectories passed from compact bone to spongy bone. After the highest point, the values were in a low range, which indicates these points were located at spongy bone, and then they were through spongy bone outside, spongy bone inside, and spongy bone outside. Table 1μs′ values along different paths (1/cm).
Along the lateral perforation path and the medial perforation path, the value at point C (spongy bone outside) was smaller than that at point D (bone boundary or spongy bone). In addition, the values of points in spongy bone still fluctuated in a certain range. At the end of the path, the values were a little bigger at point E (different regions) than at point A. 3.3.Changes of Values Along Different PathsFigure 4(f) shows the changes of along with the depth of 0 to 15 mm in the bone during the normal puncture, the lateral perforation, and the medial perforation. All the curves had a peak from the starting point. The changes of values were different in that they had a smaller range during the normal puncture after the first peak. Specifically, along the lateral perforation, the value was for the depth of 13 mm and along the medial perforation it was for the depth of 8 mm, while in the normal puncture, the value was smaller for the depths of 2 to 15 mm. Three curves in the porcine spine experiment were compared. The results showed that the value was small at point A, increased at point B, then decreased. The changes of the value were probably due to the perforation of the compact bone. Moreover, Table 2 showed that the changes of value were different at the end of the normal puncture, the lateral perforation and the medial perforation. The changes of the normal puncture from C to D and from D to E were slightly less than that of the lateral perforation and the medial perforation. The change along the normal puncture from C to D was 15.37% and from D to E was 11.58%. However, they were smaller than those not only along the lateral perforation from C to D (27.38%) and from D to E (23.85%), but also along the medial perforation from C to D (35.02%) and from D to E (23.82%). In summary, the changes of values along the lateral perforation and the medial perforation became larger than that along the normal puncture. Table 2Change of μs′ in the paths.
4.DiscussionA PS fixation system has been playing an increasingly important role in the treatment of tumors, trauma, and spondylolisthesis for providing stability and correction of deformity.39,40 To my knowledge, this is the first study to present a new monitoring system using NIRS to acquire the values of different tissues in vertebrae in real time. We demonstrated that the values could be used to identify tissues along the trajectory of PSs. In this experiment, porcine pedicle values were measured in different regions and along different paths of PS insertion. Some results came from the experiment of in different regions, which were related to the different structures of porcine pedicle. It was concluded that different regions could be significantly distinguished according to different values (defined as CF). The structure of spongy bone outside and spongy bone inside was different, so the ranges of value of spongy bone outside showed a narrower range than that of spongy bone inside. The reason might be that the spongy bone outside region had a tight structure, but the spongy bone inside the region was not uniform for this section [Fig. 3(a)]. The values in compact bone were very small, in spongy bone were larger, and in bone boundary were the largest. Compact bone and bone boundary were adjacent in position, so the values had obvious/significant changes on the path through the compact bone and spongy bone, which brought guidance for PS. The same situation occurred when there was a path through spongy bone and compact bone. This phenomenon would contribute to choosing a suitable path for puncture during the clinical operation. The results from experiments of along different paths were meaningful to puncture operations. The curves of values along the normal puncture path, the lateral perforation path, and the medial perforation path showed a sharp increase at the beginning because there was the bone boundary between compact bone and spongy bone. Similarly, there was another peak on the curves of the lateral perforation and the medial perforation, which indicated the tip of the probe passed through another bone boundary. The changes on the curves of values along the normal puncture in spongy bone were slight and the values were in a certain range [Fig. 3(b)]. This was because the screw was kept in the spongy bone and there was no presence of a cortical breach. The steep increase in values from the second peak may be chosen as a rule to judge the normal puncture and other perforations. Therefore, the different changes of values from different paths would reflect that the instrument had the ability to assist puncture operations. In principle, an optical volume lies straight ahead at an optical probe tip when two fibers within the probe are placed within the tissue. Whether the probe is put deep into tissue or on the bone surface, the detection volume is the same. Thus, we place the probe above the vertebra cross-section surface (top) and make measurements at a various distances and directions in the experiment instead of drilling the probe into the vertebra from the typical screw insertion location and making measurements as the drilling progresses. In future research, a validation experiment in a more realistic case will be performed, making the experimental process closer to clinical applications. For instance, the probe was designed with a standard drilling tool at the tip for pedicle preparation. The results from the two experiments show the changes of values based on NIRS, which is a potential for improving the accuracy of PS placement. However, more analysis concerning these values has not been done and a convincing threshold has not been defined. This threshold would be studied in the future research. If the value was more than the threshold, a warning would be given in time. Further study findings will assistant in warning the practitioner that the screw is reaching the correct location during PS placement. Although several monitoring systems for PS accuracy exist, some of them lack sufficient sensitivity to allow rapid assessment of new technologies.41,42 Our monitoring technology allows real-time detection of perforation. The changes of values in different regions related to the trajectory of PS are easy to achieve and sensitive enough to distinguish an abnormal PS. But in two groups, only the values are regarded as the most important indicator. Therefore, a better method should be developed, which includes more parameters from our NIRS system, such as the absorption coefficient (). In most studies, hundreds to thousands of screws have been examined to obtain a statistically meaningful assessment of screw placement accuracy. Previous studies have compared the accuracy of PS placement between two technical modalities, both with open procedures and with minimally invasive procedures, through the application of various scoring systems to postoperative CT images.43,44 These studies evaluate accuracy by recording the presence or absence of a cortical breach, or through grading in terms of breach security. However, the NIRS system used in the experiments does not have an alarm device to interpret the presence or absence of a cortical breach. The incorporation of multiple functions, such as screw position in 3-D space according to CT, in addition to cortical breaches, will make our proposed system a more sensitive tool in accuracy evaluation. Furthermore, this system is able to clinically evaluate important subcategories of screw position, such as medial and lateral breaches. The ideal system for PS should include the following characteristics: easy availability in the operating theater, accurate, lowest radiation exposure to the professional team and the patient, and simple technique which is easily reproducible at any time during surgery. Additional clinical studies are needed to further elucidate differences in these techniques. This study provides a foundation and justification for such research. 5.ConclusionIn summary, we successfully monitored the reduced scattering coefficient of bone tissues on the trajectory of PS placement using NIRS. The reduced scattering coefficient was used for identifying different tissues in the trajectory of PS placement, which produced a real-time monitoring pattern factor during surgery. In addition, reduced scattering coefficients were acquired for three puncture paths, including the normal puncture, the lateral perforation, and the medial perforation path. The change curves of the three trajectories were significantly different, which would be helpful for the guidance of PS operation. Furthermore, the needle-like probe would be applied during percutaneous surgery and midline incision surgery. In future research, an alarm device will be applied to give an alarm if the PS is close to nerve tissue. It will provide important location information to the surgeon. The results suggest that this system using NIRS may have potential for the development of hi-tech medical instruments in navigation of PS during surgery in real time. ReferencesS. I. EssesB. L. SachsV. Dreyzin,
“Complications associated with technique of pedicle screw fixation,”
Spine, 18 2231
–2239
(1993). http://dx.doi.org/10.1097/00007632-199311000-00015 SPINDD 0362-2436 Google Scholar
S. H. DavneD. L. Myers,
“Complications of lumbar spinal fusion with transpedicular instrumentation,”
Spine, 17 362
–367
(1992). http://dx.doi.org/10.1097/00007632-199206001-00021 SPINDD 0362-2436 Google Scholar
J. Weinsteinet al.,
“Spinal pedicle fixation: reliability and validity of roentgenogram based assessment and surgical factors on successful screw placement,”
Spine, 13 1012
–1018
(1988). http://dx.doi.org/10.1097/00007632-198809000-00008 SPINDD 0362-2436 Google Scholar
W. Castroet al.,
“Accuracy of pedicle screw placement in lumber vertebrae,”
Spine, 21 1320
–1324
(1996). http://dx.doi.org/10.1097/00007632-199606010-00008 SPINDD 0362-2436 Google Scholar
A. T. ArvydasS. R. KentL. K. Howard,
“Differential rates of false-positive findings in transcranial electric motor evoked potential monitoring when using inhalational anesthesia versus total intravenous anesthesia during spine surgeries,”
Spine, 14 1440
–1446
(2014). http://dx.doi.org/10.1016/j.spinee.2013.08.037 SPINDD 0362-2436 Google Scholar
G. Cruccuet al.,
“Recommendations for the clinical use of somatosensory-evoked potentials,”
Clin. Neurophysiol., 119 1705
–1719
(2008). http://dx.doi.org/10.1016/j.clinph.2008.03.016 CNEUFU 1388-2457 Google Scholar
C. Ingeet al.,
“Motor evoked potentials and compound muscle action potentials as prognostic tools for neonates with spina bifida,”
Eur. J. Paediatr. Neurol., 17 141
–147
(2013). http://dx.doi.org/10.1016/j.ejpn.2012.06.003 1090-3798 Google Scholar
N. HollandJ. Kostuik,
“Continuous electromyographic monitoring to detect nerve root injury during thoracolumbar scoliosis surgery,”
Spine, 22 2547
–2550
(1997). http://dx.doi.org/10.1097/00007632-199711010-00016 SPINDD 0362-2436 Google Scholar
I. JoeK. Lai,
“Neuro-monitoring of an experimental model of clip compression on the spinal nerve root to characterize acute root injury,”
Spine, 23 932
–939
(1998). http://dx.doi.org/10.1097/00007632-199804150-00017 SPINDD 0362-2436 Google Scholar
F. Acostaet al.,
“Use of intraoperative isocentric C-arm 3D fluoroscopy for sextant percutaneous pedicle screw placement: case report and review of the literature,”
Spine J., 5 339
–343
(2005). http://dx.doi.org/10.1016/j.spinee.2004.09.012 1529-9430 Google Scholar
S. I. EssesB. L. SachsV. Dreyzin,
“Complications associated with the technique of pedicle screw fixation. A selected survey of ABS members,”
Spine, 18
(15), 2231
–2239
(1993). Google Scholar
K. KadirB. Turgay,
“Accuracy of pedicle and mass screw placement in the spine without using fluoroscopy: a prospective clinical study,”
Spine J., 8 591
–596
(2008). http://dx.doi.org/10.1016/j.spinee.2007.04.002 1529-9430 Google Scholar
G. BjÖrnet al.,
“Computer-assisted periacetabular screw placement: comparison of different fluoroscopy-based navigation procedures with conventional technique,”
Injury, 41 1297
–1305
(2010). http://dx.doi.org/10.1016/j.injury.2010.07.502 INJUBF Google Scholar
M. D. Barbaraet al.,
“Current state of computer-assisted trauma surgery,”
Curr. Rev. Musculoskelet. Med., 5 184
–191
(2012). http://dx.doi.org/10.1007/s12178-012-9133-z Google Scholar
A. Josephet al.,
“Use of a quantitative pedicle screw accuracy system to assess new technology: initial studies on O-arm navigation and its effect on the learning curve of percutaneous pedicle screw insertion,”
SAS J., 5 57
–62
(2011). http://dx.doi.org/10.1016/j.esas.2011.04.001 Google Scholar
N. Jonathanet al.,
“Intraoperative 3-dimensional imaging (O-arm) for assessment of pedicle screw position: does it prevent unacceptable screw placement?,”
Int. J. Spine Surg., 6 49
–54
(2012). http://dx.doi.org/10.1016/j.ijsp.2011.11.002 Google Scholar
S. C. Ludwiget al.,
“Cervical pedicle screws: comparative accuracy of two insertion techniques,”
Spine, 25 2675
–2681
(2000). http://dx.doi.org/10.1097/00007632-200010150-00022 SPINDD 0362-2436 Google Scholar
C. Bolgeret al.,
“A preliminary study of reliability of impedance measurement to detect iatrogenic initial pedicle perforation (in the porcine model),”
Eur. Spine J., 15 316
–320
(2006). http://dx.doi.org/10.1007/s00586-005-1024-1 0940-6719 Google Scholar
H. Kolleret al.,
“In vitro study of accuracy of cervical pedicle screw insertion using an electronic conductivity device (ATPS part III),”
Eur. Spine J., 18 1300
–1313
(2009). http://dx.doi.org/10.1007/s00586-009-1054-1 0940-6719 Google Scholar
H. Jae-Ho,
“Neurosensory tissue morphology with intraoperative optical fiber probe in aqueous medium,”
Optik, 122 1895
–1898
(2011). http://dx.doi.org/10.1016/j.ijleo.2010.11.020 OTIKAJ 0030-4026 Google Scholar
I. Sanget al.,
“The feasibility of laminar screw placement in the subaxial spine: analysis using 215 three-dimensional computed tomography scans and simulation software,”
Spine J., 12 577
–584
(2012). http://dx.doi.org/10.1016/j.spinee.2012.07.010 1529-9430 Google Scholar
W. BrianB. Gregory,
“Fiber-optic bundle design for quantitative fluorescence measurement from tissue,”
Appl. Opt., 37 7429
–7436
(1998). http://dx.doi.org/10.1364/AO.37.007429 APOPAI 0003-6935 Google Scholar
C. Bolgeret al.,
“Electrical conductivity measurement: a new technique to detect iatrogenic initial pedicle perforation,”
Eur. Spine J., 16 1919
–1924
(2007). http://dx.doi.org/10.1007/s00586-007-0409-8 0940-6719 Google Scholar
D. Leffet al.,
“Assessment of the cerebral cortex during motor task behaviours in adults: a systematic review of functional near infrared spectroscopy (fNIRS) studies,”
Neuroimage, 54 2922
–2936
(2011). http://dx.doi.org/10.1016/j.neuroimage.2010.10.058 NEIMEF 1053-8119 Google Scholar
M. FranceschiniD. Boas,
“Noninvasive measurement of neuronal activity with near-infrared optical imaging,”
Neuroimage, 21 372
–386
(2004). http://dx.doi.org/10.1016/j.neuroimage.2003.09.040 NEIMEF 1053-8119 Google Scholar
A. ColeJ. MaureenH. Liu,
“Use of an intracranial near-infrared probe for localization during stereotactic surgery for movement disorders,”
J. Neurosurg., 93 498
–505
(2000). http://dx.doi.org/10.3171/jns.2000.93.3.0498 JONSAC 0022-3085 Google Scholar
J. MaureenH. Liu,
“Calculating the reduced scattering coefficient of turbid media from a single optical reflectance signal,”
Proc. SPIE, 4958 251
–258
(2003). http://dx.doi.org/10.1117/12.477937 PSISDG 0277-786X Google Scholar
J. Maureenet al.,
“Determination of reduced scattering coefficient of biological tissue from a needle-like probe,”
Opt. Express, 13 4828
–4842
(2005). http://dx.doi.org/10.1364/OPEX.13.004828 OPEXFF 1094-4087 Google Scholar
S. Vikrantet al.,
“Quantification of light reflectance spectroscopy and its application: determination of hemodynamic on the rat spinal cord and brain induced by electrical stimulation,”
NeuroImage, 56 1316
–1328
(2011). http://dx.doi.org/10.1016/j.neuroimage.2011.01.020 NEIMEF 1053-8119 Google Scholar
S. Herbertet al.,
“Measurement of fluorophore concentration in scattering media by one single optical fiber,”
Proc. SPIE, 6139 61390S
(2006). http://dx.doi.org/10.1117/12.646144 PSISDG 0277-786X Google Scholar
J. Xieet al.,
“Minimally invasive assessment of the effect of mannitol and hypertonic saline therapy on traumatic brain edema using measurements of reduced scattering coefficient (),”
Appl. Opt., 49 5407
–5414
(2010). http://dx.doi.org/10.1364/AO.49.005407 APOPAI 0003-6935 Google Scholar
Z. Qianet al.,
““Look-Ahead Distance’ of a fiber probe used to assist neurosurgery: phantom and Monte Carlo study,”
Opt. Express, 11 1844
–1855
(2003). http://dx.doi.org/10.1364/OE.11.001844 OPEXFF 1094-4087 Google Scholar
L. Daiet al.,
“In vivo detection of reduced scattering coefficient of C6 glioma in rat brain tissue by near-infrared spectroscopy,”
J. Biomed. Opt., 13
(4), 044003
(2008). http://dx.doi.org/10.1117/1.2957974 JBOPFO 1083-3668 Google Scholar
S. J. MatcherM. CopeD. T. Delpy,
“In vivo measurements of the wavelength dependence of tissue-scattering coefficients between 760 nm and 900 nm measured with time-resolved spectroscopy,”
Appl. Opt., 36 386
–396
(1997). http://dx.doi.org/10.1364/AO.36.000386 APOPAI 0003-6935 Google Scholar
M. G. NicholsE. L. HullT. H. Foster,
“Design and testing of a white light, steady state diffuse reflectance spectrometer for determination of optical properties of highly scattering systems,”
Appl. Opt., 36 93
–103
(1997). http://dx.doi.org/10.1364/AO.36.000093 APOPAI 0003-6935 Google Scholar
L. J. Steven,
“Optical properties of biological tissue: a review,”
Phys. Med. Biol., 58 37
–61
(2013). http://dx.doi.org/10.1088/0031-9155/58/11/R37 PHMBA7 0031-9155 Google Scholar
G. AlexandrakisF. R. RannouA. F. Chatziioannou,
“Tomographic bioluminescence imaging by use of a combined optical-PET (OPET) system: a computer simulation feasibility study,”
Phys. Med. Biol., 50 4225
–4241
(2005). http://dx.doi.org/10.1088/0031-9155/50/17/021 PHMBA7 0031-9155 Google Scholar
X. Wanget al.,
“Near infrared effective detection depth in mouse traumatic brain edema model,”
Acta Photon. Sin., 40 277
–281
(2011). http://dx.doi.org/10.3788/gzxb 1004-4213 Google Scholar
V. Tienet al.,
“Occipital condyle screw placement, and occipitocervical instrumentation using three-dimensional image-guided naviation,”
J. Clin. Neurosci., 19 57
–760
(2012). http://dx.doi.org/10.1016/j.jocn.2011.08.003 JCNUE6 0967-5868 Google Scholar
H. Wuet al.,
“Pedicle screw placement in the thoracic spine: a randomized comparison study of computer-assisted navigation and conventional techniques,”
Chin. J. Traumatol., 13 201
–205
(2010). http://dx.doi.org/10.3760/cma.j.issn.1008-1275.2010.04.002 1008-1275 Google Scholar
B. RaviA. ZahraiR. Rampersaud,
“Clinical accuracy of computer-assisted two-dimensional fluoroscopy for the percutaneous placement of lumbosacral pedicle screws,”
Spine, 36 84
–91
(2011). http://dx.doi.org/10.1097/BRS.0b013e3181cbfd09 SPINDD 0362-2436 Google Scholar
C. Kimet al.,
“Use of navigation-assisted fluoroscopy to decrease radiation exposure during minimally invasive spine surgery,”
Spine, 8 584
–590
(2008). http://dx.doi.org/10.1016/j.spinee.2006.12.012 SPINDD 0362-2436 Google Scholar
S. Parkeret al.,
“Accuracy of free-hand pedicle screws in the thoracic and lumbar spine: analysis of 6816 consecutive screws,”
Neurosurgery, 68 170
–178
(2011). http://dx.doi.org/10.1227/NEU.0b013e3181fdfaf4 NEQUEB Google Scholar
P. Merlozet al.,
“Pedicle screw placement using image guided techniques,”
Clin. Orthop. Relat. Res., 354 39
–48
(1998). http://dx.doi.org/10.1097/00003086-199809000-00006 CORTBR 0009-921X Google Scholar
BiographyYangyang Liu is a PhD student in Nanjing University of Aeronautics and Astronautics. Her project involves fundamental research on intraoperative monitoring and navigation method using near-infrared spectral technology for pedicle screws. Zhiyu Qian received his PhD degree from the Nanjing University of Aeronautics and Astronautics (NUAA) of China in 2004. Now he is a professor in the Biomedical Engineering Department and the director of the Biomedical Photonics Lab of NUAA. His research interests are medical minimally invasive surgery navigation, real-time monitoring technology, and tumor physical therapy. He has published more than 30 SCI index papers and written more than 150 books. |


