
|
|
1.IntroductionShape sensing and structural health monitoring1,2 provide a prominent motivation for the research and development of fiber optic sensors. Over approximately the last 15 years, there has been a rapid increase in both the type of fiber optic sensors and the range of applications,3,4 with increasing interest in the medical field.5,6 Cardiorespiratory measurement was an early application and continues to be an active field of research.7–9 The interest in these sensors stems from their potential low cost of production, ease of handling, potential for ambulatory application, small size, and relatively low skill requirements for operation. Until recently, the most popular sensing element used was the fiber Bragg grating (FBG);10 this type of sensor has a good strain and temperature response but is intrinsically insensitive to other environmental parameters. Due to their capability of measuring small strains, there have been a few tentative studies on the possible use of FBGs in the medical field of cardiology—in particular for the detection and monitoring of heartbeat sounds.11–13 The FBG sensing systems used so far have had limited success, at least in part because their spatial resolution is very low. This is due to the fact that FBGs in single-mode fibers (SMFs) are not very sensitive to curvature measurements and need a larger transducer platform to detect the bending, thus effectively measuring over a large area of the human torso with the consequence that the system is not able to identify small localized motions.11,12 Moreover, some of these FBG systems are limited to studies in the temporal domain only and do not provide any spatial information.11–13 The area of cardiology concerned with investigating the sounds and motions generated by the human heart is seismocardiography (SCG). Generally, the descriptions of SCG detail the two main frequency domains. Measurement of frequency components from 0.6 to 20 Hz that are related to vibrations induced by the blood flow ejection into the vascular bed14,15 is referred to as ballistocardiograhy (BCG); this technique can be used to identify heart malfunction.14–16 The second frequency domain is from 20 up to 2 kHz; these seismocardiographic signals are mainly due to positional and shape changes of the heart and intracardiac events such as the closure of the mitral and tricuspid valves, which can produce frequencies around 200 Hz.17–21 Other higher frequency components of the sound generated by the heart (in the range of 500 Hz) can be associated with the closure of the aortic and pulmonary valves, denoting the end of systole and the beginning of diastole.22,23 Other researchers have used fiber optical sensors based upon a multimode graded index optical fiber and exploiting variations in intensity generated by microbenders to detect the ballistic forces of the heart.24 This shows promise but additional bends in the fiber may occur during the measurement procedure which can be misinterpreted or generally corrupt the data from the sensor. Furthermore, the procedure only responds to large regional movements. An optical fiber long period grating (LPG) curvature sensing scheme with a response time of 0.0185 s (data acquisition rate of 54 Hz) is presented in this paper and it is demonstrated that this scheme has sufficient sensitivity to noninvasively detect the mechanical motions or sounds of the human heart from a subject’s body surface. The authors believe that this is the first time that LPG sensors have been used to detect in real time the mechanical motion of the heart at various frequencies in the two domains highlighted above: below and above 20 Hz. To demonstrate the potential usefulness of the LPG sensors in the field of cardiology, two experiments were conducted. First, an LPG sensor was positioned at three locations across the front region of the thorax, approximately in line with the midposition of the heart and at three locations across the front upper abdominal region just below the apex of the heart. We detected peak harmonics at frequencies of 1.3, 7.6, and 10.8 Hz in healthy human subjects. These results are consistent with other published results.25 Second, a small sensing array of three LPG sensors was positioned over the apex of the heart covering an area of . A detailed protocol for how and where to place the sensors was provided by a practicing cardiologist from the School of Medicine, University of Belgrade, Serbia.26 Using this array, both frequency regimes were investigated with healthy human subjects. The data were also used to reconstruct a real-time estimation of the three-dimensional (3-D) mechanical movement of the heart wall in the apex region. Furthermore, the stroke volumes (SVs) estimated from the data appear to yield reasonable results. In the past, similar data have been used to identify malfunctioning hearts and the results in this paper suggest that our scheme may offer a low-cost aid in the detection of heart problems, though detailed clinical trials would, of course, be required to confirm this. It is known that LPGs in conventional SMF are intrinsically more sensitive to temperature variations than other sensors but it has been shown that this temperature sensitivity can be overcome either by using LPGs in photonic crystal fibers that have a very low temperature sensitivity27 or by encapsulating the LPG in a material to shield it from transient temperature fluctuations.28 Furthermore, the temperature-induced spectral changes will be in a far lower frequency range than that of the mechanical motions of the heart. The cost of electrocardiography (ECG) equipment is a few thousand dollars plus the additional cumulative cost of the ECG electrodes for individual patients. Although ECG is being used by some general practitioners in the larger surgeries, the cost rapidly rises for ultrasound cardiology medical equipment (UCME) and products associated with cardiovascular imaging, with extensive training being required to use them correctly. The potential cost of the system described in this paper would be similar to ECG and considerably less than UCME while providing reusable sensors which could cost under $1 for new sensors. 2.Sensors and Sensing SchemeA series of LPGs was fabricated in a progressive three layered (PTL) fiber (supplied by Fibercore Ltd.) as the sensing elements. This fiber was chosen for the sensing element because it exhibits LPG attenuation bands that are insensitive to changes in the surrounding medium’s refractive index, thus allowing the sensors to be embedded into other materials with no change to the sensors’ performance.29 These sensors, of length 5 cm and period , were fusion spliced into a line of standard single mode telecommunications fiber; typical physical parameters of the PTL fiber are shown in Table 1. The period of the LPGs was chosen to spectrally match the distributed feedback (DFB) lasers used to monitor the response of the LPG sensors within a specific curvature range. The interrogation scheme is an adaptation of the derivative amplitude spectroscopy approach,30 in which two spectrally separated DFB lasers are used to monitor the gradients of the spectral feature of the sensor. The ratio of these two signals is used to recover the curvature of the sensors. In this case, the fiber pigtailed DFB laser modules are emitting at the wavelengths of 1470.46 and 1470.73 nm; a spectral separation of 0.27 nm. The sensors are interrogated by switching between the DFB lasers, with synchronous detection for both lasers. Each laser is swept over a small wavelength range and then the ratio of these two signals is used as the sensor’s response to curvature which prevents bending induced loss elsewhere in the system from affecting the performance. Table 1Physical constants and parameters of the PTL fiber.29
A typical spectral transmission response to curvature obtained using a broadband light source and an optical spectrum analyzer is shown in Figs. 1(a) and 1(b), after the sensing elements and some of the connecting optical fiber had been encapsulated into a synthetic low temperature curing (90°C) silicone rubber. This encapsulation helps to reduce the overall spectral effect of transient temperature variations,26 though the measurements are conducted in a relative stable temperature environment. The spectral sensitivity of the sensors with respect to curvature () varied from 2.9 to over the range of curvature; the DFB laser used for interrogation had a wavelength of 1470 nm which leads to a spectral sensitivity of . The spectral response to curvature can be considered reasonably linear over a small range of curvature;8 however, the complete spectral wavelength response of the curvature sensor can be represented by a fourth-order polynomial, resulting in a curvature error (root mean square deviation from the polynomial) of . Fig. 1The interrogation scheme used and spectral response of the sensing elements as a function of curvature. (a) The variation in the transmission spectrum of the sensor. (b) The spectral sensitivity of the sensor along with its total bandwidth. The LPG sensing element has a period of and a length of 5 cm. (c) A schematic of the interrogation and multiplexing scheme for detecting the mechanical movement of the human heart. (d) A picture of the sensing system with a sensor.  Implementing the derivative spectroscopy interrogation technique8 introduces an error of in the ratio of the derivatives. This error was obtained by fitting a sixth-order polynomial to the ratio of the derivatives obtained from the two lasers to calibrate the scheme for curvature. The error associated with the derivatives can be translated into a curvature error of for the sensing scheme. This is a comparable resolution to that reported elsewhere with a similar interrogation scheme.8 The data acquisition rate was 54 Hz. This data acquisition rate is currently determined by the controlling software and 54 Hz does not represent a fundamental limit, though it suffices to demonstrate the potential of the system. A schematic of the entire sensing scheme is shown in Fig. 1(c). The curvature measurements of the LPGs that are shown in Fig. 1(b) were obtained using a conventional two point bending test procedure with the fiber LPGs laid strain-free upon a stainless steel strip with a thickness of . The DFB lasers used in the interrogator typically had optical powers of 5 mW and nominal bandwidths of 20 MHz and were cooled thermoelectrically. In addition, to enable each laser to yield the derivative of the transmission, a small wavelength dither at 2.4 kHz is added to each laser. This dither () reduces the effect of random anomalies on the transmission profile of the LPG’s attenuation bands. The interrogator was controlled using bespoke software via a USB connection from a laptop (dual-core) [see Fig. 1(d)]. 3.Detection of Mechanical Motion of the Human HeartA series of experiments was conducted with varying data acquisition rates and postures. First, six locations on the human torso were used to monitor the curvature variation caused by the mechanical motion of the heart at a data rate of 25 Hz. To reduce signal corruption due to torso respiratory movement, the subjects held their breath for 10 s, though the authors acknowledge that this will affect the mechanical behavior of the heart. This initial experiment was to confirm that the mechanical motion of the heart can be detected from various locations on the torso. A moderate data acquisition rate that was sufficient to capture the motion caused by blood flow into the vascular bed without any cross-contamination from additional mechanical motion of high frequencies associated with other heart mechanisms was used for this initial test. Results were obtained using the same curvature sensor at each location so a reasonable comparison can be made between locations, though it is noted that the mean curvature is different at the various placements which yields slightly different sensitivities. The sensor locations on the subject’s torso are shown schematically in Fig. 2(a). The positions of the sensors are approximately vertically aligned with the fourth intercostal space for , , and with the other three positions , , and along the seventh intercostal space around the torso. The lateral position of the sensors was such that they did not overlap with the previous sensor positions, thus covering the front sections of the lower thorax and the upper region of the abdomen. Fig. 2(a) Schematic of sensor locations on the human torso. The plots show the temporal curvature variation of the sensors associated with motion of the human heart. The sensors are adhered to the surface of the human torso at various locations (b) position , (c) position , (d) position , (e) position , (f) position , and (g) position .  Some examples of the detected curvature variation created by the motion of the heart are shown in Figs. 2(b)–2(g). All records were obtained with the same posture (neutral spine position). On inspection, Figs. 2(b)–2(g) show that there are different waveforms for each sensing location. This is to be expected given the different biological materials through which the mechanical wave is propagating and the asymmetry in the heart’s motion. Fourier analysis of the data reveals the presence of similar harmonics at each spatial location (see Fig. 3). The harmonics are , , , and and the error is the standard deviation of the variation of the harmonics. The constant presence of the lower frequencies is expected as they are associated with blood flow ejection into the vascular bed.14,15 The higher harmonic may be associated with the shape changes of the heart or intracardiac events. Although all the harmonics are present in all the experimental data for the sensor positions studied, the amplitudes of the harmonics below 20 Hz were significantly larger than those above 20 Hz, with position yielding a larger amplitude for 22 Hz than the other locations. The higher frequencies are more dependent upon location, which is expected if the signal is due to shape changes of the heart. Fig. 3The detected harmonics from the waveform generated from the motion of the human heart at the six spatial locations shown in Fig. 2(a) for human subject 2.  The experiment was repeated, this time with three sensors, with an increased data acquisition rate of 54 Hz and with the human subjects breathing with a normal rhythmic motion at around 0.3 Hz. The subjects were supine on a flat surface with hands beside the body and no head elevation. The positions of the sensors are shown in Fig. 4 and are located close to the apex found in the vicinity of the cross section of the midclavicular line and fifth intercostal space on the left. The sensors were placed with a vertical orientation (perpendicular to the ribs) along the length of the torso [see Figs. 4(a) and 4(b)] and with a horizontal orientation (parallel to the ribs) [see Fig. 4(c)]. The sensors and subject were arranged in accordance with instructions given by practicing cardiologists from the School of Medicine, University of Belgrade, Serbia, along with a document detailing how to find the general location/vicinity of the cardiac apex.26 Typical data collected from the sensors from the locations shown in Fig. 4 are shown in Figs. 5(a) and 5(b). These data represent the typical waveforms from the data collected. Each trial consisted of 10 data collection sessions for a given placement of the sensor array on the subject’s torso. It was also found that waveforms of the collected data per person for each individual placement of the sensor array with the same orientation were reasonably consistent, with the higher frequency components of the waveform associated with the mechanical motion of the heart. There is some variation observed at the low frequencies associated with respiratory motion due to the small inaccuracies of placing the sensors at the same position each time; this could be overcome by the construction of a sensor array with fixed distances between sensors. Fig. 4Examples of the spatial locations of the sensors for the detection of the movement of the heart of two human subjects. (a) and (b) The position of the sensors with a vertical orientation for both subjects A and B. (c) The position of the sensors with a horizontal orientation for subject B.  Fig. 5Curvature data with respect to time obtained simultaneously from two sensors. The sensors were located approximately at the heart apex on the torso. Both subjects were breathing with a normal rhythmic motion and the sensing positions are shown in Fig. 4: (a) subject A; (b) subject B, sensor 1 (light gray line), sensor 2 (dark line). 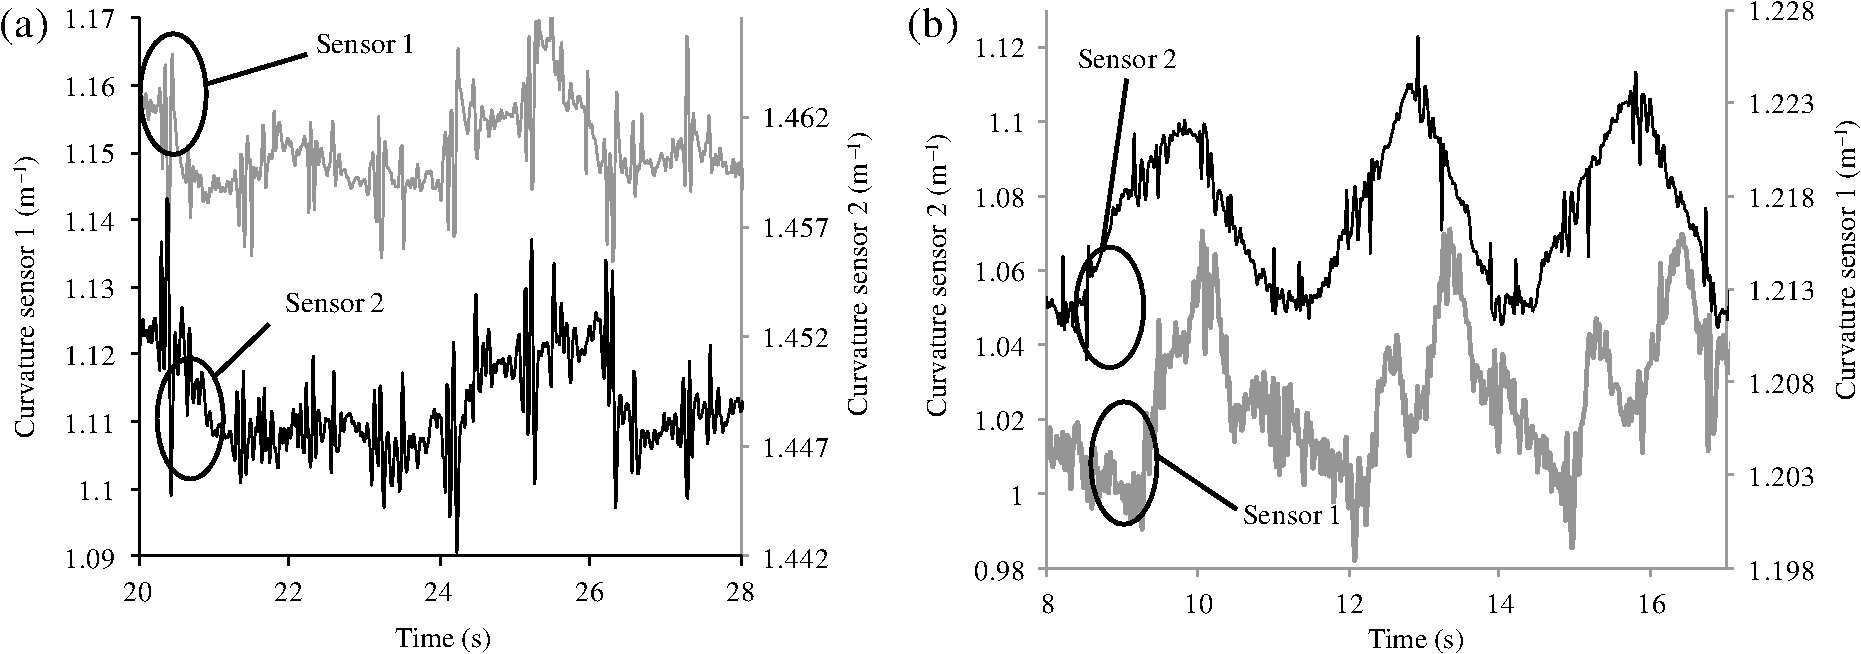 The data obtained from this second set of trials were used in three ways to illustrate the potential of this technique in cardiology. First, the sensing array data were used to reconstruct the 3-D motion of the muscle tissue associated with the apex region of the human heart. Second, the sensing array data were analyzed in the temporal domain, yielding harmonics below and above 20 Hz, which is considered the demarcation frequency for vibrations caused by blood flow into the vascular bed and intracardiac events,14,15 along with spatial location information about where these events occur. Finally, the waveform of the detected signal was used to derive an estimate of SV31 for a healthy human subject. The estimated SV obtained from the experimental data was in the range of values expected for a healthy person but the authors would like to state that the intention here is simply to illustrate the potential usefulness of the sensing scheme, with detailed verification needing to be subsequently provided by Cardiological Clinicians. Details of the two subjects are as follows. Subject A—age: 34 years, risk factors: none, height: 173 cm, weight: 72.3 kg, chest diameter: 87 cm. Subject B—age: 43 years, risk factors: smoker of approximately 15/day, height: 182.8 cm, weight: 87.2 kg, chest diameter: 113 cm. Typical recordings are shown in Fig. 5. We assume that the torso movement data from the three sensor array are closely related to the movement of the muscle wall of the heart apex, which lies in close proximity to the sensors, a minimum distance of approximately 23 mm below the surface of the skin. This distance is based upon the relationship of the body mass index to minimum skin-to-heart distances given by Bashian et al.32 (measurements in Ref. 32 are taken from the approximate position of the lowest left rib sternal insertion, which lies close to the heart apex). Subject A has a body mass index of 24, which, using Ref. 32, leads to 23 mm for the skin-to-heart apex distance, the same as that given by Rahko.33 Then we are able to construct in real time the 3-D movement of the muscle wall of the heart apex (see Fig. 6), simplistically assuming that the material between the sensor and the heart apex is homogeneous and that the mechanical wave generated from the heart is traveling through an incompressible medium. The authors realize that the materials that lie between the surface of the skin and the heart are of various types, such as muscle, fat, tendon, bone, and costal cartilage. This model is seen as an initial iteration in the development of a more sophisticated representation of the material between the heart and the surface of the skin. Fig. 6Typical examples of the estimated mean displacement variation of the heart wall (subject A) at the heart apex due to the motion of the heart obtained from three sensors located on the torso close to the heart apex. The time sequence of the frames given is (a) , (b) , (c) , and (d) . 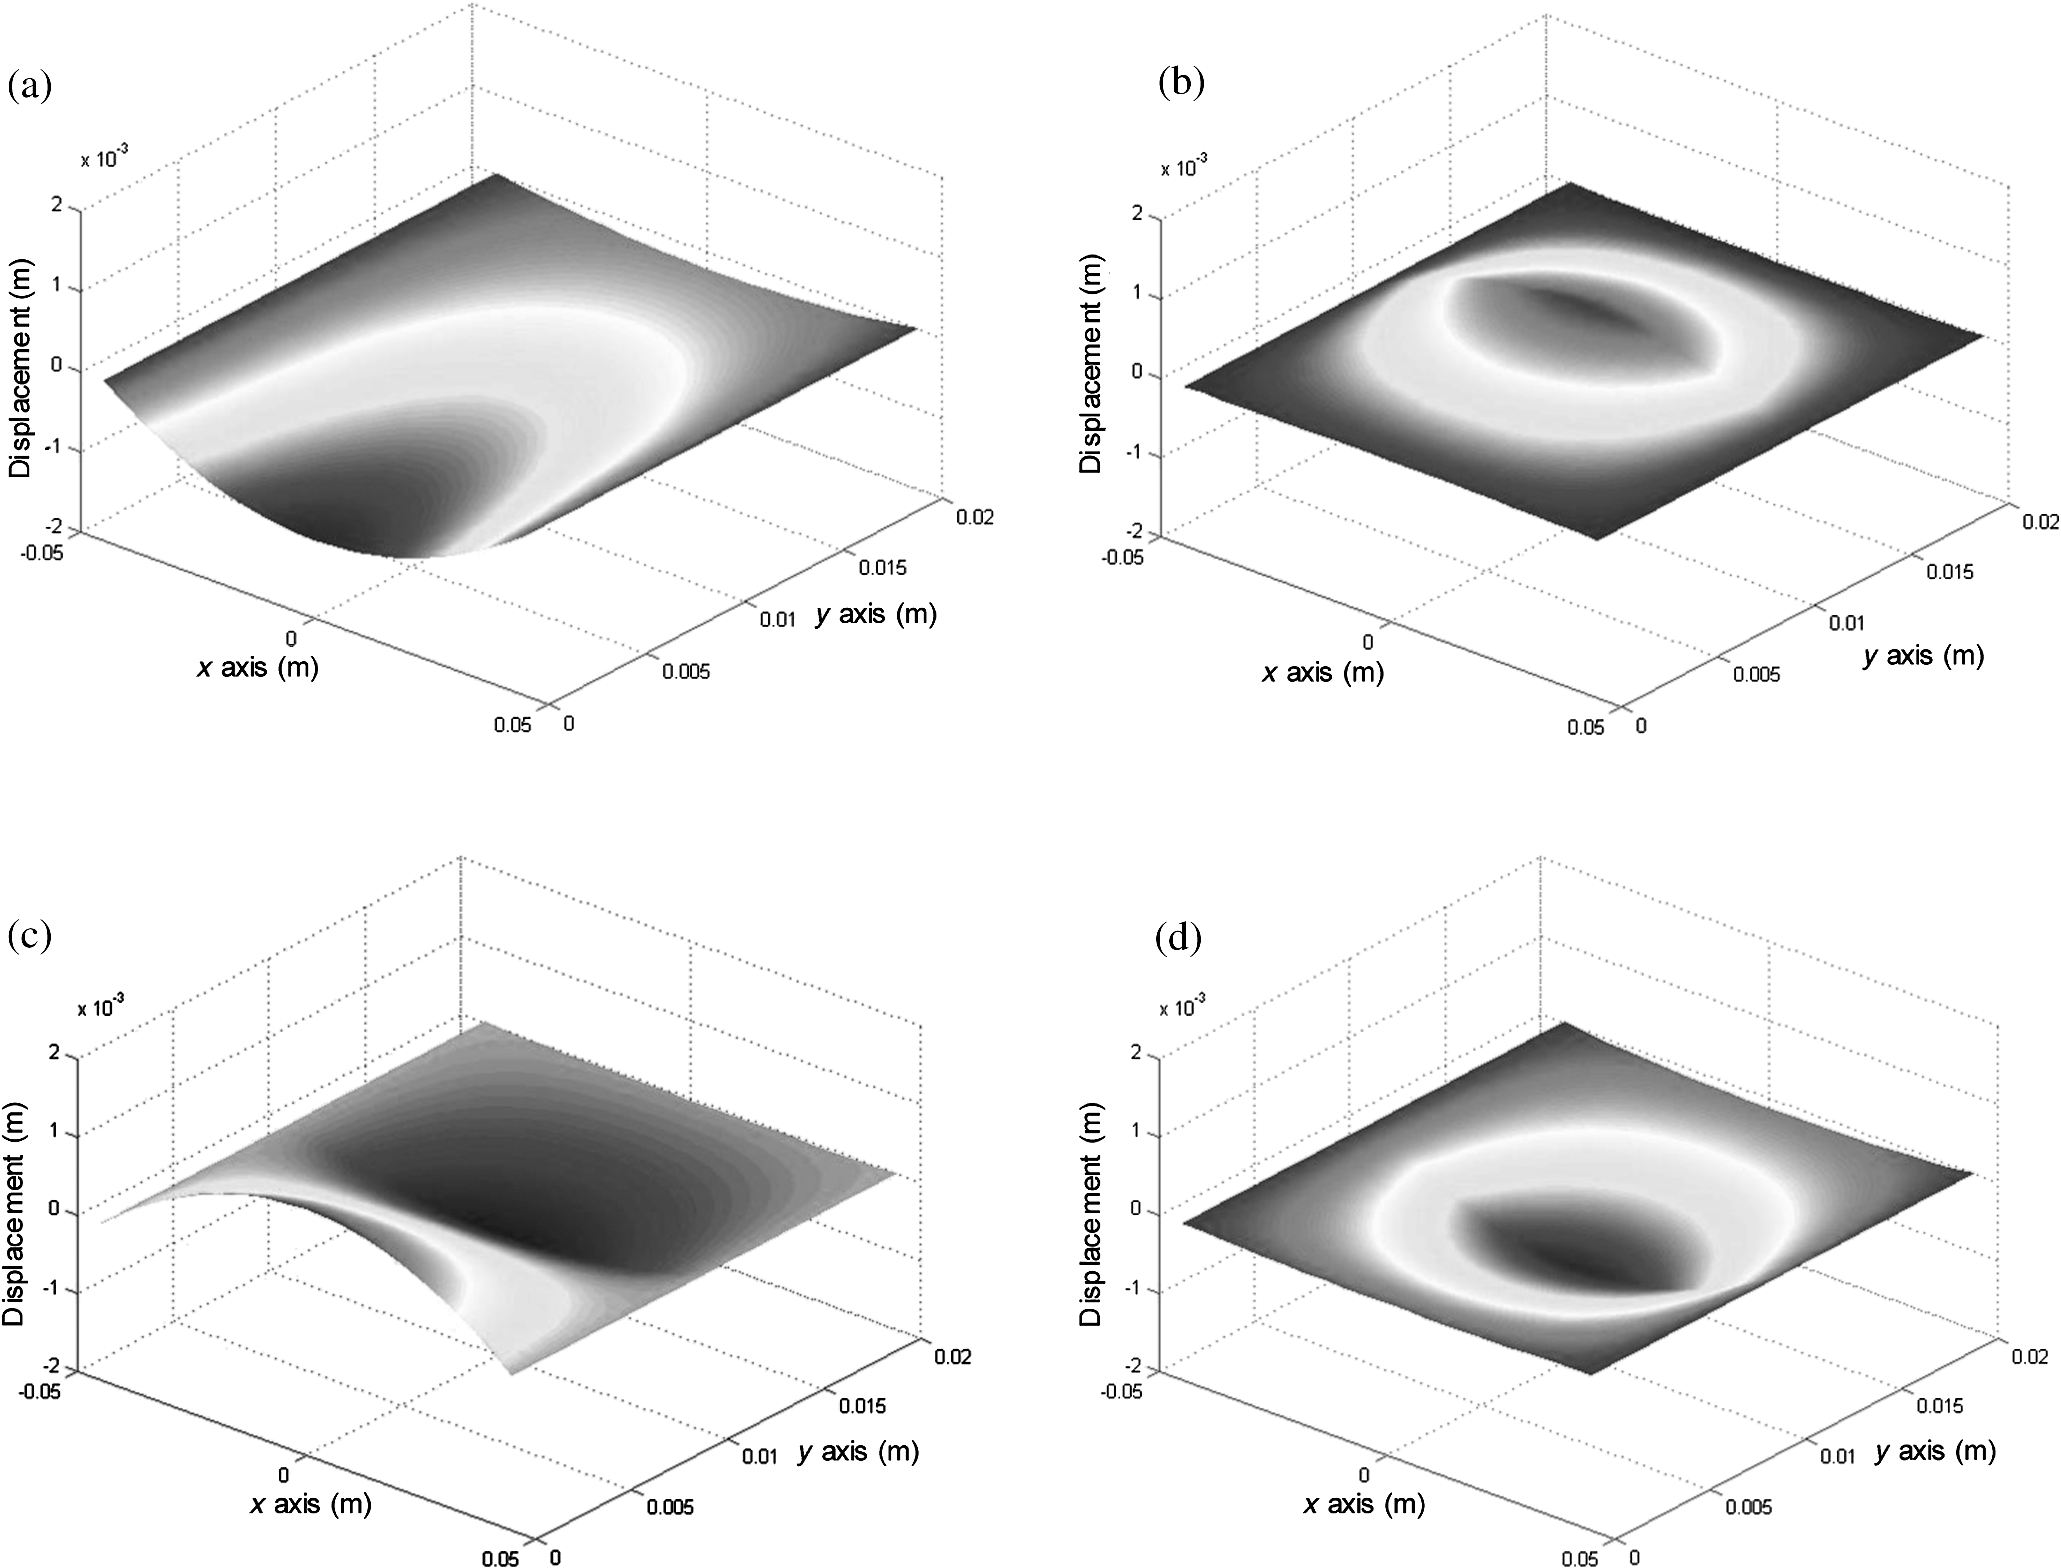 Note that in generating Fig. 6, the mean curvature of the thorax at the sensor location has been removed, as has the cyclic curvature variation induced by respiration. This was done by applying a Gaussian filter in the spectral domain after removing the highest spectral intensity, which corresponds to the lower frequency movement of the chest. Combining the curvature values with the known dimensions of the sensors gives us the ability to reconstruct the corresponding spatial coordinates (, , and ) of the individual sensors in 3-D. We can then generate a surface across the sensors by interpolating the values using a two-dimensional (2-D) spline interpolation algorithm in both directions (horizontally and vertically) across the sensing array. Using the resultant 3-D surface, other quantities can be obtained; for example, we are now able to calculate the net volume change associated with the sensed region of the heart using a standard 2-D quadrature integration technique implemented in MATLAB—the result is shown in Fig. 7. Inspecting Fig. 7, the volume changes of the heart apex can be divided into two components, one associated with heart expansion and the other volume change associated with heart contraction. If needed, a more detailed analysis can be performed on the experimental data to extract additional information for the Cardiological Clinicians. Inspecting Fig. 6, it is apparent that there can be positive and negative displacements at any given time once the variation of the chest wall position produced by respiration has been removed. Fig. 7Time variation of the net volume change of the sensing region of the heart apex of human subject A.  A Fourier transform was taken of the displacement as a function of time for each sensor. Then, a Gaussian spectral filter was used to isolate selected frequency windows of interest. Finally, the resultant data were shifted down to zero frequency before an inverse Fourier transform was used to generate the envelope function or amplitude of the displacement—at the frequency of interest. Thus the variation in the amplitude at frequencies below and above the 20 Hz threshold could be investigated. To illustrate the fact that this scheme can operate in these two regimes, two frequency ranges were investigated. The simultaneous response of the three sensors at near midrange frequencies of 14 and 28 Hz are shown in Fig. 8. Although Fig. 8 only shows results obtained for subject A, these are typical examples of collected data during all experiments for both human subjects. The approximate positions of the three sensors on the torso for this experiment are shown in Fig. 4. Fig. 8The amplitude variation at specific frequencies for subject A with a normal rhythmic breathing motion and the sensing positions shown in Fig. 4. The specific frequencies are 14 Hz (a) and 28 Hz (b), sensor 1 (light gray line), sensor 2 (dark line), sensor 3 (dashed line).  Inspecting Figs. 8(a) and 8(b) which show the response of the vertically oriented sensors at the two frequencies investigated reveals first that all the sensors’ maxima and the minima have a reasonably synchronous response. It is not expected, however, that the individual sensors should yield identical temporal responses due to the differing positions of the sensors. Second, the temporal response of the sensors at 14 Hz is different from those at 28 Hz. At 14 Hz, the amplitude of the waveforms are more similar in magnitude; this is expected because the mechanical vibrations are a consequence of blood flow injection into the vascular bed14,15 of the subject being monitored, which provides a nonlocalized body response. At 28 Hz, the response of sensor 2 is significantly different to the other two sensors. This demonstrates that the 28 Hz frequency components of the temporal response of the sensors are more spatially dependent, which is to be expected since these signals are generated by localized intracardiac events.17–21 The responses of the horizontally oriented sensors were not closely correlated with the vertical ones due to their different positions. Nevertheless, once again at 14 Hz, the sensors displayed similar amplitude levels while at 28 Hz there was more disparity. Scrutinizing the waveforms detected by the sensing scheme reveals that they have some similarities to the waveforms studied in the field of ballistocardiography (see Fig. 9). Similar data were obtained for both sensor orientations on the torso [see Figs. 4(b) and 4(c)]. Figure 9 reveals that the captured data show all the main components that are expected from a BCG along with additional information. It appears that the main three groups (pre-ejection (FGH), ejection (IJK), and diastolic (LMN) [see Fig. 9(b)] are present in the curvature data31 [Fig. 9(a)]. The sensors, which show different waveforms, are oriented along the body length (perpendicular to the ribs) and across the body length (parallel to the ribs). In Fig. 9, and are, respectively, the local maximum and minimum of the deviation of the curvature waveform from the background variation caused by respiration, which is indicated by the smoothly varying dashed curve in Fig. 9(a). This background curve was calculated as the average over 10 breathing cycles. There appears to be strong resemblance to the idealized BCG waveform Fig. 9(b) but without an obvious L–N time. Fig. 9The waveform of the recorded curvature data from subject A: (a) vertical orientation for sensor 1 (dark line) and sensor 2 (dashed line) and (b) the idealized BCG waveform and its components.31 The curvature associated with respiration is the overall envelope function and is calculated as the average over 10 breathing cycles, an example is shown in (a) (gray line). 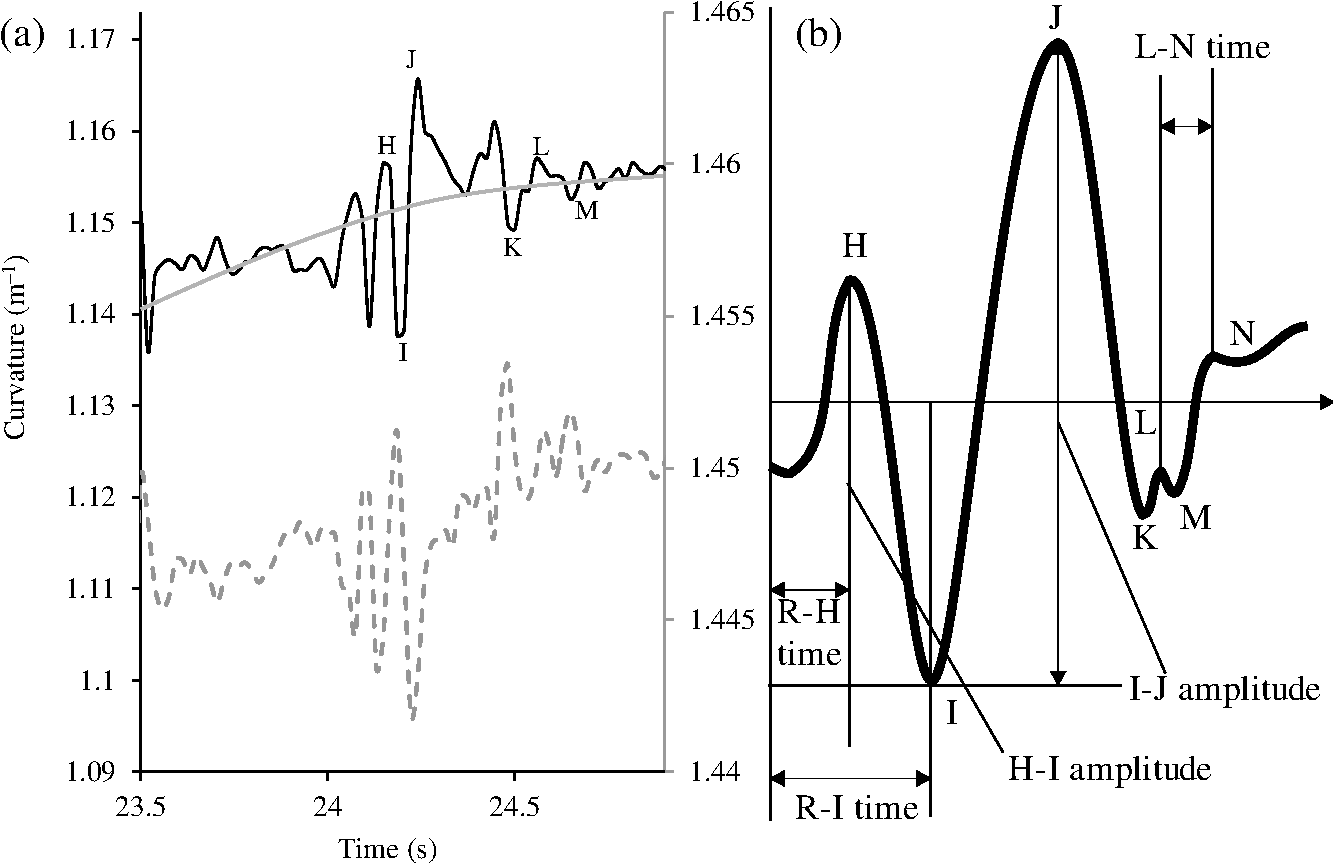 One application of ballistocardiography is to extract quantitative information to estimate the SV (the amount of blood pumped by the left ventricle of the heart in one contraction) which is used as a tool to help diagnosis or assess certain conditions and disease states of the heart. Furthermore, the SV itself correlates with cardiac function.34,35 Therefore, it is a useful exercise to see if a meaningful number for SV can be extracted from the results obtained by the sensing scheme demonstrated here. A crude estimate of SV can be obtained by transforming the curvature data into displacement data and using the SV given by Starr and Schroeder,31 . In this equation, is the internal aortic diameter,31 defined as , the parameters and are constants for estimating the aortic internal diameter from age and body surface derived from Basett’s data,31 is the body surface area, is the duration of the heart cycle which is estimated by dividing the pulse rate per minute into 60, and and are the amplitudes of the maximums of the waveform shown in Fig. 9(a). The amplitude of a peak is defined as the additional displacement (deduced from the curvature change) experienced by the sensor beyond the general curvature generated by normal respiration. Subject A has a weight of 72.3 kg and a height of 173 cm, which yield values of the constants and used to calculate the SV using the equation in Ref. 31. The body surface area is estimated using the Mosteller equation,36 yielding . Subject A has a pulse rate of ; this leads to for the equation in Ref. 31. Using the curvature waveform in Fig. 8(a) (sensor 1) and knowing that the sensor array area of measurement is , the estimated SV for subject A is 64.9 ml with a cardiac output of body surface. This SV value falls within the normal range of values: 55 to 100 ml37 for a healthy human subject with no known heart dysfunction, which is true for subject A. Although this result does not formally validate the use of this sensing scheme for BCG, it does strongly support its potential. There are several comparisons to be made with regard to the demonstrated sensing scheme. First, for direct comparison to other fiber optic schemes proposed by other research groups, this sensing scheme is based upon LPGs that have an intrinsically high sensitivity to bending compared to FBGs that are used in other schemes.11–13 Second, the demonstrated sensing scheme can identify temporal variations in curvature in small areas of the thorax or upper abdominal region of the torso and thus obtain localized motion data generated from the heart. This is a dramatic improvement of the sensing scheme in Ref. 11, which uses one sensor and is based on a large detection area of the human torso and is thus not able to identify small localized motion variations11,12 so it is limited only to studies in the temporal domain without any spatial information.11–13 Third, these LPGs are calibrated to intrinsically measure curvature or displacement of the sensor and can be used on any human subject with no further calibration, making the system simple to use. The fiber optic schemes with FBGs measure strain, which then needs to be calibrated to individual subjects; this leads to increased complexity of the measuring procedure and a likelihood of errors. Fourth, the small regional measurement provided by our system permits the study of the mechanical behavior of the human heart from various perspectives, providing the potential to recover the motion of the heart in 3-D, as demonstrated in Fig. 6. The authors believe that this is the first time that fiber optic sensors have been used to reconstruct the motion of part of the heart. Fifth, this scheme is the first fiber optic cardiac monitoring system that can recover both spatial and temporal motions caused by the heart activity (see Fig. 8). Comparing the LPG sensing scheme demonstrated here to other methods based upon different technologies reported in the literature shows several advantages for our system. First, the hardware to implement this scheme is small, lightweight, has ease of maintenance and the potential to be inexpensive compared to the classical procedure used for BCG that is bulky, expensive, requires significant mechanical maintenance, and is cumbersome to operate.38 Second, researchers have recently addressed the awkwardness of operation of the traditional approach to BCG by using force sensitive electromechanical films18,19 and pressure pads39,40 but these methods only yield an overall body signal. As a consequence, signals cannot be attributed to specific regions of the human torso, whereas the scheme presented in this paper can make small regional measurements. Third, this scheme’s sensors are inherently immune from electromagnetic interference and are chemically inert, the former offering the potential for use in magnetic resonance imaging environments. 4.ConclusionA fiber LPG curvature sensing scheme with a data rate up to 54 Hz has been presented and has been shown to be capable of noninvasively detecting the mechanical motions or sounds of the human heart from the surface of two human subjects. Several sensors can be used simultaneously. It was discovered that the system could resolve individual components of the mechanical wave generated by the human heart revealing common frequencies of 1.3, 7.6, 10.8, and 22.1 Hz present in tests on both subjects used in the investigation. The recovered data covers two frequency domains: the lower (below 20 Hz) associated with vibrations induced within the vascular bed caused by blood flow, and a second higher frequency regime corresponds to intracardiac events, such as closure of the aortic and pulmonary valves. The authors believe that this is the first time that LPG sensors have been used to detect in real time the motion of the heart at frequencies over 20 Hz, simultaneously yielding spatial location information (see Fig. 8). These results appear to be in agreement with those reported in the research literature.25 Furthermore, we propose that data from this sensing scheme can be used in the field of ballistocardiography to estimate other useful parameters such as the SV.37 In addition, and uniquely, this scheme can yield regional movement characteristics of the heart wall; an example is depicted in Fig. 6 for subject A, but similar data were obtained for the other subject. Moreover, additional information can be extracted, such as the associated volume variation for expansion and contraction of the heart wall, as shown in Fig. 7. The authors of this paper realize that these results by themselves are not sufficient to clinically validate the scheme as a new diagnostic medical tool. Considerable medical trials will be needed to confirm whether this sensing scheme could be an effective aid in the detection of heart malfunctions. It is known that analyzing the motion of the human heart in the frequency range 1 to 20 Hz can identify heart malfunctions41 and more recently new technology is being applied to BCG studies.42 Furthermore, variations of the heart rate are studied from 1 Hz and below to assess the physical/autonomic condition of the heart.43,44 Therefore, the authors do feel that the results presented in this paper show our approach has potential in the field of cardiology. AcknowledgmentsThomas Allsop would like to thank Cytec Process Materials (Keighley) Ltd. for their continuing assistance and help with the project with a noted thanks to Eric Wakeford. This work was supported by Grant No. EP/J010413 for Aston University from the UK Engineering and Physical Sciences Research Council. ReferencesM. Mieloszyket al.,
“Application of fibre Bragg grating sensors for structural health monitoring of an adaptive wing,”
J. Smart Mater. Struct., 20
(12), 125014
(2011). http://dx.doi.org/10.1088/0964-1726/20/12/125014 SMSTER 0964-1726 Google Scholar
R. Bhamberet al.,
“Arbitrary real-time three dimensional corporal object sensing and reconstruction,”
Opt. Lett., 37
(17), 3549
–3551
(2012). http://dx.doi.org/10.1364/OL.37.003549 OPLEDP 0146-9592 Google Scholar
S. VasilevO. Medvedkov,
“Long-period refractive index fibre gratings: properties, applications and fabrication techniques,”
Proc. SPIE, 4083 212
–223
(2000). http://dx.doi.org/10.1117/12.385648 PSISDG 0277-786X Google Scholar
T. Allsopet al.,
“Formation and characterisation of ultra-sensitive surface plasmon resonance sensor based upon a nano-scale corrugated multi-layered coated D-shaped optical fibre,”
J. Quantum Electron., 48
(3), 394
–405
(2012). http://dx.doi.org/10.1109/JQE.2011.2181825 IEJQA7 0018-9197 Google Scholar
G. Wehrleet al.,
“A fibre optic Bragg grating strain sensor for monitoring ventilatory movements,”
Meas. Sci. Technol., 12 805
–809
(2001). http://dx.doi.org/10.1088/0957-0233/12/7/309 MSTCEP 0957-0233 Google Scholar
A. LeungP. M. ShankarR. Mutharasan,
“A review of fiber-optic biosensors,”
Sens. Actuators B, 125 688
–703
(2007). http://dx.doi.org/10.1016/j.snb.2007.03.010 SABCEB 0925-4005 Google Scholar
L.-G. LindbergH. UgnellP. A. Oberg,
“Monitoring of respiratory and heart rates using a fibre-optic sensor,”
Med. Biol. Eng. Comput., 30 533
–537
(1992). http://dx.doi.org/10.1007/BF02457833 MBECDY 0140-0118 Google Scholar
T. Allsopet al.,
“Respiratory function monitoring using a real-time three dimensional fibre optic shaping sensing scheme based upon fibre Bragg gratings,”
J. Biomed. Opt., 17 117001
(2012). http://dx.doi.org/10.1117/1.JBO.17.11.117001 JBOPFO 1083-3668 Google Scholar
A Silvaet al.,
“Simultaneous cardiac and respiratory frequency measurement based on a single fiber Bragg grating sensor,”
Meas. Sci. Technol., 22
(7), 075801
(2011). http://dx.doi.org/10.1088/0957-0233/22/7/075801 MSTCEP 0957-0233 Google Scholar
I. Bennionet al.,
“UV-written in-fibre Bragg gratings,”
Opt. Quantum Electron., 28
(2), 93
–135
(1996). http://dx.doi.org/10.1007/BF00278281 OQELDI 0306-8919 Google Scholar
D. TosiM. OliveroG. Perrone,
“Low-cost fiber Bragg grating vibroacoustic sensor for voice and heartbeat detection,”
Appl. Opt., 47
(28), 5123
–5129
(2008). http://dx.doi.org/10.1364/AO.47.005123 APOPAI 0003-6935 Google Scholar
L. Dziudaet al.,
“Monitoring respiration and cardiac activity using fiber Bragg grating-based sensor,”
IEEE Trans. Biomed. Eng., 59
(7), 1934
–1942
(2012). http://dx.doi.org/10.1109/TBME.2012.2194145 IEBEAX 0018-9294 Google Scholar
D. GurkanD. StarodubovX. Yuan,
“Monitoring of the heartbeat sounds using an optical fiber Bragg grating sensor,”
IEEE Sens. Biophys. Sens., A3L-C.3 306
–309
(2005). Google Scholar
I. StarrF. C. Wood,
“Twenty-year studies with the ballistocardiograph: the relation between the amplitude of the first record of “healthy” adults and eventual mortality and morbidity from heart disease,”
Circulation, 23
(5), 714
–732
(1961). http://dx.doi.org/10.1161/01.CIR.23.5.714 CIRCAZ 0009-7322 Google Scholar
B. Ngaiet al.,
“Comparative analysis of seismocardiogram waves with the ultra-low frequency ballistocardiogram,”
in Conf. Proc. IEEE Engineering in Medicine and Biology Society,
2851
–2854
(2009). Google Scholar
K. Tavakolianet al.,
“Development of a novel contactless mechanocardiograph device,”
Int. J. Telemed. Appl., 436870
(2008). Google Scholar
D. M. SalernoJ. Zanetti,
“Seismocardiography: a new technique for recording cardiac vibrations. concept, method, and initial observations,”
J. Cardiovasc. Technol., 92 111
–118
(1990). JCATE6 1043-4356 Google Scholar
J. Siivola,
“New noninvasive piezoelectric transducer for recording of respiration, heart rate and body movements,”
Med. Biol. Eng. Comput., 27 423
–424
(1989). http://dx.doi.org/10.1007/BF02441435 MBECDY 0140-0118 Google Scholar
S. Junnilaet al.,
“An EMFi-film sensor based ballistocardiographic chair: performance and cycle extraction method,”
in Proc. IEEE Workshop on Signal Processing Systems Design and Implementation,
373
–377
(2005). Google Scholar
B. KirbyK. MacLeod,
“Clinical examination of the heart,”
Medicine, 34 123
–128
(2006). http://dx.doi.org/10.1383/medc.2006.34.4.123 MEDIAV 0025-7974 Google Scholar
R. S. Anand,
“PC based monitoring of human heart sounds,”
Comput. Electron. Eng., 31 166
–173
(2005). http://dx.doi.org/10.1016/j.compeleceng.2003.01.003 CPEEBQ 0045-7906 Google Scholar
P. ArnottG. PfeifferM. Tavel,
“Spectral analysis of heart sounds: relationships between some physical characteristics and frequency spectra of first and second heart sounds in normals and hypertensives,”
J. Biomed. Eng., 6 121
–128
(1984). http://dx.doi.org/10.1016/0141-5425(84)90054-2 JBIEDR 0141-5425 Google Scholar
A. VanderJ. ShermanD. Luciano, Human Physiology: The Mechanisms of Body Function, McGraw-Hill, N. Y.
(1990). Google Scholar
Z. Chenet al.,
“Portable fiber optic ballistocardiogram sensor for home use,”
Proc. SPIE, 8218 82180X
(2012). http://dx.doi.org/10.1117/12.909768 PSISDG 0277-786X Google Scholar
X. Zhuet al.,
“Real-time monitoring of respiration rhythm and pulse rate during sleep,”
IEEE Trans. Biomed. Eng., 53
(12), 2553
–2563
(2006). http://dx.doi.org/10.1109/TBME.2006.884641 IEBEAX 0018-9294 Google Scholar
L. Hadzievski,
“Study Protocol, Use of Optical Fibre Long Period Grating Sensors in Cardiology Trial 1 Preliminary Experiments for Kinetocardiography Title: A Prospective Trial of Feasibility of Optical Fibre Long Period Grating Sensors to Record Carotid Pulse Tracing and Apical Movement Contour in Healthy Volunteers,”
(2008). Google Scholar
H. DobbK. KalliD. J. Webb,
“Temperature-insensitive long period grating sensors in photonic crystal fibre,”
Electron. Lett., 40
(11), 657
–658
(2004). http://dx.doi.org/10.1049/el:20040433 ELLEAK 0013-5194 Google Scholar
T. Allsopet al.,
“Embedded progressive-three-layered fiber long-period gratings for respiratory monitoring,”
J. Biomed. Opt., 8
(3), 552
–558
(2003). http://dx.doi.org/10.1117/1.1578497 JBOPFO 1083-3668 Google Scholar
T. AllsopD. WebbI. Bennion,
“A comparison and characteristics of sensing parameters of long period gratings written in three different types of fiber,”
Opt. Fiber Technol., 9
(4), 210
–223
(2003). http://dx.doi.org/10.1016/S1068-5200(03)00028-2 1068-5200 Google Scholar
T. Allsopet al.,
“A strain sensing system using a novel optical fibre Bragg grating sensor and a synthetic heterodyne interrogation technique,”
Meas. Sci. Technol., 13
(5), 731
–740
(2002). http://dx.doi.org/10.1088/0957-0233/13/5/311 MSTCEP 0957-0233 Google Scholar
I. StarrH. Schroeder,
“Ballistocardiogram. II normal standards, abnormalities commonly found in diseases of the heart and circulation, and their significance,”
J. Clin. Invest., 19
(3), 437
–450
(1940). http://dx.doi.org/10.1172/JCI101145 JCINAO 0021-9738 Google Scholar
G. Bashianet al.,
“Relationship of body mass index (BMI) to minimum distance from skin surface to myocardium: implications for neuromuscular incapacitating devices (NMID),”
Circulation, 116
(16), 947
–944
(2007). CIRCAZ 0009-7322 Google Scholar
P. S. Rahko,
“Evaluation of the skin-to-heart distance in the standing adult by two-dimensional echocardiography,”
J. Am. Soc. Echocardiogr., 21
(6), 761
–764
(2008). http://dx.doi.org/10.1016/j.echo.2007.10.027 JSECEJ 0894-7317 Google Scholar
D. A. Reuteret al.,
“Usefulness of left ventricular stroke volume variation to assess fluid responsiveness in patients with reduced cardiac function,”
Crit. Care Med., 31
(5), 1399
–1404
(2003). http://dx.doi.org/10.1097/01.CCM.0000059442.37548.E1 CCMDC7 0090-3493 Google Scholar
F. Haddadet al.,
“Right ventricular function in cardiovascular disease, part I anatomy, physiology, aging, and functional assessment of the right ventricle,”
Circulation, 117
(11), 1436
–1448
(2008). http://dx.doi.org/10.1161/CIRCULATIONAHA.107.653576 CIRCAZ 0009-7322 Google Scholar
R. Mosteller,
“Simplified calculation of body surface area,”
N. Engl. J. Med., 317
(17), 1098
(1987). NEJMAG 0028-4793 Google Scholar
G. de Simoneet al.,
“Stroke volume and cardiac output in normotensive children and adults assessment of relations with body size and impact of overweight,”
Circulation, 95 1837
–1843
(1997). http://dx.doi.org/10.1161/01.CIR.95.7.1837 CIRCAZ 0009-7322 Google Scholar
O. T. Inanet al.,
“Robust ballistocardiogram acquisition for home monitoring,”
Physiol. Meas., 30 169
–185
(2009). http://dx.doi.org/10.1088/0967-3334/30/2/005 PMEAE3 0967-3334 Google Scholar
D. C. Macket al.,
“Development and preliminary validation of heart rate and breathing rate detection using a passive, ballistocardiography-based sleep monitoring system,”
IEEE Trans. Inf. Technol. Biomed., 13
(1), 111
–120
(2009). http://dx.doi.org/10.1109/TITB.2008.2007194 ITIBFX 1089-7771 Google Scholar
Z. Chenet al.,
“Portable fiber optic ballistocardiogram sensor for home use,”
Proc. SPIE, 8218 82180X
(2012). http://dx.doi.org/10.1117/12.909768 PSISDG 0277-786X Google Scholar
I. Starr,
“The relation of the ballistocardiogram to cardiac function,”
Am. J. Cardiol., 2
(6), 737
–747
(1958). http://dx.doi.org/10.1016/0002-9149(58)90271-6 AJNCE4 0258-4425 Google Scholar
J. Alametsäet al.,
“Ballistocardiogaphic studies with acceleration and electromechanical film sensors,”
Med. Eng. Phys., 31
(9), 1154
–1165
(2009). http://dx.doi.org/10.1016/j.medengphy.2009.07.020 MEPHEO 1350-4533 Google Scholar
S. Akselrodet al.,
“Power spectrum analysis of heart rate fluctuation: a quantitative probe of beat-to-beat cardiovascular control,”
Science, 213
(4504), 220
–222
(1981). http://dx.doi.org/10.1126/science.6166045 SCIEAS 0036-8075 Google Scholar
B. Pomeranzet al.,
“Assessment of autonomic function in humans by heart rate spectral analysis,”
Am. J. Physiol. Heart Circ. Physiol., 248
(1), H151
–H153
(1985). Google Scholar
|


