|
|
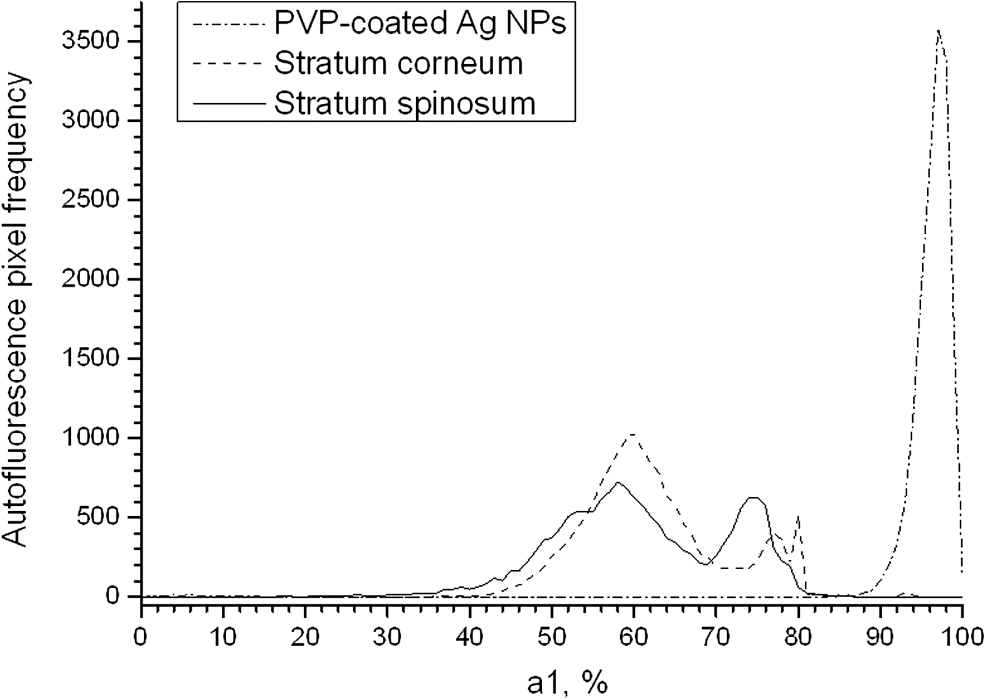
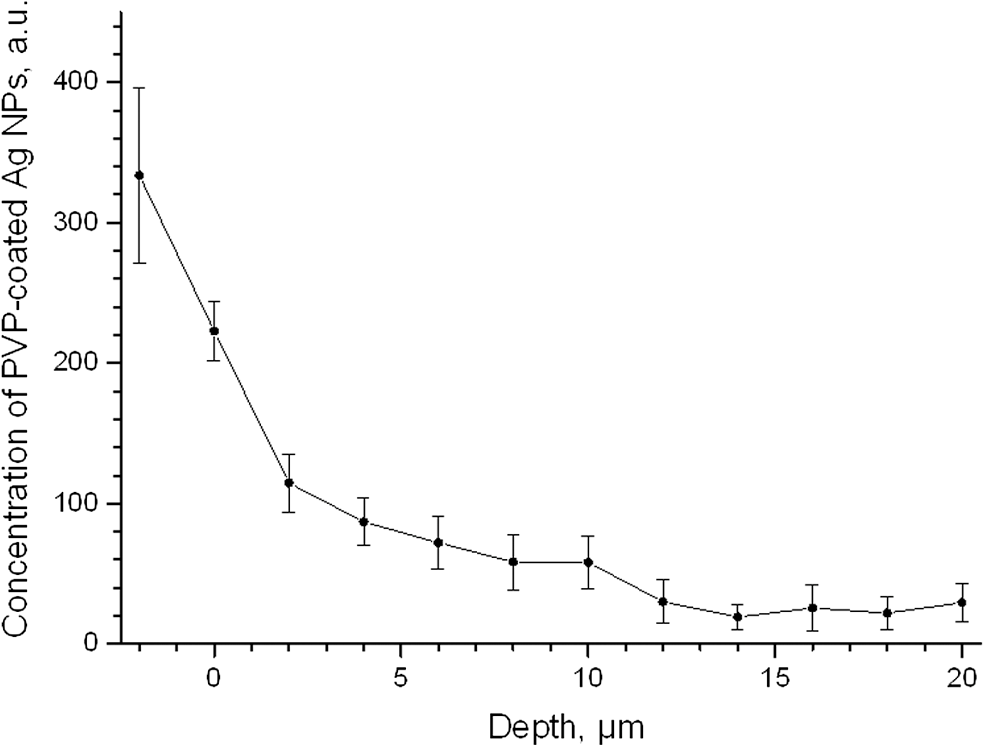
1.IntroductionSilver nanoparticles (Ag NPs) are silver particles of size between 1 and 100 nm, which may be used as ingredients in sterilizing dyes or antibacterial agents.1 Food, medical devices, and cosmetic industries often coat their products with Ag NPs,2 which, however, depending on the concentration, could be toxic for organs.3 Toxic effects are higher when the surface-to-volume ratio of the Ag NPs is increased and there is direct contact with viable cells.4,5 This is due to the fact that the Ag NPs applied to tissue-cultured human cells may induce free radicals, raising concerns for potential health risks.6,7 Such radical formation can be reduced by coating the NPs.8 Ag NPs dispend under oxygen and form silver ions, which is the main cause of silver toxicity in bacteria and mammalian cells.7,9 Although Ag NPs are widely used in creams, textiles, topical products, and surgical prosthesis,3,10,11 their penetration into skin is not yet completely understood. Inside the skin, there is a barrier function that is generally attributed to the stratum corneum (SC), preventing the entrance of foreign molecules from the external environment.12 Therefore, the capability of solid NPs, such as silver or zinc oxide, to penetrate or permeate the SC has triggered controversial discussions about their safety and is now a topic of international research.13 So far, many studies have been focused on the Ag NPs’ penetration ability into the skin using different methods.6,14–17 Larese et al.14 used poly-N-vinylpirrolidone (PVP)-coated Ag NPs (25 nm) to investigate human skin penetration ex vivo and verified the location of the penetrated Ag NPs using transmission electron microscopy (TEM). Their conclusions showed that the coated Ag NPs were able to permeate the damaged skin in an ex vivo diffusion cell system. George et al.15 applied a nanocrystalline silver dressing to healthy volunteers with normal intact skin and analyzed the silver absorption by tissue mass spectrometry, light microscopy, scanning electron microscopy, and an x-ray diffusion spectrography. Their results demonstrated that Ag NPs were able to penetrate through the intact human skin in vivo and could be found beyond the SC at depths of the reticular dermis. Samberg et al.16 conducted microscopic and ultrastructural observations of different Ag NPs’ (20, 50, and 80 nm) in vivo/ex vivo penetration through human/porcine skin and determined the location of the penetrated Ag NPs in cytoplasmic vacuoles of human epidermal keratinocytes by dynamic light scattering and TEM. Furthermore, they proved that Ag NPs are nontoxic when dosed in washed Ag NP solutions or when they are carbon coated. Verano-Braga et al.6 adopted mass spectrometry based proteomic technologies, western blotting, and confocal laser scanning microscopy to investigate the Ag NPs and protein interaction in the human LoVo cell (epithelial cell) line. Their data showed that 20-nm-diameter Ag NPs were able to enter the cells, while 100-nm-diameter Ag NPs were not. Kokura et al.17 studied the permeability of Ag NPs in human skin and proved that Ag NPs did not penetrate through intact human skin at concentrations of 0.002 to 0.02 parts per million, thus having no effect on HaCaT keratinocytes. Considering the results described above, we investigated the ex vivo Ag NPs’ penetration into porcine skin, which is a suitable model of human skin,18,19 using three different methods, i.e., two-photon tomography with fluorescence lifetime imaging microscopy (TPT-FLIM),20 confocal Raman microscopy (CRM),21 and surface-enhanced Raman scattering (SERS) microscopy.22 TPT-FLIM is an imaging technique based on the differences in the exponential decay rate of autofluorescence (AF) from skin cells, which is combined with two-photon excitation microscopy. TPT-FLIM can track the penetration depth of Ag NPs in porcine skin based on the different fluorescence lifetimes of skin components and Ag NPs and their contribution to the multiexponential fluorescence decay function. CRM is a spectroscopic technique that has been widely used in medicine in order to observe vibrational, rotational, and other low-frequency modes of investigated molecules.23,24 The strong limitation of Raman microscopy regarding the penetration measurements is the superposition of Raman peaks of the investigated substance with the Raman peaks and fluorescence background of the skin. A strong enhancement of Raman intensities up to times generated by molecules adsorbed onto a nanostructured metal surface can overcome the disadvantages of Raman spectroscopy.25,26 SERS is a surface-sensitive technique that improves Raman scattering by molecules adsorbed on rough metal surfaces or by nanostructures, such as plasmonic-magnetic silica nanotubes.27,28 SERS provides high sensitivity since it can be generated even by a small group of NPs. At the same time, it has a much higher log-order signal than normal Raman scattering and can reflect information about chemical bonds between the NPs and organic substances.29–31 2.Materials and Methods2.1.NanoparticlesThe Ag NPs were synthetized by the group of Matthias Epple, as described by Mahl et al.32 The particles were coated with PVP (Ag NPs size: silver core in diameter) and soaked in the liquid suspension (ultrapure water). They had a zeta potential of .33 The Ag NPs’ concentration in suspension was . 2.2.Skin Sample PreparationFresh porcine ears were obtained on the day of slaughter from a local butcher. Three porcine ears were selected, and three samples of were excised from each of them. Before the measurement started, the ears were cleaned with cold flowing water and dried with paper towels. The bristles were carefully removed so as not to affect the integrity of the SC. After the Ag NPs–containing solution was applied on the surface of porcine ears ( for area), the skin samples were stored in a wet chamber in an incubator for 24 h at a temperature of 37°C, 5% , and 100% humidity for passive penetration. 2.3.Two-Photon Tomography with Fluorescence Lifetime Imaging TechniqueThe two-photon tomograph (DermaInspect, Jenlab GmbH, Jena, Germany) equipped with a tunable femtosecond titanium sapphire laser (Mai Tai XF, Spectra Physics, USA, 710 to 920 nm) was used for ex vivo measurements of porcine ear skin.34,35 The laser was operated at 760 nm and generated 100-fs pulses at a repetition rate of 80 MHz. Employing the time-correlated single photon counting technology, one channel FLIM module with a temporal resolution of 250 ps was attached to the DermaInspect tomograph. The femtosecond laser is focused on the sample within a femtoliter volume by a high-NA oil-immersed objective lens (magnification ; NA: 1.3). In the DermaInspect, the optics of the signal-receiving channel consists of one each short bandpass filter 409 nm and long bandpass filter 680 nm (HC 680/SP). The maximal scanning range is in the direction and in the direction. The lateral and axial resolutions of the DermaInspect system in the skin are 0.4 to and 1.2 to , respectively.36 The FLIM and AF intensity signals can be registered through the same objective lens by different photomultiplier tubes. For intensity images, the resolution is typically , and for FLIM images, the typical resolution is . The immersion oil, the measurement window, and the skin all have the same refractive index of around 1.45; therefore, all depths measured using this method are real geometrical depths. Fluorescence lifetime analysis was performed with software (SPCImage 4.2) incorporated into the DermaInspect system. The fluorescence lifetime is the average time from absorbance to emission of a photon. Since the number of photons is linearly proportional to the fluorescence intensity, the fluorescence lifetime can be determined from the fluorescence intensity decay as the of the maximum value. The fluorescence decay is often multiexponential. A biexponential fit function was utilized as shown in Eq. (1) where is the initial intensity of excited fluorescence at , is the current time, and are the fluorescence lifetimes of fast and slow components, respectively, which are independent of the initial intensity of the emitted light, and and are the corresponding amplitudes of the fast and slow components, respectively. The average time of fluorescence could be defined asAfter pulsed excitation, the lifetime of AF will decay exponentially as described in Eq. (1). The width of the instrumental response function has to be taken into account, and in our case, it is small compared to the width of the time channel () in the fluorescence lifetime histogram. The measured fluorescence intensity, , follows the description presented in Eq. (3) where is the convolution operator. However, the decay function cannot be deconvoluted directly as division by zero will yield an error. But one can measure the instrumental response of the source, detector, and electronics from the scattered excitation light.Skin samples were fixed onto the cover glass. The excitation wavelength was set at 760 nm. To image the Ag NPs–treated skin with SC or even stratum spinosum (SS), the FLIM measured depth reached , based on the Ag NPs’ signal detection. The acquisition time was equal to 9.6 s for one image. The depth increments were set at for the FLIM stack measurements. For each of the three ear samples, three different positions were measured. 2.4.Confocal Raman MicroscopyCRM measurements were performed using a model 3510 Skin Composition Analyzer (River Diagnostics, Rotterdam, The Netherlands), which is commonly implemented for in vivo/ex vivo skin investigations. A near-infrared laser (785 nm, 26 mW on the skin surface) was used to analyze the skin samples in the fingerprint region (400 to ). The 785 nm excitation wavelength has been widely used for Raman measurements in the field of dermatology due to the reduced absorption and scattering by the skin and, as a result, the high penetration ability.37,38 The Raman fingerprint spectra were recorded from the skin surface down to a depth of at increments of . The immersion oil, the measurement window, and the skin all have the same refractive index around 1.45; therefore, all depths measured using CRM are real geometrical depths. The acquisition time for one Raman spectrum was 5 s. In this case, the detailed Raman profiles were acquired within the epidermis. According to the CRM spectrum of the Ag NPs–treated skin, the penetration profile can be determined by the nonrestricted multiple least square fit (NMF) method using Skin Tools 2.0 software provided by River Diagnostics.39,40 For each porcine ear skin sample, 10 different points were measured in order to obtain the penetration profile. In total, three different porcine skin ear samples were measured. The utilized Raman microscope was described in detail elsewhere.37,41–43 2.5.Surface-Enhanced Raman Scattering MicroscopyAs Ag NPs are able to generate an SERS signal under the excitation of 785 nm,22 the CRM described above was used for analyzing the Ag NPs’ penetration into the skin by SERS microscopy. The same measurement procedure was applied, i.e., a measurement depth of at increments of , 5 s acquisition time for one spectrum, and excitation wavelength of 785 nm at 26 mW on the skin surface. Again, 10 different points were measured on each porcine skin ear sample. In total, three different porcine skin ear samples were measured. The penetration profile could be easily calculated as the shape of the SERS spectrum differs strongly from that of the intact skin Raman spectrum, and its intensity is much higher. 3.Results and Discussions3.1.TPT-FLIM ExperimentTo understand the spectroscopic properties of the PVP-coated Ag NPs, the AF intensity was investigated, depending on the excitation wavelength in the range between 710 and 920 nm. The maximal fluorescence efficiency of Ag NPs was found in the range between 730 and 780 nm. Thus, the wavelength of 760 nm was chosen as the excitation wavelength of the TPT-FLIM system in our experiments. Separately, the average lifetime () distributions of PVP-coated Ag NPs, SC, and SS of porcine skin were acquired by the TPT-FLIM system. They are shown in Fig. 1(a). From Fig. 1(a), one can see that the peak value of the Ag NPs’ fluorescence lifetime distribution is at , and SC’s and SS’s mean lifetimes based on the maximum values of the lifetime distribution lie in the range of 1300 and 1700 ps, respectively. Therefore, the Ag NPs and skin layers can be clearly distinguished according to their own lifetime distributions. In this case, we continued our experiments on the Ag NPs–treated porcine skin after 24 h. Starting from the SC, two prominent peaks are visible in the lifetime distribution curve, which are shown in Fig. 1(b). One peak is at and the other at . The first peak is caused by Ag NPs, but its lifetime value is higher than that of independent Ag NPs’ AF, which may have been induced by the interaction between the NPs and skin components. Thus, we can track the peaks of Ag NPs’ FLIM on the skin layers to determine the NPs’ penetration depth. The lifetime peak of the initial testing position (at the depth of ) appears at . In this way, the penetration depth can be confirmed in the position where the Ag NPs’ FLIM signal disappears with respect to the peak position. According to our experimental analysis, the Ag NPs’ signal at disappears at a depth of 12 to on average. The NP penetration depth could, therefore, be determined to be 12 to , thus not exceeding the SC thickness. Figure 2 represents the Ag NPs’ penetration profile inside the porcine skin. The Ag NPs’ signal intensity decreases strongly from 0 to , and below , it continues to decline, having completely disappeared at 12 to in depth. Below in depth, the Ag NPs’ signal approaches zero, showing that no Ag NPs exist in these depths. Fig. 1The average lifetime () distributions of silver nanoparticles (Ag NPs), stratum corneum (SC), and stratum spinosum (SS) (a) and Ag NPs–treated skin at a depth of 0 to (b). 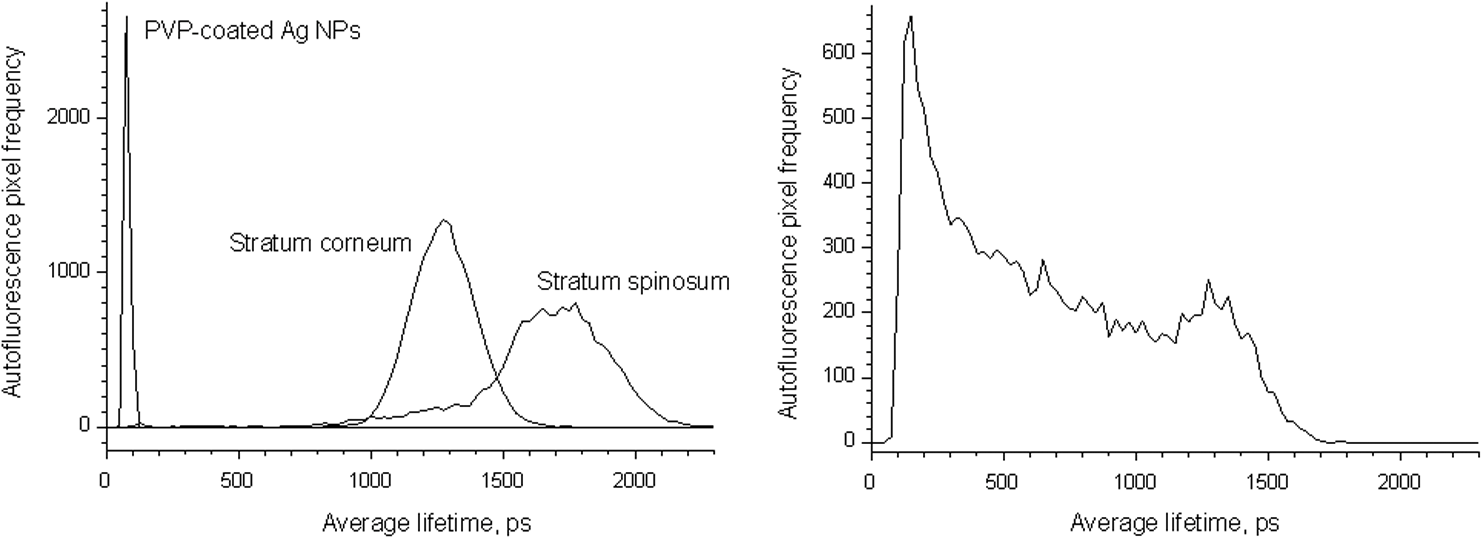 Fig. 2The penetration profile of Ag NPs into porcine skin obtained using fluorescence lifetime imaging microscopy technique.  Furthermore, according to the literature,13,44 normal skin has the amplitude coefficient, , values of AF between 50 and 90%, whereas values of denote the NP signals. Accordingly, the distribution curves could be obtained for Ag NPs, SC, and SS, which are shown in Fig. 3. The Ag NPs’ values are distributed in the range between 85 and 100%. Both SC’s and SS’s values vary between 40 and 85%, which is basically identical to the values in the reference literature. Using SPCImage 4.2 software, values were coded by a discrete color scale ranging from blue (), green (, ) to red (), which are shown in Fig. 4. Figure 4(a) is the amplitude distribution map on the skin surface, i.e., at the depth of . The green areas represent the SC FLIM information and the red is the Ag NPs. In Fig. 4(a), the Ag NPs are densely distributed on the surface of the skin. Figure 4(b) shows the amplitude distribution maps at a depth of . It can be seen that the Ag NPs’ signal has completely disappeared. 3.2.CRM ExperimentFigure 5 shows the Raman spectra of the PVP-coated Ag NPs and the PVP coating material. As can be seen, the PVP is a Raman active substance that does not contain any fluorescence signal. The PVP-coated Ag NPs, characterized by the strong fluorescence background, originated from the Ag NPs itself and not from the PVP coating. Prominent Raman peaks at 956, 1400, and are visible on the fluorescence background, which are shifted in comparison to the PVP’s Raman spectrum. The Raman peak at is the shifted peak of the PVP’s breathing ring mode at .45 The Raman peak at can be interpreted as the vibration of the carbonate,46,47 which may have been formed by the chemical interaction of Ag NPs’ and PVP’s atomic group. The peak at is the Raman signal that comes from PVP’s carbonyl bond stretching mode.45,48 Normally, this peak is observed at for PVP’s solid state, but its position is shifted in the solution, which can be explained by the partial donating of lone electrons of PVP to the vacant orbitals of the Ag atom.49,50 Fig. 5Raman spectra of the poly-N-vinylpyrrolidone (PVP)-coated Ag NPs (solid line) and PVP coating material (dotted line). 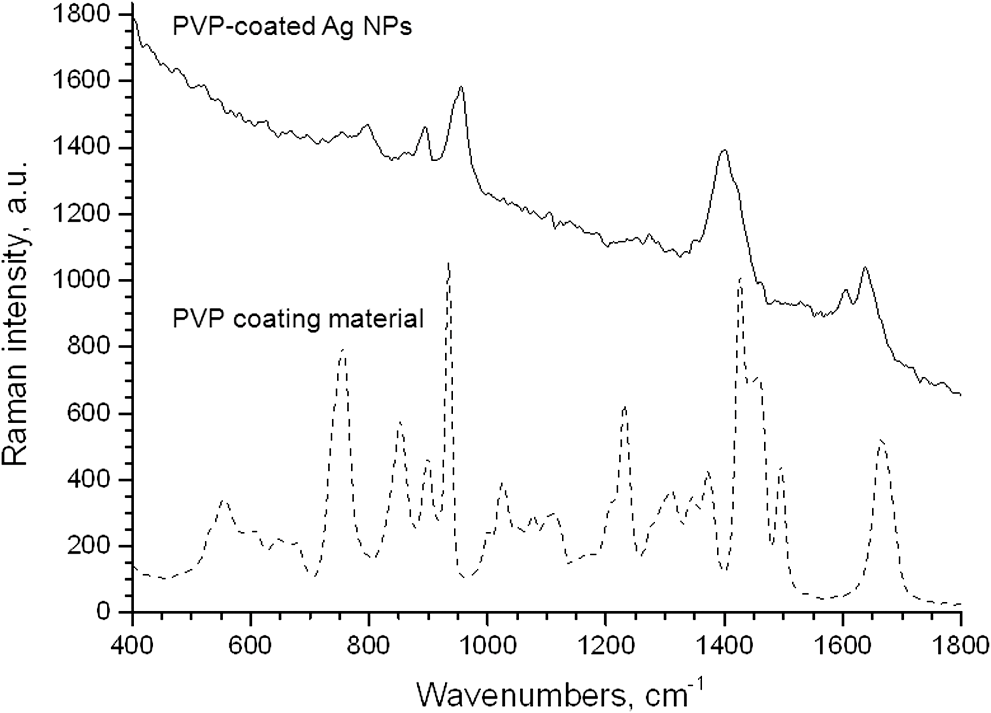 Figure 6 shows the Raman spectra of intact and PVP-coated Ag NPs’ pretreated porcine ear skin samples. The significant difference between these spectra is observed in the range of , which corresponds to the Raman peak at of the PVP-coated Ag NPs. Other peaks at 1400 and could not be evaluated in the skin due to their complete superposition with the skin Raman peaks. Fig. 6Raman spectra of the PVP-coated Ag NPs–treated skin and intact skin at a depth of and the difference between them. 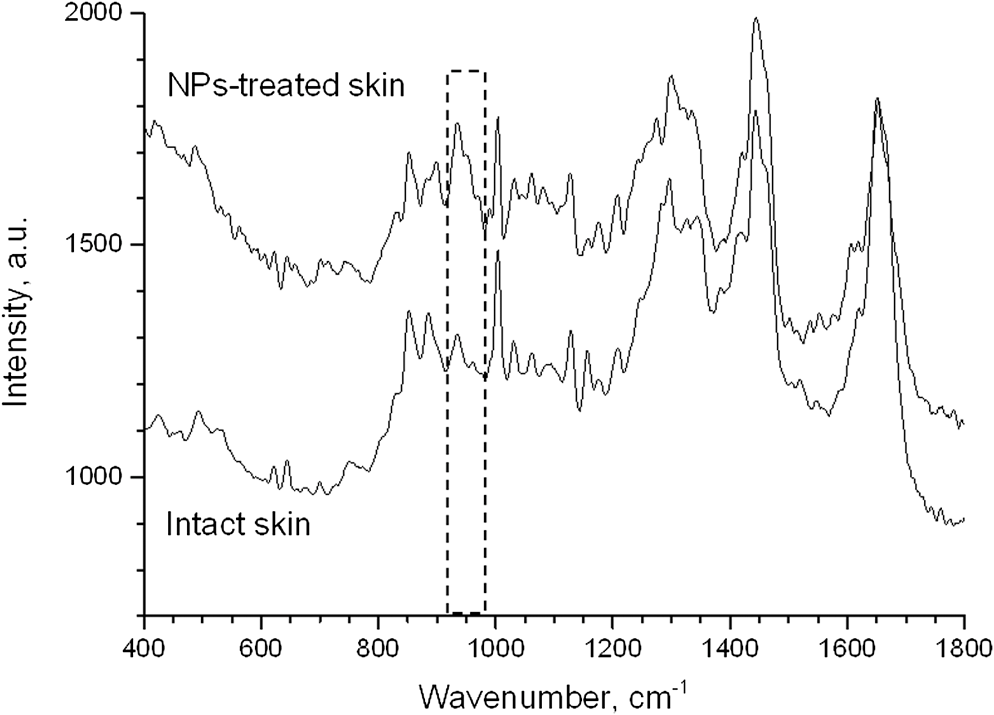 The NMF method is applied for analyzing the penetration depth of PVP-coated Ag NPs into the skin. The NMF method includes the fitting of the skin Raman spectra by the known model spectra of SC’s compounds, such as cholesterol, ceramide, keratin, urea, water, etc. Thus, the depth-dependent coefficients of each individual compound are determined, minimizing the residual fitting error. For the skin pretreated with PVP-coated Ag NPs, the same skin coefficients and an additional coefficient of PVP-coated Ag NPs could be determined. This depth-dependent coefficient serves as the PVP-coated Ag NPs’ relative concentration in the skin. The maximum of the PVP-coated Ag NPs’ concentration is observed near the skin surface. Then their concentration is exponentially decreased, disappearing completely at a depth of . The penetration profile of PVP-coated Ag NPs is shown in Fig. 7. Thus, the results obtained using CRM show that the majority of PVP-coated Ag NPs remains on the skin surface and in the superficial layers, and does not penetrate into the viable layers of the epidermis. 3.3.SERS ExperimentFigure 8 shows the exemplary SERS spectra of a PVP-coated Ag NPs’ pretreated porcine ear skin sample measured at the three different depths. The SERS spectra look completely different compared to the intact skin Raman spectrum, showing an almost five times higher intensity and another spectrum shape. As can be seen from Fig. 8, some small SERS peaks exist and disappear depending on the measured depth, but for all the skin depths, the three strong SERS peaks are always observed, e.g., , which corresponds to C-S stretching mode of the cystine component of keratin,25,51,52 , which corresponds to the stretching mode of the C-C backbone of the phenylalanine and urea,53,54 and , which corresponds to the stretching mode of proteins.55 As SERS peaks at 1003 and are superimposed on the intact skin Raman peaks, the peak position at was used for determining the penetration profiles of Ag NPs into the skin. By detecting the SERS signal intensity at , the penetration depth of Ag NPs is determined to be . The high standard deviation is explained by the fluctuation of SERS intensities and by the lack of SERS signal reproducibility. The generation of reproducible SERS spectra from the Ag NPs–treated skin will be a promising task for the future. The existence of a SERS signal in the skin shows that PVP coating material was dissolved in the SC and that Ag NPs were released. The optimal release conditions were not investigated in the present study and serve as a topic for future work. Fig. 8Surface-enhanced Raman scattering spectra of the PVP-coated Ag NPs–treated skin at different depths and Raman spectrum of intact skin at a depth of . 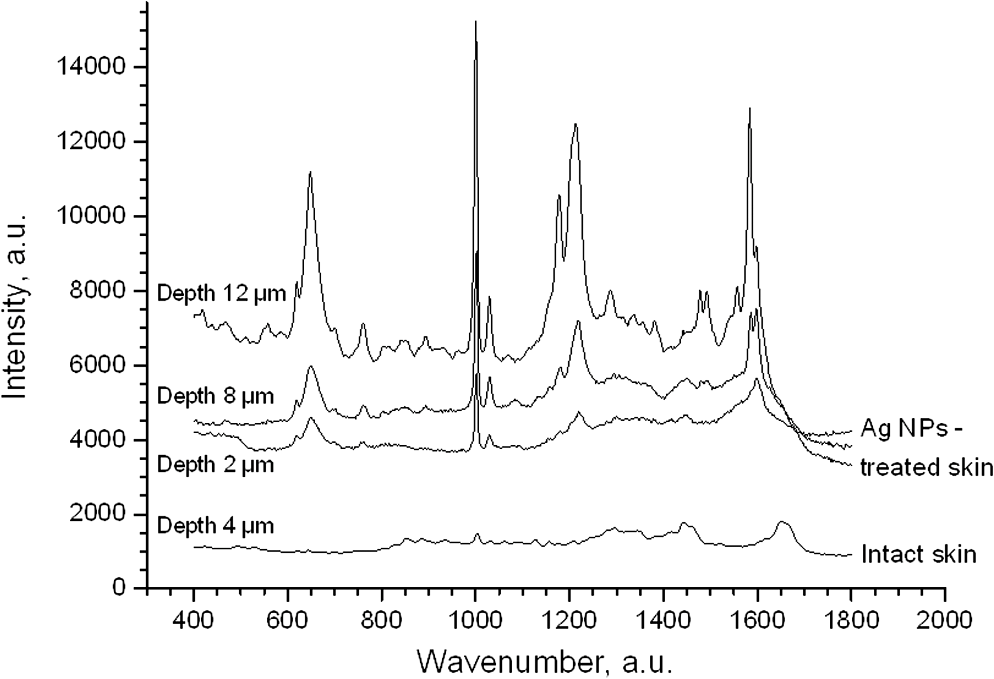 The intensity of SERS spectra at different depths could change significantly, showing a blinking effect that was mentioned in the literature.22 In fact, the SERS generation can be affected by many factors, such as NPs release efficiency, the aggregation of NPs, the shape, size, and periphery of NPs,29,56,57 and the coating influence. The depth-dependent intensity fluctuation could be caused by the discrete aggregation of Ag NPs in the skin tissue, by the differences in combining organic molecules to Ag NPs, and by the non-optimal release of Ag NPs from the PVP coating. Therefore, the penetration profile based on SERS analyses is not presented in this paper, but the maximal penetration depth was successfully determined. The appearance frequency of the SERS signal in the skin was determined at of the total measurement points. The obtained SERS spectra are similar to the SERS spectra of human tissue presented in the literature.22,25 4.ConclusionsIn the present study, the penetration of PVP-coated Ag NPs into porcine ear skin was investigated ex vivo by TPT-FLIM, CRM, and SERS methods. The TPT-FLIM method detected the penetration depth of Ag NPs based on the differences of AF lifetime distributions between cells (SC/SS) and NPs. The TPT-FLIM measurement clearly shows that the Ag NPs signal declined dramatically from the surface to in depth and then became much weaker and completely disappeared at a depth of 12 to . Thus, the TPT-FLIM method could confirm the maximum penetration depth of Ag NPs at . The mean penetration depth measured by CRM and analyzed using the NMF method was found to be . SERS is a very sensitive method capable of tracking a small group of Ag NPs. Using SERS microscopy, the penetration depth was found to be , which was also coincident with the TPT-FLIM results. According to the obtained results achieved by three different methods, it proved that the Ag NPs saturate the uppermost layers of the SC (). Only a small amount of Ag NPs could be detected in the SC’s deep layers, i.e., near the boundary to the SS layer (depths around 8 to ). However, several results obtained with SERS microscopy show that penetration depth of Ag NPs could exceed the SC thickness and reach the viable cells of the SS layer. This could be explained by both the penetration of trace amounts of Ag NPs through the SC barrier and by the measurements inside the hair follicle, which cannot be excluded in the experiment. As the results of several SERS measurements could be interpreted as the ability of a trace amount of Ag NPs to penetrate through the SC barrier, further investigations of the effects of the Ag NPs on the skin could be of interest since the toxic effects of Ag NPs on skin cell cultures were previously reported.7,58,59 The effect of Ag NPs release from the PVP coating material also serves a topic of future investigations. By comparing the applied methods, it could be established that the SERS technique is most sensitive for detecting the Ag NPs, but is also time-consuming due to the low frequency appearance of the SERS signal in the skin. The FLIM technique is sensitive enough and CRM has a low sensitivity, but both methods are well suited for the determination of Ag NPs penetration into the skin. AcknowledgmentsThis work was supported by the Deutsche Forschungsgemeinschaft (DFG), project SPP 1313 Bio-Nano-Responses, and the Collaborative Research Centre 1112 “Nanocarriers: Architecture, Transport, and Topical Application of Drugs for Therapeutic Use” of the German Research Foundation. The silver nanoparticles were kindly provided by the group of Matthias Epple [Inorganic Chemistry and Center for Nanointegration Duisburg-Essen (CeNIDE), University of Duisburg-Essen, Essen, Germany]. ReferencesM. AhamedM. S. AlsalhiM. K. Siddiqui,
“Silver nanoparticle applications and human health,”
Clin. Chim. Acta, 411
(23–24), 1841
–1848
(2010). http://dx.doi.org/10.1016/j.cca.2010.08.016 CCATAR 0009-8981 Google Scholar
S. ChernousovaM. Epple,
“Silver as antibacterial agent: ion, nanoparticle, and metal,”
Angew. Chem. Int. Ed. Engl., 52
(6), 1636
–1653
(2013). http://dx.doi.org/10.1002/anie.v52.6 ACIEAY 0570-0833 Google Scholar
S. W. P. Wijnhovenet al.,
“Nano-silver—a review of available data and knowledge gaps in human and environmental risk assessment,”
Nanotoxicology, 3
(2), 109
–U178
(2009). http://dx.doi.org/10.1080/17435390902725914 1743-5390 Google Scholar
A. P. Popovet al.,
“Effect of size of TiO(2) nanoparticles applied onto glass slide and porcine skin on generation of free radicals under ultraviolet irradiation,”
J. Biomed. Opt., 14
(2), 021011
(2009). http://dx.doi.org/10.1117/1.3078802 JBOPFO 1083-3668 Google Scholar
T. R. Kuoet al.,
“Chemical enhancer induced changes in the mechanisms of transdermal delivery of zinc oxide nanoparticles,”
Biomaterials, 30
(16), 3002
–3008
(2009). http://dx.doi.org/10.1016/j.biomaterials.2009.02.003 BIMADU 0142-9612 Google Scholar
T. Verano-Bragaet al.,
“Insights into the cellular response triggered by silver nanoparticles using quantitative proteomics,”
ACS Nano, 8
(3), 2161
–2175
(2014). http://dx.doi.org/10.1021/nn4050744 1936-0851 Google Scholar
S. Ahlberget al.,
“Comparison of silver nanoparticles stored under air or argon with respect to the induction of intracellular free radicals and toxic effects toward keratinocytes,”
Eur. J. Pharm. Biopharm.,
(2014). http://dx.doi.org/10.1016/j.ejpb.2014.07.012 EJPBEL 0939-6411 Google Scholar
M. A. MitchnickD. FairhurstS. R. Pinnell,
“Microfine zinc oxide (Z-cote) as a photostable UVA/UVB sunblock agent,”
J. Am. Acad. Dermatol., 40
(1), 85
–90
(1999). http://dx.doi.org/10.1016/S0190-9622(99)70532-3 JAADDB 0190-9622 Google Scholar
C. Greulichet al.,
“The toxic effect of silver ions and silver nanoparticles towards bacteria and human cells occurs in the same concentration range,”
RSC Adv., 2
(17), 6981
–6987
(2012). http://dx.doi.org/10.1039/c2ra20684f RSCACL 2046-2069 Google Scholar
B. SimoncicB. Tomsic,
“Structures of novel antimicrobial agents for textiles—a review,”
Text Res. J., 80
(16), 1721
–1737
(2010). http://dx.doi.org/10.1177/0040517510363193 TRJOA9 0040-5175 Google Scholar
K. VasilevJ. CookH. J. Griesser,
“Antibacterial surfaces for biomedical devices,”
Expert Rev. Med. Devices, 6
(5), 553
–567
(2009). http://dx.doi.org/10.1586/erd.09.36 1743-4440 Google Scholar
Y. T. WuY. G. AnissimovM. S. Roberts,
“Introduction to dermatokinetics,”
Dermatokinetics of Therapeutic Agents, 228 CRC Press, Boca Raton
(2011). Google Scholar
V. R. Leite-Silvaet al.,
“The effect of formulation on the penetration of coated and uncoated zinc oxide nanoparticles into the viable epidermis of human skin in vivo,”
Eur. J. Pharm. Biopharm., 84
(2), 297
–308
(2013). http://dx.doi.org/10.1016/j.ejpb.2013.01.020 EJPBEL 0939-6411 Google Scholar
F. F. Lareseet al.,
“Human skin penetration of silver nanoparticles through intact and damaged skin,”
Toxicology, 255
(1–2), 33
–37
(2009). http://dx.doi.org/10.1016/j.tox.2008.09.025 TXCYAC 0300-483X Google Scholar
R. Georgeet al.,
“In vivo analysis of dermal and systemic absorption of silver nanoparticles through healthy human skin,”
Australas. J. Dermatol., 55
(3), 185
–190
(2014). http://dx.doi.org/10.1111/ajd.12101 AJDEBP 0004-8380 Google Scholar
M. E. SambergS. J. OldenburgN. A. Monteiro-Riviere,
“Evaluation of silver nanoparticle toxicity in skin in vivo and keratinocytes in vitro,”
Environ. Health Persp., 118
(3), 407
–413
(2010). http://dx.doi.org/10.1289/ehp.0901398 EVHPAZ 0091-6765 Google Scholar
S. Kokuraet al.,
“Silver nanoparticles as a safe preservative for use in cosmetics,”
Nanomedicine, 6
(4), 570
–574
(2010). http://dx.doi.org/10.1016/j.nano.2009.12.002 1743-5889 Google Scholar
U. Jacobiet al.,
“Porcine ear skin: an in vitro model for human skin,”
Skin Res. Technol., 13
(1), 19
–24
(2007). http://dx.doi.org/10.1111/srt.2007.13.issue-1 0909-752X Google Scholar
M. E. Darvinet al.,
“Comparison of in vivo and ex vivo laser scanning microscopy and multiphoton tomography application for human and porcine skin imaging,”
Quantum Electron+, 44
(7), 646
–651
(2014). http://dx.doi.org/10.1070/QE2014v044n07ABEH015488 QUELEZ 1063-7818 Google Scholar
M. S. Robertset al.,
“Non-invasive imaging of skin physiology and percutaneous penetration using fluorescence spectral and lifetime imaging with multiphoton and confocal microscopy,”
Eur. J. Pharm. Biopharm., 77
(3), 469
–488
(2011). http://dx.doi.org/10.1016/j.ejpb.2010.12.023 EJPBEL 0939-6411 Google Scholar
A. Bankapuret al.,
“Micro-Raman spectroscopy of silver nanoparticle induced stress on optically-trapped stem cells,”
PLoS One, 7
(4), e35075
(2012). http://dx.doi.org/10.1371/journal.pone.0035075 1932-6203 Google Scholar
H. Huanget al.,
“Silver nanoparticle based surface enhanced Raman scattering spectroscopy of diabetic and normal rat pancreatic tissue under near-infrared laser excitation,”
Laser Phys. Lett., 10
(4), 045603
(2013). http://dx.doi.org/10.1088/1612-2011/10/4/045603 1612-2011 Google Scholar
S. M. Aliet al.,
“Raman spectroscopic analysis of human skin tissue sections ex-vivo: evaluation of the effects of tissue processing and dewaxing,”
J. Biomed. Opt., 18
(6), 061202
(2013). http://dx.doi.org/10.1117/1.JBO.18.6.061202 JBOPFO 1083-3668 Google Scholar
L. Silveira Jr.et al.,
“Discriminating model for diagnosis of basal cell carcinoma and melanoma in vitro based on the Raman spectra of selected biochemicals,”
J. Biomed. Opt., 17
(7), 077003
(2012). http://dx.doi.org/10.1117/1.JBO.17.7.077003 JBOPFO 1083-3668 Google Scholar
Z. F. Liet al.,
“Surface-enhanced Raman spectroscopy for differentiation between benign and malignant thyroid tissues,”
Laser Phys. Lett., 11
(4), 045602
(2014). http://dx.doi.org/10.1088/1612-2011/11/4/045602 1612-2011 Google Scholar
C. D’Andreaet al.,
“Synthesis by pulsed laser ablation in Ar and SERS activity of silver thin films with controlled nanostructure,”
Laser Phys., 21
(4), 818
–822
(2011). http://dx.doi.org/10.1134/S1054660X11070048 LAPHEJ 1054-660X Google Scholar
X. B. Xuet al.,
“Near-field enhanced plasmonic-magnetic bifunctional nanotubes for single cell bioanalysis,”
Adv. Funct. Mater., 23
(35), 4332
–4338
(2013). http://dx.doi.org/10.1002/adfm.v23.35 AFMDC6 1616-3028 Google Scholar
C. YuenQ. Liu,
“Towards in vivo intradermal surface enhanced Raman scattering (SERS) measurements: silver coated microneedle based SERS probe,”
J. Biophotonics, 7
(9), 683
–689
(2014). http://dx.doi.org/10.1002/jbio.201300006 JBOIBX 1864-063X Google Scholar
J. V. JokerstC. PohlingS. S. Gambhir,
“Molecular imaging with surface-enhanced Raman spectroscopy nanoparticle reporters,”
MRS Bull., 38
(8),
(2013). http://dx.doi.org/10.1557/mrs.2013.157 MRSBEA 0883-7694 Google Scholar
P. K. RoyY. F. HuangS. Chattopadhyay,
“Detection of melamine on fractals of unmodified gold nanoparticles by surface-enhanced Raman scattering,”
J. Biomed. Opt., 19
(1), 011002
(2014). http://dx.doi.org/10.1117/1.JBO.19.1.011002 JBOPFO 1083-3668 Google Scholar
E. Garaiet al.,
“High-sensitivity, real-time, ratiometric imaging of surface-enhanced Raman scattering nanoparticles with a clinically translatable Raman endoscope device,”
J. Biomed. Opt., 18
(9), 096008
(2013). http://dx.doi.org/10.1117/1.JBO.18.9.096008 JBOPFO 1083-3668 Google Scholar
D. Mahlet al.,
“Possibilities and limitations of different analytical methods for the size determination of a bimodal dispersion of metallic nanoparticles,”
Colloid Surf. A, 377
(1–3), 386
–392
(2011). http://dx.doi.org/10.1016/j.colsurfa.2011.01.031 0927-7757 Google Scholar
K. Lozaet al.,
“The dissolution and biological effects of silver nanoparticles in biological media,”
J. Mater. Chem. B, 2
(12), 1634
–1643
(2014). http://dx.doi.org/10.1039/c3tb21569e JMACEP 0959-9428 Google Scholar
K. KonigI. Riemann,
“High-resolution multiphoton tomography of human skin with subcellular spatial resolution and picosecond time resolution,”
J. Biomed. Opt., 8
(3), 432
–439
(2003). http://dx.doi.org/10.1117/1.1577349 JBOPFO 1083-3668 Google Scholar
M. E. Darvinet al.,
“Safety assessment by multiphoton fluorescence/second harmonic generation/hyper-Rayleigh scattering tomography of ZnO nanoparticles used in cosmetic products,”
Skin Pharmacol. Physiol., 25
(4), 219
–226
(2012). http://dx.doi.org/10.1159/000338976 SPPKE6 1660-5527 Google Scholar
H. G. Breuniget al.,
“Clinical coherent anti-Stokes Raman scattering and multiphoton tomography of human skin with a femtosecond laser and photonic crystal fiber,”
Laser Phys. Lett., 10
(2), 025604
(2013). http://dx.doi.org/10.1088/1612-2011/10/2/025604 1612-2011 Google Scholar
P. J. Casperset al.,
“In vivo confocal Raman microspectroscopy of the skin: noninvasive determination of molecular concentration profiles,”
J. Invest. Dermatol., 116
(3), 434
–442
(2001). http://dx.doi.org/10.1046/j.1523-1747.2001.01258.x JIDEAE 0022-202X Google Scholar
A. N. BashkatovE. A. GeninaV. V. Tuchin,
“Optical properties of skin, subcutaneous, and muscle tissues: a review,”
J. Innov. Opt. Health Sci., 4
(01), 9
–38
(2011). http://dx.doi.org/10.1142/S1793545811001319 JIOHAA 1793-5458 Google Scholar
J. Lademannet al.,
“In vivo Raman spectroscopy detects increased epidermal antioxidative potential with topically applied carotenoids,”
Laser Phys. Lett., 6
(1), 76
–79
(2009). http://dx.doi.org/10.1002/lapl.v6:1 1612-2011 Google Scholar
M. E. Darvinet al.,
“In vivo distribution of carotenoids in different anatomical locations of human skin: comparative assessment with two different Raman spectroscopy methods,”
Exp. Dermatol., 18
(12), 1060
–1063
(2009). http://dx.doi.org/10.1111/exd.2009.18.issue-12 EXDEEY 0906-6705 Google Scholar
P. D. A. Pudneyet al.,
“An in vivo confocal Raman study of the delivery of trans-retinol to the skin,”
Appl. Spectrosc., 61
(8), 804
–811
(2007). http://dx.doi.org/10.1366/000370207781540042 APSPA4 0003-7028 Google Scholar
M. E. Darvinet al.,
“Optical methods for noninvasive determination of carotenoids in human and animal skin,”
J. Biomed. Opt., 18
(6), 061230
(2013). http://dx.doi.org/10.1117/1.JBO.18.6.061230 JBOPFO 1083-3668 Google Scholar
C.-S. ChoeJ. LademannM. E. Darvin,
“Gaussian-function-based deconvolution method to determine the penetration ability of petrolatum oil into in vivo human skin using confocal Raman microscopy,”
Laser Phys., 24 105601
(2014). http://dx.doi.org/10.1088/1054-660X/24/10/105601 LAPHEJ 1054-660X Google Scholar
L. L. Linet al.,
“Time-correlated single photon counting for simultaneous monitoring of zinc oxide nanoparticles and NAD(P)H in intact and barrier-disrupted volunteer skin,”
Pharm. Res., 28
(11), 2920
–2930
(2011). http://dx.doi.org/10.1007/s11095-011-0515-5 PHREEB 0724-8741 Google Scholar
C. J. Leeet al.,
“A comparison method of silver nanoparticles prepared by the gamma irradiation and in situ reduction methods,”
Bull. Korean Chem. Soc., 31
(7), 1993
–1996
(2010). http://dx.doi.org/10.5012/bkcs.2010.31.7.1993 BKCSDE 0253-2964 Google Scholar
J. T. KloproggeL. HickeyR. L. Frost,
“FT-Raman and FT-IR spectroscopic study of synthetic Mg/Zn/Al-hydrotalcites,”
J. Raman Spectrosc., 35
(11), 967
–974
(2004). http://dx.doi.org/10.1002/(ISSN)1097-4555 JRSPAF 0377-0486 Google Scholar
M. J. Hernandez-Morenoet al.,
“IR characteristics of hydrotalcite-like compounds,”
Phys. Chem. Miner., 12
(1), 34
–38
(1985). http://dx.doi.org/10.1007/BF00348744 PCMIDU 0342-1791 Google Scholar
D. L. A. de FariaH. A. C. GilA. A. A. de Queiroz,
“The interaction between polyvinylpyrrolidone and I-2 as probed by Raman spectroscopy,”
J. Mol. Struct., 478
(1–3), 93
–98
(1999). http://dx.doi.org/10.1016/S0022-2860(98)00755-8 JMOSB4 0022-2860 Google Scholar
Z. T. ZhangB. ZhaoL. M. Hu,
“PVP protective mechanism of ultrafine silver powder synthesized by chemical reduction processes,”
J. Solid State Chem., 121
(1), 105
–110
(1996). http://dx.doi.org/10.1006/jssc.1996.0015 JSSCBI 0022-4596 Google Scholar
H. S. Wanget al.,
“Mechanisms of PVP in the preparation of silver nanoparticles,”
Mater. Chem. Phys., 94
(2–3), 449
–453
(2005). http://dx.doi.org/10.1016/j.matchemphys.2005.05.005 MCHPDR 0254-0584 Google Scholar
N. Stoneet al.,
“Near-infrared Raman spectroscopy for the classification of epithelial pre-cancers and cancers,”
J. Raman Spectrosc., 33
(7), 564
–573
(2002). http://dx.doi.org/10.1002/(ISSN)1097-4555 JRSPAF 0377-0486 Google Scholar
W. T. Chenget al.,
“Micro-Raman spectroscopy used to identify and grade human skin pilomatrixoma,”
Microsc. Res. Tech., 68
(2), 75
–79
(2005). http://dx.doi.org/10.1002/(ISSN)1097-0029 MRTEEO 1059-910X Google Scholar
J. W. Chanet al.,
“Micro-Raman spectroscopy detects individual neoplastic and normal hematopoietic cells,”
Biophys. J., 90
(2), 648
–656
(2006). http://dx.doi.org/10.1529/biophysj.105.066761 BIOJAU 0006-3495 Google Scholar
M. EgawaY. Sato,
“In vivo evaluation of two forms of urea in the skin by Raman spectroscopy after application of urea-containing cream,”
Skin Res. Technol.,
(2014). http://dx.doi.org/10.1111/srt.12184 0909-752X Google Scholar
S. Sigurdssonet al.,
“Detection of skin cancer by classification of Raman spectra,”
IEEE Trans. Biomed. Eng., 51
(10), 1784
–1793
(2004). http://dx.doi.org/10.1109/TBME.2004.831538 IEBEAX 0018-9294 Google Scholar
D. Ciallaet al.,
“Surface-enhanced Raman spectroscopy (SERS): progress and trends,”
Anal. Bioanal. Chem., 403
(1), 27
–54
(2012). http://dx.doi.org/10.1007/s00216-011-5631-x ABCNBP 1618-2642 Google Scholar
M. Erolet al.,
“SERS not to be taken for granted in the presence of oxygen,”
J. Am. Chem. Soc., 131
(22), 7480
–7481
(2009). http://dx.doi.org/10.1021/ja807458x JACSAT 0002-7863 Google Scholar
P. V. AshaRaniet al.,
“Cytotoxicity and genotoxicity of silver nanoparticles in human cells,”
ACS Nano, 3
(2), 279
–290
(2009). http://dx.doi.org/10.1021/nn800596w 1936-0851 Google Scholar
S. Kimet al.,
“Oxidative stress-dependent toxicity of silver nanoparticles in human hepatoma cells,”
Toxicol. In Vitr., 23
(6), 1076
–1084
(2009). http://dx.doi.org/10.1016/j.tiv.2009.06.001 TIVIEQ 0887-2333 Google Scholar
BiographyYongjian Zhu received his PhD from the Shanghai Institute of Optics and Fine Mechanics, Chinese Academy of Sciences, in 2007. He was a visiting scholar at the Charité–Universitaetsmedizin Berlin from 2013 to 2014. Currently, he is a vice professor at Zhejiang University of Science and Technology. His research interests focus on two-photon fluorescence lifetime measuring technology, optical manufacturing and testing methods, etc. Chun-Sik Choe studied medical physics at Kim Il Sung University. After graduation, he researched the application of spectroscopic methodologies in medicine at the same university. From 2013 to 2014, he was a research fellow at the Center of Experimental and Applied Cutaneous Physiology (CCP), focusing his research mainly on the drug penetration profile of the skin by means of Raman microscopy. Sebastian Ahlberg studied at Otto-von-Guericke-University Magdeburg and graduated in biosystems engineering. He is working on his PhD thesis on the detection of nanoparticle-induced oxidative stress on human skin and skin cells. His research interest is focused on investigating the penetration of nanoparticles into the skin and uptake by cells using microscopic imaging techniques and detecting oxidative stress mediators by means of EPR spectroscopy. Martina C. Meinke studied chemistry at the Free University of Berlin and did her PhD in 1994. After graduation, she built up and headed a laboratory for environmental analysis in Brandenburg until 1999. Then she switched to the medical diagnostics field and was employed by the Charité–Universitaetsmedizin Berlin. Since 2007, she has been assistant professor for medical physics. Her main focus is on optical spectroscopy and diagnostics of blood and skin. Ulrike Alexiev is leader of the working group Molecular Biophysics–Structural Dynamics and Function of Biological Systems at the Freie Universität Berlin. She is currently working on the investigation of proton transport, dynamics, and conformational changes in transmembrane proteins and the detailed dissection of the structural, physical, and chemical parameters affecting conformational changes in proteins. Furthermore, she elucidates the exact nature of the molecular mechanisms behind membrane receptors. Juergen Lademann graduated from the Moscow State University, Physical Faculty, Quantum Electronics Department in 1980. Since 2000, he has been heading the Center of Experimental and Applied Cutaneous Physiology at the Department of Dermatology, Charité–Universitätsmedizin Berlin. In 2001, he was appointed professor of dermatology. He is on the editorial boards of several peer-reviewed journals and joined various international committees. His main focus is on drug penetration, skin physiology, laser techniques, and spectroscopy. Maxim E. Darvin studied at the Moscow State Engineering Physics Institute, the Faculty of Experimental and Theoretical Physics, Department of Medical Physics, where he completed his master’s degree in physics. After a postgraduate study, he was awarded the titles Dr. rer. med. in 2007 at Humboldt University of Berlin, Germany, and Dr. rer. nat. in 2010 at Saratov State University, Russia. His main interests are laser techniques, spectroscopy, biophysics, and skin physiology. |