
|
|
1.IntroductionThe loss of bone fracture resistance as occurs in osteoporosis and with aging, is not solely due to a decrease in bone mass but likely involves deleterious changes to tissue organization, including both the mineral phase and the organic matrix. Current x-ray-based clinical diagnostics predominantly assess bone strength through analysis of mineral density1,2 and macrostructure or microarchitecture.3 However, changes to other material properties including toughness and fracture toughness may also contribute to fracture risk. In fact, Burstein et al.4 found that the age-related decrease in human bone toughness is greater than the age-related decrease in material strength at the apparent-level, suggesting that brittleness, not just weakness, lowers fracture resistance with age. To complement existing clinical diagnostics, many in the photonics field have begun to explore the use of Raman Spectroscopy (RS) due to its potential to concurrently and noninvasively quantify the biochemical signature of both mineral and collagen.5 However, RS is traditionally limited to biochemical content without directly assessing matrix organization. Recently, the link inherent between polarization of the Raman phenomenon and structural organization of crystals and birefringent molecules6,7 has been extended to tissue,8 specifically the collagen matrix.9,10 Polarization RS may overcome the traditional structural limitations and improve the ability of RS to explore the underlying mechanisms that influence fracture resistance. The effect of genetic disease on bone is often studied using rodent models as a means to understand the mechanisms linking cellular action to tissue biomechanics as shown in several RS studies of bone quality.11–13 Osteogenesis imperfecta (OI) is perhaps the best characterized human disease of brittle bone; OI is known to be a disease of collagen organization;14–16 and the RS peaks of OI mouse models change with polarization.17 This is perhaps not too surprising, given a growing body of evidence that polarized Raman intensity varies with collagen direction10,18 and can even be used to determine collagen orientation in bone.19 Other genetic mouse models have also demonstrated brittle bone phenotypes that are not necessarily explained by composition but are related to matrix organization,20,21 and hence may benefit from polarization RS. We recently reported that there are polarization-related changes in the RS peak ratios of bones lacking the activating transcription factor 4 (ATF4), implying an organizational component to the phenotype that includes toughness loss and decreased fracture toughness,22 but it is unclear to what extent these polarization RS changes are predictive of mechanical bone quality. This is especially interesting given that mice lacking the matrix metalloproteinase (MMP9) exhibit no changes in standard RS peak ratios even though they, too, have low bone toughness.23 In translucent, pure media, polarization-related changes in RS intensities can be quantified relative to theory using a depolarization ratio () to assess molecular orientation;6 however, in turbid media like bone, this is confounded by the light scattering properties of tissue. Therefore, the effect of specific optics instrumentation, including the degree of confocality,17 on RS peaks needed to be characterized prior to implementing assessment of bone organization with polarization RS. For different objectives ( and ), we previously showed that observable changes in Raman intensity in polarization sensitive peaks with bone orientation occur across microstructural features of human tissue samples24 such that the phosphate peak is regularly out of phase with amide I. However, traditional peak ratios only report a small portion of the known spectral changes that occur with polarization as previously characterized by others.8,18,25–27 Moreover, limiting analysis to established peak ratios may overlook crucial aspects of complex toughness phenotypes if they manifest as subtle peak widening or shifting. RS analyses of bone are often limited to a set of strong peak intensities and validated peak ratios,28 including only the characteristic frequencies and relative composition of bone. In the absence of the complexity of tissue, RS is often applied to pure crystalline and polymeric materials (i) to analyze stress and strain using Raman shift changes;29,30 (ii) to determine orientation as a function of peak polarization;31 and (iii) to assess crystal quality and deformation using peak width.32 Although each would require significant empirical support to extend mechanistically to analysis of turbid bone tissue, unsupervised multivariate analysis allows for the influence of these known RS sensitivities to be related to mechanical outcomes without spurious mechanistic suppositions. Indeed, recent applications of multivariate RS analyses to bone have helped explain the fracture toughness of bone in a model of rheumatoid arthritis33 as well as partial mechanical improvement of OI mouse bones after human stem cell transplant.34 Therefore, we investigated the potential of full spectrum multivariate analysis with a “bottom-up” design built upon the principal directions of Raman variance between test groups. Using both ATF4 and MMP9 mouse models in which peak ratios alone did not fully explain the mechanical phenotype, we hypothesized that analysis of all wavenumbers within the RS “fingerprint region,” while including polarization information, would improve the ability of RS to classify knockout mice of a brittle phenotype (versus wild-type of the same strain) and subsequently improve RS correlation to mechanical measures of toughness. However, this may not be the case for mechanical properties like strength that can be attributed to composition more than organization. To this end, we scanned excised intact femurs of both Atf4−/− and Mmp9−/− mice and their corresponding controls for two different orientations at a consistent anatomical location on the anterior midshaft. Using single (less sensitivity to polarization) or paired data (more sensitivity to polarization), peak ratios and principal components were tested for the ability to explain the toughness difference between genotypes. 2.Methods2.1.Study DesignAll procedures were approved by the Institutional Animal Care and Use Committee (IACUC) at Vanderbilt University Medical Center. Femurs were harvested from young adult male mice (unless otherwise noted), stripped of musculature and stored frozen at in phosphate buffered saline until analysis. Freeze thaw cycles were minimized and remained consistent among samples within a study to prevent known35 degradation of Raman signals. Contamination from modeling clay used for temporarily mounting samples and any notable mechanical damage (stress fractures or scratches) to femurs were grounds for exclusion from the study, such that a total of six femurs were excluded. To provide a known profile of toughness loss, 15 Atf4+/+ and 9 Atf4−/− male mice at 20 weeks of age were sacrificed as part of a previously published study.22 Male siblings from a previous MMP9 study involving female mice23 provided 7 Mmp9+/+ and 6 Mmp9−/− femurs at 16 weeks of age. A larger study of MMP9 mice from a different colony (7 wild-type and 5 knockout males and 7 wild-type and 9 knockout females) was used to establish the robustness of the multivariate, polarization approach to analysis. Finally, femurs were collected from wild-type mice (ATF4 colony) at both 8 weeks of age () and 20 weeks of age (). Because bone strength (which is frequently associated with compositional changes) increases during maturation, but toughness remains relatively constant, RS polarization specificity to organization changes postulated to affect toughness were examined further. 2.2.Microcomputed Tomography () ScansPrior to mechanical testing, the femoral midshafts were scanned (, Scanco Medical, Brüttisellen, Switzerland) at an isotropic voxel size of using consistent settings (; 1000 projections per 360-deg rotation; and 300-ms integration time), calibrated to a hydroxyapatite (HA) phantom and corrected for beam hardening using manufacturer’s specifications. The outer cortex was contoured to calculate tissue mineral density (Ct.TMD) of cortical bone as well as the structural properties.22 The consistent segmentation procedure entailed a global threshold of and a Gaussian noise filter ( with support of 2 voxels). 2.3.Mechanical Testing ProtocolThree point bending tests of hydrated, intact femurs23 were conducted using a bench-top, material testing system (Dynamight 8841, Instron, Canton, Ohio) with a span () of six times the mean outer anterior–posterior diameter (i.e., in the direction of loading) of each group () and a loading rate of . Force data were recorded at 50 Hz from a 100-N load cell (Honeywell, Ohio) while the linear variable displacement transducer recorded displacement. Whole bone strength was the peak force () endured by the midshaft. Using the moment of inertia () of the midshaft and the distance between the centroid and the bone surface in the anterior–posterior direction () from , we estimated the material strength from standard flexural equations.36 Toughness was defined as the area under the force versus displacement curve divided by the bone cross-sectional area.37 2.4.Raman SpectroscopyRaman spectra were acquired from the anterior midshaft of the intact extracted femurs of each animal femur prior to mechanical testing using a standard confocal Raman microscope (Renishaw InVia Raman Microscope, Renishaw, Hoffman Estates, Illinois) set to a slit opening at spectral resolution, and equipped with a () objective and a mode stabilized TEM (0, 0) 785-nm laser diode source (Innovative Photonic Solutions, Monmouth Junction, New Jersey), and a holographic grating. Laser power was measured daily at the sample before and after measurements to ensure consistent exposure to 35-mW laser power. To eliminate grating bias according to Renishaw specifications, the polarization was aligned upright within the instrument (left-right when operator faces stage), confirmed with known polarizers and silicon standard intensity. Laser polarization was then confirmed to have an approximate extinction ratio of (light was not further polarized by additional optics). The spot size was approximated at and was Gaussian via edge detection on a polished silicon standard.38 System Raman shift calibration was accomplished using a neon lamp and a silicon standard with Renishaw software to account for grating motion. Daily silicon measurements before and after data collection ensured consistency of wavenumber calibration and collection arm throughput. The third distal midshaft vessel perforation was used as a landmark to consistently select the site of analysis across bones.39 Bones were thawed to room temperature, mounted on a standard microscope slide using modeling clay, then attached to a rotation stage (accurate to 5 arcsec) to ensure that the plane of the anterior midshaft would be normal to the incident laser beam. Spectra were collected at two intact bone orientations such that the long bone axis was oriented either parallel (termed the longitudinal orientation) or perpendicular (termed the orthogonal orientation) to the polarization axis of the incident laser. Colocalization of collection sites before and after rotation was manually accomplished by registering fine structural features in the bright field. Both our work24 and that of Kazanci et al.9,40 have previously shown that the RS of two orthogonal orientations of human cortical bone provides information about tissue organization. However, this does not imply that the use of a true depolarization ratio as defined by Porto et al.6 is straightforward for bone. Presently, using the depolarization ratio on the full spectrum from intact mouse femurs inappropriately changed data shape, where the division by “near-zero” values inflated the variance of regions with little biochemical significance (Fig. 1). Moreover, there has been recent evidence that in structured materials, the use of the depolarization ratio is not always accurate for the quantification of fiber orientation.41 Fig. 1Depolarization ratio spectrum overlaid on average Raman spectrum of mouse bone shows how the depolarization ratio skews data shape. After the mathematical operation, data variance is located in baseline regions, instead of at peaks where changes are occurring. 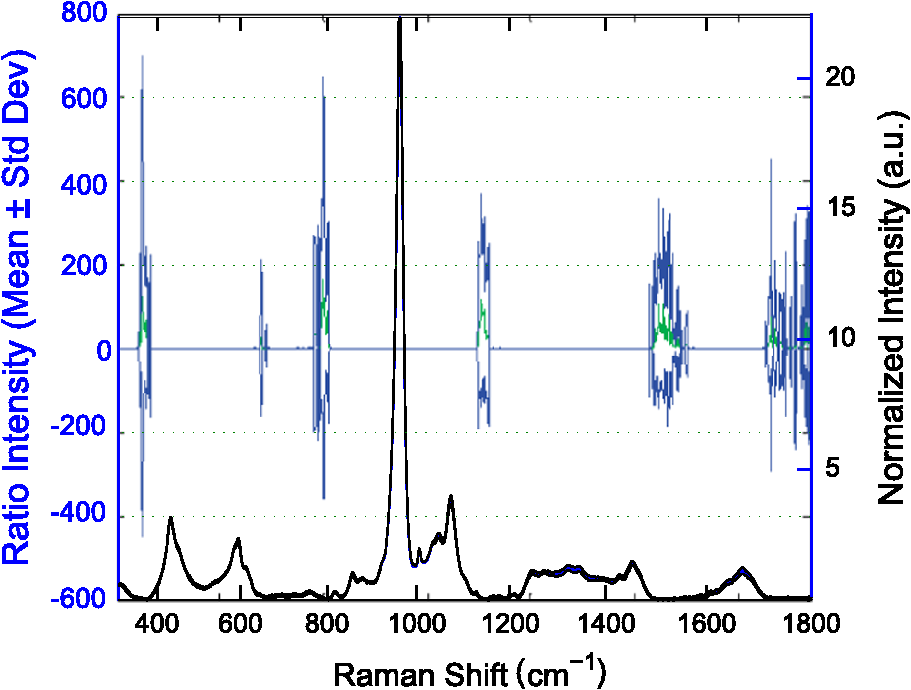 Each spectrum consisted of five accumulations of 10-s integration time to yield a high signal-to-noise ratio (SNR) from 300 to (Hydroxyproline SNR in excess of 25:1). Spectra were processed via least squares modified polynomial fit42 and smoothed for noise using a second-order Savitsky–Golay filter.43 Custom MATLAB software (Mathworks, Natick, Massachusetts) extracted the intensity and wavenumber of the prominent spectral peaks. There was no spectral binning in this analysis. After fluorescence subtraction, a linear baseline subtraction (based on derivative zero-crossings neighboring the peak) was conducted on peaks that overlap with neighboring constituents to ensure no residual fluorescence (namely proline, hydroxyproline, phosphate, and carbonate). This data was then used to generate markers of bone composition for mineralization (), carbonate substitution () and crystallinity (crystal grain size and perfection, determined by the inverse full-width at half maximum intensity of the phosphate peak). 2.5.Multivariate Data Analysis and StatisticsMultivariate analysis of RS was used to analyze spectral wavenumbers beyond the validated peak ratios that are usually reported. Principal components analysis (PCA) was selected due to its unsupervised nature of computing fundamental uncorrelated directions of variance using eigenvectors, accomplished using a package with options tailored for spectroscopy (Eigenvector Research Inc., package for MATLAB 7). Prior to PCA, data was “auto scaled,” which is the same as “z-scoring” or running PCA on the correlation matrix, such that each variable or wavenumber was set to zero mean and unit variance. This is essential in PCA of Raman spectra where certain peaks (like phosphate in bone) have a much higher intensity than others, which could inaccurately skew the ability of PCA to predict the mechanical properties of bone. Because the Raman signal of bone likely contains much more information than that which relates to mechanics, PC’s are selected for analysis by screening for those that significantly separate genotype or class. PC’s were first screened by F-test of variance and Lillefor’s test for normality. Failing normality in all cases, nonparametric Mann–Whitney U tests were used to test significance at (). For PC’s significantly separating data class, sparse multinomial logistic regression (SMLR; Duke University) was used to test for best classification. SMLR is an iterative multivariate weighting technique that allows for sparsity or the exclusion of features (or in this case PC’s) that do not help discriminate class. Note that a statistically significant difference in a Raman property between genotypes does not necessarily imply that the property should have some ability to classify genotype. Briefly, SMLR was run with a Laplacian prior, a direct kernel, no bias, no normalization, component–wise updates, and leave-one-sample-out cross-validation. In leave-one-out cross validation, the final classification accuracy is based upon the cumulative classification of the validation set (the sample left out). Therefore, if the sample left out at each iteration is always misclassified for that iteration, the accuracy can reach 0%. The algorithm was run for various weights of sparsity index (, 1, 10, 50) to ensure optimal classification. Because SMLR is an iterative, kernel-based technique, it does not compress to a univariate logistic regression in all cases; therefore, for an appropriate comparison, classification using peak ratios was also evaluated using SMLR. In all cases, single principal components yielded better classification than multiple principal components in the same SMLR computation; therefore, Spearman’s correlations were run on single PC’s to test the explanation of bending strength and toughness. 3.Results3.1.Differences in Raman Spectra between Genotypes Become Apparent upon Bone Rotation (Polarization)Despite the strong toughness reduction in Atf4−/− mice (Fig. 2), only slight changes in RS peaks [Figs. 3(a)–3(c)] are seen at any one orientation. To investigate whether differences exist between the genotypes in ways beyond traditional peaks and peak ratios, the effect of bone rotation on the Raman spectra of bone was examined [Figs. 3(d) and 3(e)]. Upon bone rotation with respect to laser polarization, both Atf4+/+ [Fig. 3(d)] and Atf4−/− [Fig. 3(e)] RS profiles changed at previously identified polarization-sensitive regions (Fig. 4) including the shoulder of phosphate (), the phosphate peak (),8 the amide III band (),26,44 and amide I band,9 demonstrating statistically significant differences between orientations ( Mann Whitney U). The spectra of Atf4−/− bone had smaller variance than Atf4+/+ bone at amide III band and the amide I band, yielding greater separation between orientations than its wild-type counterpart. Fig. 2Toughness differences in Atf4 and Mmp9, unlike strength changes in maturation, are not associated with changes in tissue mineral density (TMD). Atf4 demonstrates isolation of toughness loss (b) without significant changes in strength (a) or TMD (c). Mmp9 males (d to f) demonstrate similar mechanical profile of isolated toughness loss (e). MMP9 study of both genders illustrates statistically significant but less pronounced difference in toughness (h). Maturation (j to l) shows an opposite profile where strength differences (j) associate with TMD (l) but not toughness (k).  Fig. 3Polarization changes in the Raman spectrum are more intense in brittle bone, but not apparent in any one bone orientation. Peaks from the orthogonally orientated bone spectrum show slight trends that do not significantly separate for (a) and phosphate, (b) phosphate, or (c) amide I. (d) Raman spectra () show more pronounced differences between bone orientations for Atf4−/− (e) than Atf4 +/+ mice (d). 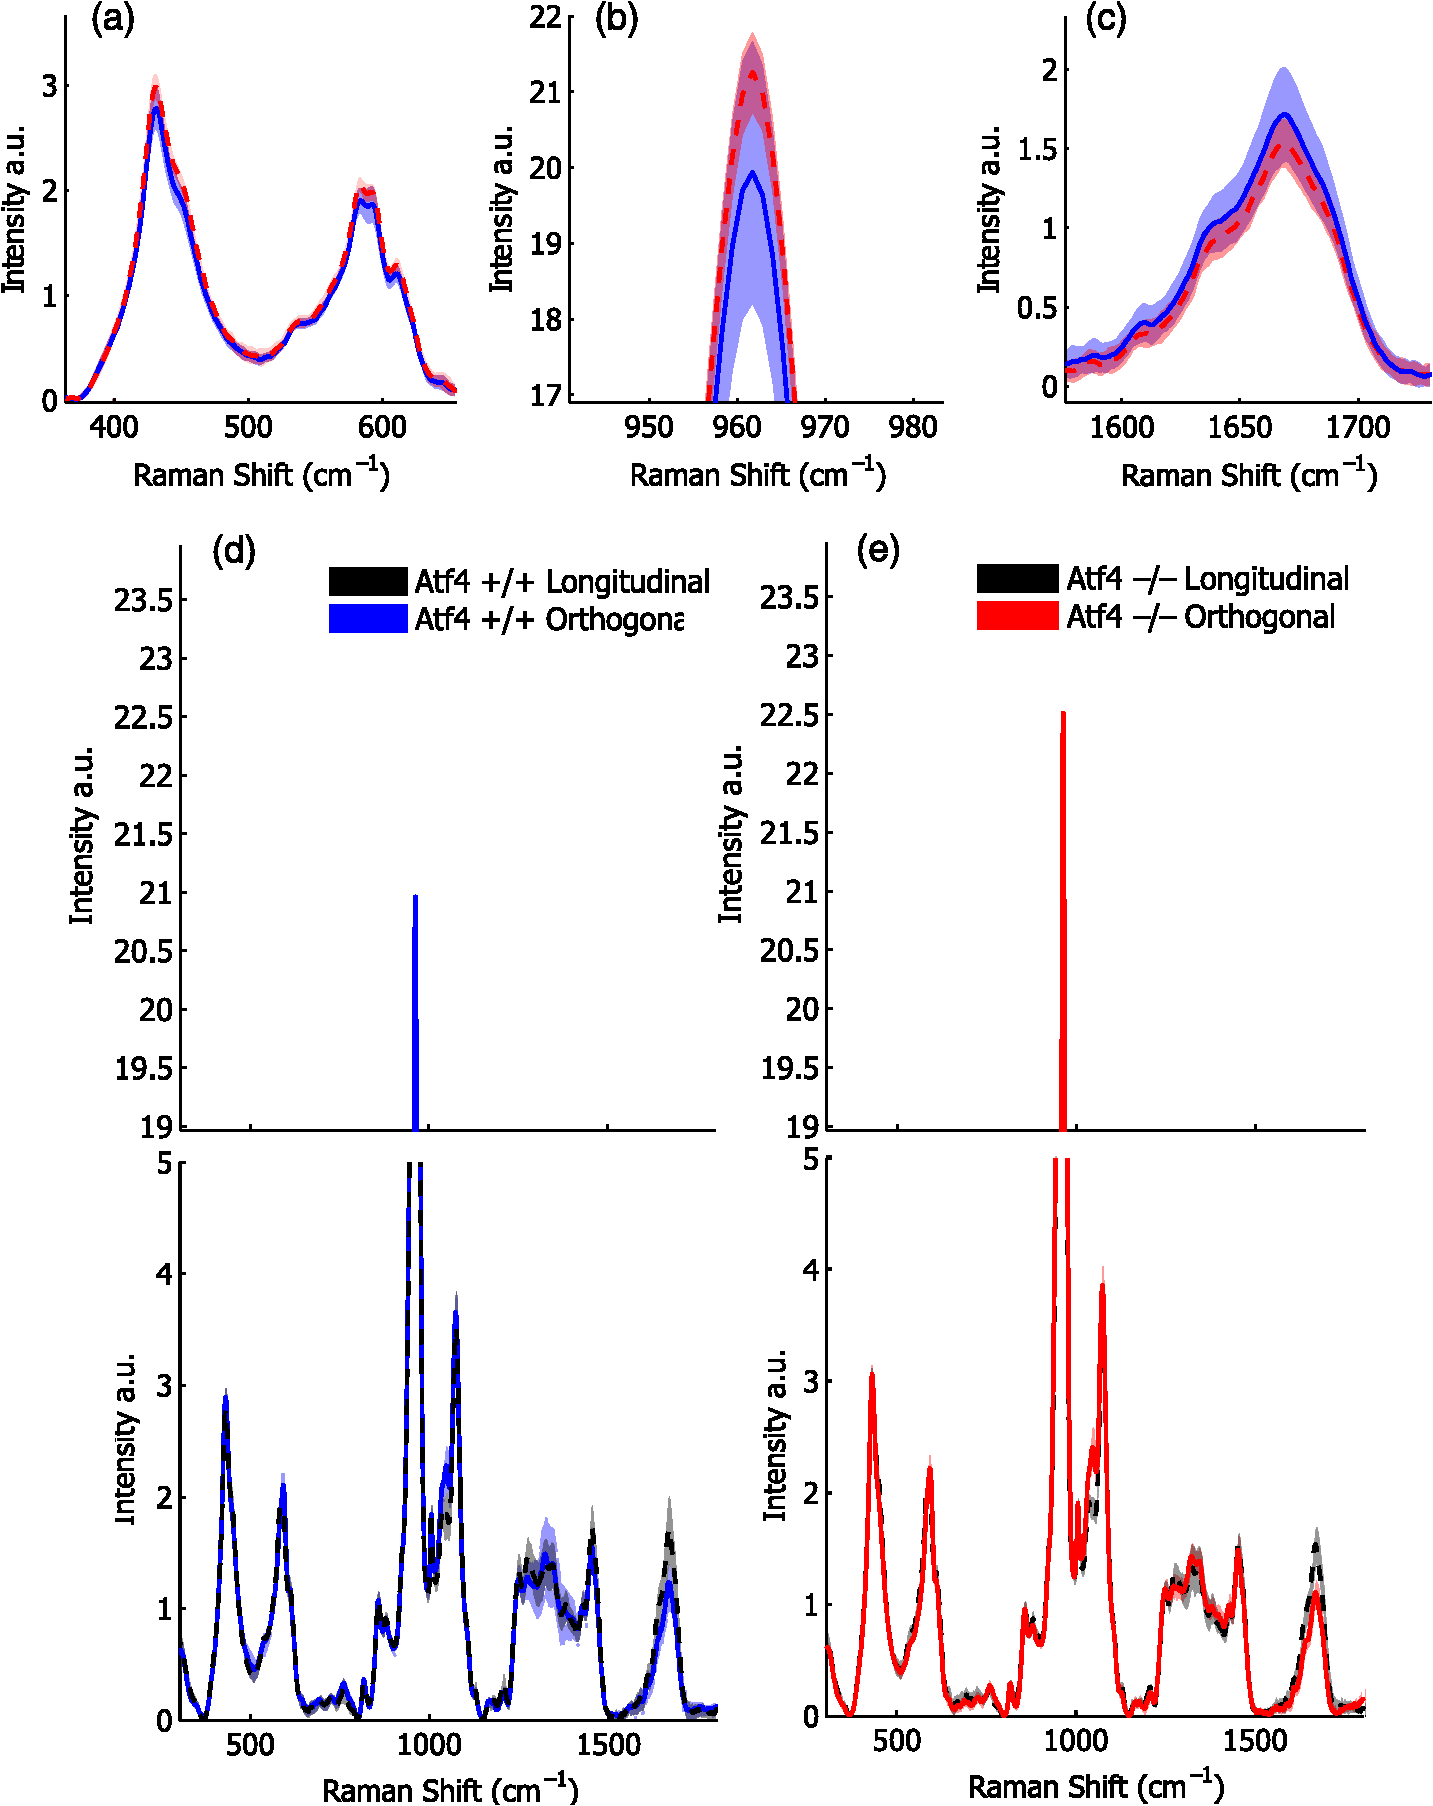 Fig. 4Detail regions of Raman spectroscopy (RS) spectra () for two orthogonal bone orientations (orthogonal in color and longitudinal in black) depict orientation (polarization)-related changes in mineral and collagen bands for ATF4-deficient bone that are more severe than those seen in wild-type bone.  3.2.Classification of Brittle Bone Genotypes Improves with Inclusion of Full Spectrum Polarization InformationTo determine whether the principal components derived from polarization-influenced Raman spectra improves the ability of RS to classify brittle bone, we performed SMLR with leave-one-out cross validation on PCA output and traditional peak ratios (Table 1). Including peak ratios from both orientations showed no improvement of classification compared to using a peak ratio from either orientation (Tables 1 and 2). The impact of increasing polarization information was further examined using models including all principal components that significantly separated Atf4−/− from Atf4+/+ (Mann-Whitney U; ). SMLR using PCA output from only the orthogonal bone orientation [Fig. 5(a)] classified the genotype for 70.8% of the mice (Table 1), misclassifying only 2 Atf4−/− bones. However, using spectra from both orthogonal (O) and longitudinal (L) orientations in the PCA improves SMLR-based classification capabilities as evidenced by the increase in the samples correctly classified and the improvement in class posterior probability [Fig. 5(b)]. Thus, Atf4−/− and Atf4+/+ bones have different degrees of polarization changes in RS upon bone rotation, and including multiple orientations to capture this polarization-based RS phenotype improves genotype classification (Table 1). This finding implies that the tissue organization underlies the brittleness difference between Atf4+/+ and Atf4−/− mice. Table 1Multivariate expression of increasing polarization information improves classification over common peak ratios.
Table 2Bivariate expression of increasing polarization information from orthogonal orientations does not improve classification.
Fig. 5Classification accuracy and posterior probability improve when including RS polarization information. (a) Sparse multinomial logistic regression (SMLR) classification for wild-type and knockout bone from the Atf4 study misclassifies two knockout and five wild-type samples when using only the orthogonal orientation. (b) SMLR classification including both orientations misclassifies one knockout and four wild-type and posterior probability increases for many samples.  Improved classification with the inclusion of paired spectra (but not paired peak ratios) from two bone orientations was consistent across studies involving genetic knock-out mice with a brittle bone phenotype [Figs. 2(e) and 2(h)]. Unlike the ATF4 study, -derived TMD was significantly different between genotypes for the MMP9 study involving only males, but similar to the ATF4 study, TMD had poor classification accuracy (Table 1). With the exception of for the Mmp9 male data set, none of the peak ratios from either bone orientation appropriately classified knockout bones as determined by SMLR (i.e., 0% sensitivity), such that all bones were classified as wild-type. Use of the full spectrum as PCA input for either the O or L bone orientation improved SMLR classification sensitivity for all three studies (Table 1) with the two different bone orientations yielding different classification results. Including both orientations as separate variables for PCA (denoted as [O, L]) provided further improvement in overall classification accuracy in both MMP9 studies, despite the confounding factor of gender. 3.3.Principal Components have a Stronger Correlation with Toughness than Traditional Compositional RS MeasurementsExpanding upon the multivariate classification of genotype, we analyzed whether RS polarization information improves mechanical bone quality characterization using Spearman’s correlation coefficients (Table 3). Peak ratios did not correlate with toughness except for longitudinal mineral-to-collagen ratio (MCR) and the paired MCR (Spearman’s correlation coefficient of SMLR scores; ) in the ATF4 study, the only study where -derived TMD also correlated significantly (Table 3). PC1 from either orientation correlated with toughness in the ATF4 and MMP9-gender studies, again with differing results between orientations. The inclusion of both orientations in the PCA strengthened the correlation between PC1 and toughness in all three studies. Notably, none of the peak ratios or the genotype separating PC’s from toughness models yielded a significant correlation to bending strength. Figure 6 shows linear regressions between PC1 from the [O, L] analysis of both orientations and toughness for each genotype. As one of few PCs to significantly separate genotype (Mann–Whitney U; ), PC1 was consistently the only PC observed to significantly explain toughness variance (Fig. 6). As such, PC1 had a significant linear relationship to toughness for each study (F test: ; ), although the slope of this relationship was not positive for all studies. The additional MMP9 study including both male and female femurs exhibited a significant linear regression despite a marked overlap in toughness values between the genotypes. That is, there is a notably smaller toughness difference [Fig. 2(h)] in this study than in the MMP9 male only study, but PC1 still explains the toughness variance. In summary, full spectrum polarization information improves genotype classification and correlation to toughness in all three studies when compared to standard RS peak ratios or -derived TMD. Table 3Multivariate Raman spectroscopy signatures provide consistent, improved correlation to bone toughness.
Fig. 6Linear regressions of principal component scores significantly explain a portion of bone toughness. (a) PC1 score explains toughness and separates genotype in Atf4. (b) Despite small sample size, PC1 score explains over 20% of variance in toughness of Mmp9 male samples. (c) Despite overlap due to gender, PC1 score significantly explains over 35% of Mmp9 toughness. 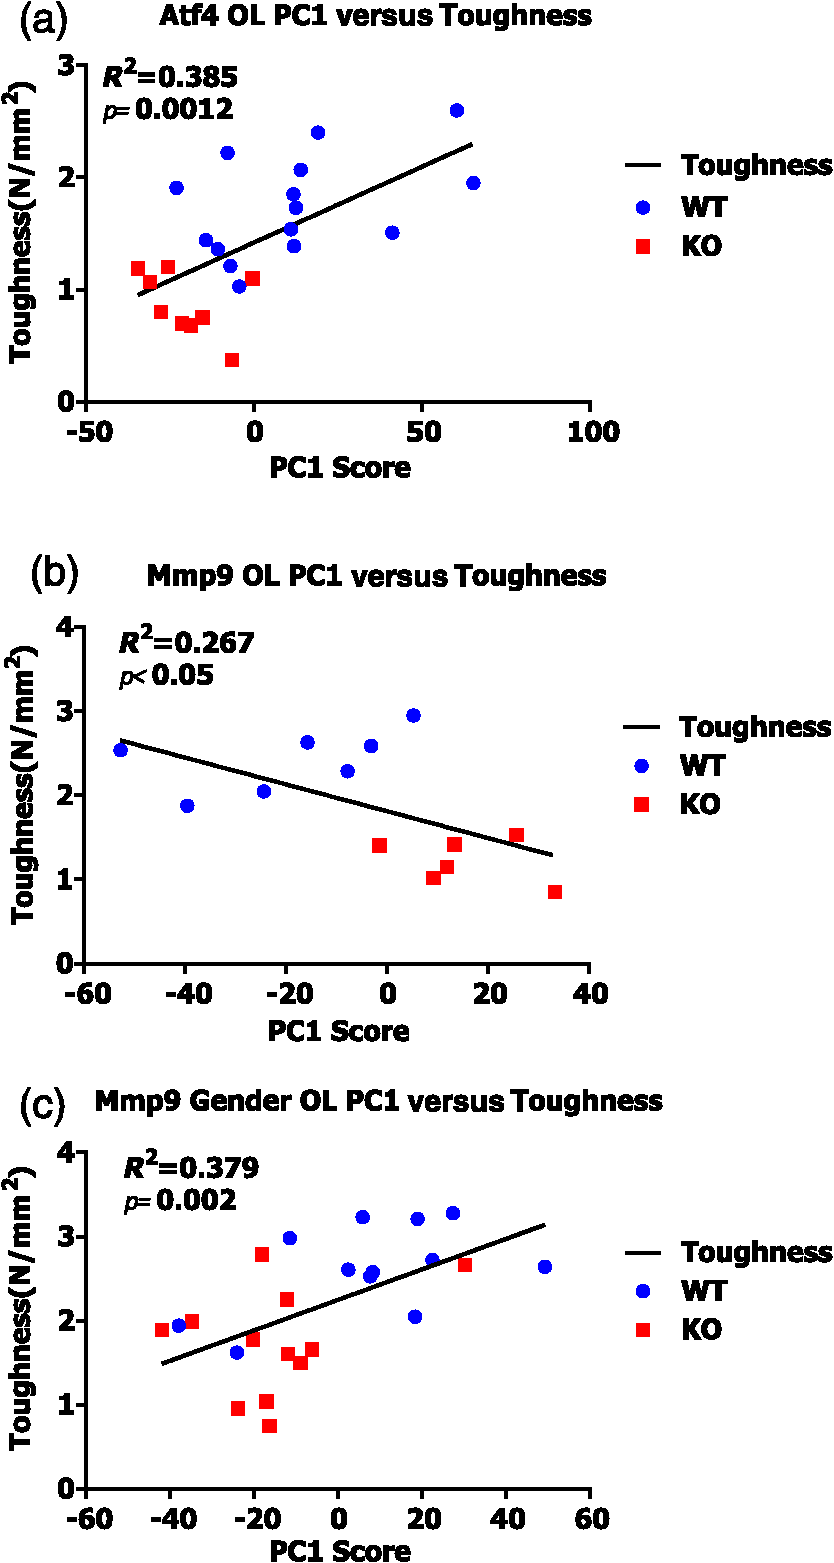 3.4.Multivariate Analysis of Full Raman Spectra Improves Classification of Young and Mature Bone, But Does Not Improve Correlation to StrengthTo establish the link between RS polarization information and toughness of bone, a study of strength differences served as a negative control. Material strength can often be attributed to changes in composition as seen with the pronounced increase in cortical TMD that occurs with bone maturation [Figs. 2(j) and 2(l)]. Indeed, -derived TMD separates age significantly (Table 4) and correlates to bending strength (Spearman’s ; ). Neither MCR nor crystallinity demonstrates SMLR classification sensitivity to maturation or correlation to bending strength. Despite decreased specificity in classifying age, carbonate substitution is the only peak ratio to significantly, albeit weakly, correlate with bending strength ( for O and for L). Although PC classification of young and mature bone was more accurate than peak ratios, the correlation to strength was slightly weaker ( for O, for L) than the aforementioned peak ratio. The PC correlation with strength was insignificant when including both orientations. Notably, there were similar results for the two orientations with respect to both classification (Table 4) and correlation with strength. Unlike models of toughness, adding RS polarization information via full spectrum analysis did not improve explanation of strength, and in general, RS measures did not outperform TMD in this maturation model. Table 4Multivariate RS expressions of bone maturation improve classification accuracy over common peak ratios.
3.5.Principal Components Loadings from RS of Brittle Bone Phenotypes Suggest Conserved Elements That Are Not Seen in PCs Distinguishing Bone MaturityExamining spectral loadings of the principal components may identify elements of RS signatures that explain material property differences. Figure 7 compares principal component loadings from the [O, L] PCA that used spectra from both bone orientations and that represents the greatest explanation of variance. In the ATF4 model of toughness loss, strong negative weights of PC1, which differed between genotypes, occurred at all the mineral peaks, including phosphate (), phosphate (), phosphate shoulders (), and carbonate () for both orientations. Strong positive weights occurred at collagen peaks including proline (), hydroxyproline (), amide I (), and amide III (). For several peaks, weights differ between O and L bone orientations, including amide I and (). PC1 of the MMP9 male study, responsible for best genotype classification and correlation to toughness, shows similar weights to those seen for the ATF4 study with strong negative weights on mineral peaks and strong positive weights on collagen peaks. Fig. 7Principal components that explain toughness demonstrate consistent loadings among studies. Gray overlay is used to accent regions of greatest similarity between models of brittle bone. (a) PC1 of Atf4 male mice demonstrates strong positive collagen and strong negative mineral loadings. (b) Similar positive collagen weights and negative mineral weights explain toughness in PC1 of Mmp9 male mice. (c) PC3 of maturation provides best separation of class, but demonstrates strong differences in loading when compared to components from brittleness models.  Although principal components explaining toughness display some conserved spectral features, the principal components that separate maturation illustrate stark contrast from RS signatures of toughness. In Fig. 7(c), PC3 from the maturation experiment did not significantly correlate to strength (note that none of the PC’s in the [O, L] input correlated); however, the 11% of the variance explained by this PC offers the best observed separation of class. For both orientations, carbonate was negatively weighted. Surprisingly, very little to no weight was placed on the amide I peak. Most of the peaks were weighted differently between the two orientations. In summary, mouse genetic models of reduced toughness (loss of ATF4 or MMP9) have a similar RS polarization profile in the principal components that explain toughness; however, separation of maturation-based changes has strong differences in orientation that do not correlate to strength and are loaded differently than RS profiles of toughness. 4.DiscussionIn the present study, a multivariate analysis of polarization information in RS improved genotype classification and correlation to bone toughness—using bones from two genetic mouse models—over peak ratios in traditional RS analyses. As this technique is further developed, it may help establish the interplay between biochemical composition and tissue organization as a factor in the resistance of bone to fracture. These experiments confirm that traditional peak ratio analysis is not always sufficient to explain bone mechanical quality. When classifying genotypes for which there is a difference in bone brittleness, only the polarization-sensitive partially identified knockout bones (Table 1) and weakly correlated with toughness (Table 3). Overall, univariate and even bivariate analysis of RS factors were insufficient to explain genetic-related differences in brittleness, characteristics that depend on defects in matrix organization in addition to abnormal biochemical composition, even when using peak ratios from two orthogonal orientations. Full spectrum analysis of principal components derived from a single-bone orientation improved classification when compared with single-peak ratios (Table 1), suggesting that additional RS information assists in the explanation of these complex mechanical phenotypes. Notable differences in RS intensity between orthogonal bone orientations [Fig. 3(e)] occur mostly at locations previously reported by the Penel group8,26 to be sensitive to polarization: ν3 phosphate (), amide III band (),44 and amide I (). The most striking differences occur at peak shoulders and would, therefore, be overlooked by many standard analyses. Moreover, these orientation effects on Raman spectra were more pronounced in brittle bones than wild-type counterparts [compare Fig. 3(d) to Fig. 3(e)], suggesting that polarization RS is sensitive to the orientation and subsequently the organizational changes underlying toughness loss that occurs with the deletion of ATF4. Although full spectrum analysis improved classification in these models, data from a single orientation alone was insufficient to produce consistent classification and correlation to toughness. This manifests as disparate classification accuracy when comparing principal components of results from longitudinal and orthogonal bone orientations (Table 1). However, use of polarization RS from both bone orientations improves overall classification in all three sets of wild-type and corresponding mutant mice (Table 1) and improved class posterior probabilities (Fig. 5). In bones lacking MMP9, this additional organization information also improved correlation of RS to toughness as well (Table 3). PCA identified the RS signatures of brittle phenotypes, and as an unsupervised “bottom up” approach to full spectrum analysis, it lends credence to the reliability of mechanical correlation of these physiochemical signatures. In each of the ATF4 and MMP9 studies, the first principal direction of variance explained only 25% to 30% of the total variance of the Raman spectrum, yet it significantly separated genotype and correlated to toughness, explaining over 25% of this mechanical variance (Fig. 6). Utilizing unsupervised multivariate analysis potentially runs the risk of over-fitting the data, but the sensitivity of the method was validated with two different genetic mouse models and by repeating the MMP9 study using a different colony of mice. Even when the toughness measurements overlapped between genotypes in the additional MMP9 study (Fig. 2), which included both genders [Fig. 6(c)], the first principal component still significantly explained toughness. When considering other mechanical properties and potential RS correlation, tissue organization (provided by polarization) may not play as much of a role. Using growing wild-type mice as a model for strength increase with no change in toughness, peak bending stress and -derived TMD increased with age [Figs. 2(j) and 2(i)]. Despite this, carbonate substitution was the only peak ratio that correlated with strength, despite a lower classification accuracy than other compositional properties (Table 4). Considering the numerous endocrine and cellular changes that occur during maturation, it is not entirely unexpected that more bone changes exist in the Raman spectrum than those that explain strength. As such, an increase in the amount of Raman wavenumbers sampled improved classification accuracy, but did not increase correlation to strength (Table 4). Moreover, the PCA of the RS data from the individual orientations of bone seem to yield consistent classifications and correlations to strength, which is strikingly different from the orientation and polarization-specific outcomes observed in models of brittleness. Since strength and toughness can be diametrically opposed in many materials including bone in certain instances,45,46 it is perhaps not surprising that organizational information from polarization in RS specifically aids the explanation of toughness differences between genotypes but not the strength differences between age groups. Notably, since ATF4 influences collagen synthesis47 and since MMP-9 is a gelatinase that processes denatured collagen,23 these genes likely influence matrix organization. On the other hand, secondary mineralization accompanies skeletal maturity48 from 8 weeks to 20 weeks of age in mice, increasing strength but not necessarily toughness. Although this paper focuses on the use of multivariate analysis to highlight the organizational information added by multiple polarizations, multivariate analyses of RS have also been successfully used to identify compositional changes and discriminate tissue age and disease. Fu et al.49 demonstrated how the linear discriminants of PCA separate compositional changes in the rat mandible after ovariectomy. PCA has also been used to chart developmental changes in differentiating mesenchymal stem cells50 as well as RS signatures of cartilaginous zones during fetal femur development.51 Finally, Raghavan et al.52 conducted an in-depth comparison of several new multivariate techniques to help discriminate the RS signatures of tissue age as they compare to nanoindentation mechanical properties on the same length scale. These articles attest to the versatility of appropriately applied multivariate analyses of RS for skeletal tissue; however, none of these studies attempted to connect RS discrimination to the fracture resistance of bone. Although principal components only represent one straightforward and simple application of multivariate analysis to RS, the use of a “bottom up” study design that builds upon inherent, uncorrelated dimensions of variance allows for the distinct advantage of analyzing underlying biochemical signatures for consistency between models. Different component loadings (data not shown) between the orthogonal and longitudinal orientations of the same bones within each study imply the necessity of different orientations, and subsequently organizational information, to explain toughness. There are differences in significant principal components between the two models of bone brittleness and the model of skeletal maturation (Fig. 7), noting especially heavy weightings for amide I bands ( to ) in ATF4 [Fig. 7(a)] and MMP9 studies [Fig. 7(b)] but not for maturation [Fig. 7(c)]. Strong consistency between the first principal components (PC1) of ATF4 and MMP9 models includes heavy positive weights for amide III (1235 to ) and amide I bands and heavy negative weights for phosphate () and phosphate (). Although the mechanistic significance of these trends remains to be tested, the data imply some conserved elements in the Raman signature of toughness loss [Figs. 7(a) and 7(b)]. Note that there is no evidence that ATF4 is upstream or downstream of MMP9 activity to date. By correlating RS to bone material properties, we are effectively assuming an inherent relationship between biochemistry and biomechanics. Although the additional RS polarization information allows for a more direct link between toughness and tissue organization, the relationship between principal components and fracture resistance may not always be clear (Fig. 6). Although PC1 loading is similar for the two bone orientations between ATF4 and MMP9 male studies (Fig. 7), the spectral differences between respective genotypes are not necessarily the same across studies (MCR is higher for Atf4−/− than for Atf4+/+ mice while the opposite prevails for Mmp9 mice; Table 1). Although polarization effects of the Raman phenomenon have been characterized since Placzek53 and the application of vibrational spectroscopy to the characterization of bone has been conducted for decades (see Boskey54,55 and Morris5,56 for review), relatively little has been investigated at the union of these two fields until recently. Pioneers in the bone field showed that the crystalline structure was highly organized in enamel and bone;8 that the orientation of collagen fibers in bone could be extracted from polarization RS19 and aligned with theory;57 and that the effect of the polarization phenomenon on bone RS could be augmented or minimized by appropriate instrumentation choices.17 Traditionally, RS probes tissue biochemistry with a high degree of molecular specificity, but polarization analysis can be sensitive to differences in tissue organization, such that RS can then be used to analyze the interaction between bone composition and organization. The additional layer of full spectrum multivariate analysis extends RS interpretation beyond the relative composition implied by peak ratios. Since the goal of the study was to compare the performance of standard peak ratio analysis to multivariate expressions of RS polarization in their ability to explain bone mechanical quality, Raman spectra were acquired from anatomically consistent surfaces without preparation in the region of mechanical testing, and as such, this anterior midshaft site might not yield the strongest polarization difference seen in bone. The consistent, observed sensitivity of this method to bone mechanical quality is surprising considering vast under-sampling with less than sampled per bone. To make an accurate comparison between standard measurements of peak ratios and full spectrum analysis that includes polarization information, the instrument was left at its inherent polarization extinction ratio. Therefore, further optimization of the Raman instrument may offer continued improvement in the explanation of bone mechanical quality. However, the current configuration makes the method readily available for any lab with a confocal RS instrument and a rotation stage. In the present study, the subtle spectral changes that occur with polarization sensitivity in RS to matrix organization coincide with the loss of mechanical toughness and not with changes in material strength. Thus, polarization RS shows promise as a novel tool to explore the dynamic and subtle underpinnings of the mechanisms behind bone mechanical quality. However, there is indubitably more to the RS signature of bone than a complex explanation of mechanics. In addition, there are likely contributors to mechanical quality to which RS is not sensitive. Near infrared RS, used for clinical relevance, is tuned to be largely insensitive to water, and bound and pore water have a significant contribution to the fracture resistance of bone.58 RS will not have the resolution of atomic force microscopy to map collagen d spacing,59 nor the SNR of two photon fluorescence to examine collagen fiber orientation.60 Nonetheless, the inherent interplay between chemical composition and tissue organization in RS polarization may prove useful in explaining changes in the fracture resistance of complex human microstructures. Ascenzi showed such complexity as mechanical properties of osteons for different loading modes (i.e., compression versus tension) were related to the primary collagen orientation relative to the directionality of the haversian canals.61–63 Both polarized light64 and polarization RS40 are sensitive to osteonal lamellae. As such, if the organizational information in polarization RS continues to explain the mechanical integrity of bone as it is applied to human bone, this technique could be used to explain how microstructural heterogeneity and composition affect bone mechanical quality, ultimately producing an RS profile for healthy bone tissue. 5.ConclusionsMultivariate analysis of Raman spectra at two bone orientations (enhancing polarization sensitivity) assisted in the explanation of a toughness loss in genetic mouse models involving two different genes (for a transcription factor and for an enzyme). Across three sets of wild-type and knockout bones, MCR, which is often used to characterize compositional differences, did not explain or poorly explained the difference in bone toughness between genotypes. This was effectively achieved with Raman spectral analysis (300 to ) using principal components acquired from two orthogonal bone orientations such that the first and largest direction of variance consistently separated the brittleness phenotypes and significantly correlated with bone toughness. Using the same technique on bones from a mouse model of skeletal maturation did not improve the explanation in the age-related increase in strength when compared to a univariate approach. This implies that the multivariate analysis of Raman spectra is not simply providing more information, but rather the organizational information provided by polarization may specifically aid in explaining variance in toughness but not in strength. If the observed Raman profiles scale to the complex organization of human bone, polarization in RS may have clinical utility for bone quality assessment. AcknowledgmentsThis material is based upon work supported by the Department of Veterans Affairs, Veterans Health Administration, Office of Research and Development (1I01BX001018). Additional funding to support research was received from NIAMS/NIH (AR063157) and NSF (1068988). Last, the microcomputed tomography scanner was supported by NIH/NIRR (1S10RR027631) and matching funds from the Vanderbilt Office of Research. ReferencesB. EttingerD. B. BurrR. O. Ritchie,
“Proposed pathogenesis for atypical femoral fractures: lessons from materials research,”
Bone, 55
(2), 495
–500
(2013). http://dx.doi.org/10.1016/j.bone.2013.02.004 8756-3282 Google Scholar
E. M. Lochmulleret al.,
“Radius bone strength in bending, compression, and falling and its correlation with clinical densitometry at multiple sites,”
J. Bone Miner. Res., 17
(9), 1629
–1638
(2002). http://dx.doi.org/10.1359/jbmr.2002.17.9.1629 JBMREJ 0884-0431 Google Scholar
X. S. Liuet al.,
“Individual trabecula segmentation (ITS)-based morphological analyses and microfinite element analysis of HR-pQCT images discriminate postmenopausal fragility fractures independent of DXA measurements,”
J. Bone Miner. Res., 27
(2), 263
–272
(2012). http://dx.doi.org/10.1002/jbmr.562 JBMREJ 0884-0431 Google Scholar
A. H. BursteinD. T. ReillyM. Martens,
“Aging of bone tissue: mechanical properties,”
J. Bone Joint Surg. Am., 58
(1), 82
–86
(1976). JBJSA3 1058-2436 Google Scholar
M. D. MorrisG. S. Mandair,
“Raman assessment of bone quality,”
Clin. Orthop., 469
(8), 2160
–2169
(2011). http://dx.doi.org/10.1007/s11999-010-1692-y CORTBR 0009-921X Google Scholar
S. PortoJ. GiordmaineT. Damen,
“Depolarization of Raman scattering in calcite,”
Phys. Rev., 147
(2), 608
–611
(1966). http://dx.doi.org/10.1103/PhysRev.147.608 PHRVAO 0031-899X Google Scholar
M. D. Levenson,
“Polarization techniques in coherent Raman spectroscopy,”
J. Raman Spec., 10
(1), 9
–23
(1981). http://dx.doi.org/10.1002/jrs.v10:1 JRSPAF 0377-0486 Google Scholar
G. Leroyet al.,
“Human tooth enamel: a Raman polarized approach,”
Appl. Spectrosc., 56
(8), 1030
–1034
(2002). http://dx.doi.org/10.1366/000370202760249765 APSPA4 0003-7028 Google Scholar
M. Kazanciet al.,
“Bone osteonal tissues by Raman spectral mapping: orientation-composition,”
J. Struct. Biol., 156
(3), 489
–496
(2006). http://dx.doi.org/10.1016/j.jsb.2006.06.011 JSBIEM 1047-8477 Google Scholar
A. Masicet al.,
“Observations of multiscale, stress-induced changes of collagen orientation in tendon by polarized Raman spectroscopy,”
Biomacromolecules, 12
(11), 3989
–3996
(2011). http://dx.doi.org/10.1021/bm201008b BOMAF6 1525-7797 Google Scholar
T. E. Uvegeset al.,
“Alendronate treatment of the brtl osteogenesis imperfecta mouse improves femoral geometry and load response before fracture but decreases predicted material properties and has detrimental effects on osteoblasts and bone formation,”
J. Bone Miner. Res., 24
(5), 849
–859
(2009). http://dx.doi.org/10.1359/jbmr.081238 JBMREJ 0884-0431 Google Scholar
X. Liet al.,
“Targeted deletion of the sclerostin gene in mice results in increased bone formation and bone strength,”
J. Bone Miner. Res., 23
(6), 860
–869
(2008). http://dx.doi.org/10.1359/jbmr.080216 JBMREJ 0884-0431 Google Scholar
J. Ndonget al.,
“Asfotase-alpha improves bone growth, mineralization and strength in mouse models of neurofibromatosis type-1,”
Nat. Med., 20
(8), 904
–910
(2014). http://dx.doi.org/10.1038/nm.3583 1078-8956 Google Scholar
N. P. CamachoW. J. LandisA. L. Boskey,
“Mineral changes in a mouse model of osteogenesis imperfecta detected by Fourier transform infrared microscopy,”
Connect. Tissue Res., 35
(1–4), 259
–265
(1996). http://dx.doi.org/10.3109/03008209609029199 CVTRBC 0300-8207 Google Scholar
E. Milleret al.,
“Abnormal mineral-matrix interactions are a significant contributor to fragility in oim/oim bone,”
Calcif. Tissue Int., 81
(3), 206
–214
(2007). http://dx.doi.org/10.1007/s00223-007-9045-x CTINDZ 0171-967X Google Scholar
M. Vanleeneet al.,
“Ultra-structural defects cause low bone matrix stiffness despite high mineralization in osteogenesis imperfecta mice,”
Bone, 50
(6), 1317
–1323
(2012). http://dx.doi.org/10.1016/j.bone.2012.03.007 8756-3282 Google Scholar
M. Raghavanet al.,
“Quantitative polarized Raman spectroscopy in highly turbid bone tissue,”
J. Biomed. Opt., 15
(3), 037001
(2010). http://dx.doi.org/10.1117/1.3426310 JBOPFO 1083-3668 Google Scholar
S. J. Gadaletaet al.,
“Fourier transform infrared microscopy of calcified turkey leg tendon,”
Calcif. Tissue Int., 58
(1), 17
–23
(1996). http://dx.doi.org/10.1007/BF02509541 CTINDZ 0171-967X Google Scholar
S. Gamsjaegeret al.,
“Cortical bone composition and orientation as a function of animal and tissue age in mice by Raman spectroscopy,”
Bone, 47
(2), 392
–399
(2010). http://dx.doi.org/10.1016/j.bone.2010.04.608 8756-3282 Google Scholar
P. J. Thurneret al.,
“Osteopontin deficiency increases bone fragility but preserves bone mass,”
Bone, 46
(6), 1564
–1573
(2010). http://dx.doi.org/10.1016/j.bone.2010.02.014 8756-3282 Google Scholar
S. Y. Tanget al.,
“Matrix metalloproteinase–13 is required for osteocytic perilacunar remodeling and maintains bone fracture resistance,”
J. Bone Miner. Res., 27
(9), 1936
–1950
(2012). http://dx.doi.org/10.1002/jbmr.1646 JBMREJ 0884-0431 Google Scholar
A. J. Makowskiet al.,
“The loss of activating transcription factor 4 (ATF4) reduces bone toughness and fracture toughness,”
Bone, 62 1
–9
(2014). http://dx.doi.org/10.1016/j.bone.2014.01.021 8756-3282 Google Scholar
J. S. Nymanet al.,
“Differential effects between the loss of MMP-2 and MMP-9 on structural and tissue-level properties of bone,”
J. Bone Miner. Res., 26
(6), 1252
–1260
(2011). http://dx.doi.org/10.1002/jbmr.326 JBMREJ 0884-0431 Google Scholar
A. J. Makowskiet al.,
“Polarization control of Raman spectroscopy optimizes the assessment of bone tissue,”
J. Biomed. Opt., 18
(5), 055005
(2013). http://dx.doi.org/10.1117/1.JBO.18.5.055005 JBOPFO 1083-3668 Google Scholar
G. Penelet al.,
“MicroRaman spectral study of the PO4 and CO3 vibrational modes in synthetic and biological apatites,”
Calcif. Tissue Int., 63
(6), 475
–481
(1998). http://dx.doi.org/10.1007/s002239900561 CTINDZ 0171-967X Google Scholar
G. Falgayracet al.,
“New method for Raman investigation of the orientation of collagen fibrils and crystallites in the Haversian system of bone,”
Appl. Spectrosc., 64
(7), 775
–780
(2010). http://dx.doi.org/10.1366/000370210791666255 APSPA4 0003-7028 Google Scholar
B. Z. GevorkianN. E. ArnotskaiaE. N. Fedorova,
“[Study of bone tissue structure using polarized Raman spectra],”
Biofizika, 29
(6), 1046
–1052
(1984). BIOFAI 0006-3029 Google Scholar
J. S. Nymanet al.,
“Measuring differences in compositional properties of bone tissue by confocal Raman spectroscopy,”
Calcif. Tissue Int., 89
(2), 111
–122
(2011). http://dx.doi.org/10.1007/s00223-011-9497-x CTINDZ 0171-967X Google Scholar
L. S. SchadlerC. Galiotis,
“Fundamentals and applications of micro Raman spectroscopy to strain measurements in fibre reinforced composites,”
Int. Mater. Revi., 40
(3), 116
(1995). http://dx.doi.org/10.1179/imr.1995.40.3.116 INMREO 0950-6608 Google Scholar
O. de Carmejaneet al.,
“Bone chemical structure response to mechanical stress studied by high pressure Raman spectroscopy,”
Calcif. Tissue Int., 76
(3), 207
–213
(2005). http://dx.doi.org/10.1007/s00223-004-0168-z CTINDZ 0171-967X Google Scholar
S. Michielsen,
“Application of Raman spectroscopy to organic fibers and films,”
Handbook of Raman Spectroscopy, 749
–798 Marcel Dekker, New York
(2001). Google Scholar
D. C. SmithC. Carabtos-Nedelec,
“Raman spectroscopy applied to crystals: phenomena and principles, concepts and coventions,”
Handbook of Raman Spectroscopy, 349
–422 Marcel Dekker, New York
(2001). Google Scholar
J. A. Inzanaet al.,
“Bone fragility beyond strength and mineral density: Raman spectroscopy predicts femoral fracture toughness in a murine model of rheumatoid arthritis,”
J. Biomech., 46
(4), 723
–730
(2013). http://dx.doi.org/10.1016/j.jbiomech.2012.11.039 JBMCB5 0021-9290 Google Scholar
M. Vanleeneet al.,
“Transplantation of human fetal blood stem cells in the osteogenesis imperfecta mouse leads to improvement in multiscale tissue properties,”
Blood, 117
(3), 1053
–1060
(2011). http://dx.doi.org/10.1182/blood-2010-05-287565 BLOOAW 0006-4971 Google Scholar
J. D. McElderryM. R. KoleM. D. Morris,
“Repeated freeze-thawing of bone tissue affects Raman bone quality measurements,”
J. Biomed. Opt., 16
(7), 071407
(2011). http://dx.doi.org/10.1117/1.3574525 JBOPFO 1083-3668 Google Scholar
C. H. TurnerD. B. Burr,
“Basic biomechanical measurements of bone: a tutorial,”
Bone, 14
(4), 595
–608
(1993). http://dx.doi.org/10.1016/8756-3282(93)90081-K 8756-3282 Google Scholar
R. O. Ritchieet al.,
“Measurement of the toughness of bone: a tutorial with special reference to small animal studies,”
Bone, 43
(5), 798
–812
(2008). http://dx.doi.org/10.1016/j.bone.2008.04.027 8756-3282 Google Scholar
J. M. KhosrofianB. A. Garetz,
“Measurement of a Gaussian laser beam diameter through the direct inversion of knife-edge data,”
Appl. Opt., 22
(21), 3406
(1983). http://dx.doi.org/10.1364/AO.22.003406 APOPAI 0003-6935 Google Scholar
P. PopeskoV. RajtováJ. Horák, A Colour Atlas of the Anatomy of Small Laboratory Animals, Saunders, London, England
(2002). Google Scholar
M. Kazanciet al.,
“Raman imaging of two orthogonal planes within cortical bone,”
Bone, 41
(3), 456
–461
(2007). http://dx.doi.org/10.1016/j.bone.2007.04.200 8756-3282 Google Scholar
M. Richard-LacroixC. Pellerin,
“Novel method for quantifying molecular orientation by polarized Raman spectroscopy: a comparative simulations study,”
Appl. Spectrosc., 67
(4), 409
–419
(2013). http://dx.doi.org/10.1366/12-06879 APSPA4 0003-7028 Google Scholar
C. A. LieberA. Mahadevan-Jansen,
“Automated method for subtraction of fluorescence from biological Raman spectra,”
Appl. Spectrosc., 57
(11), 1363
–1367
(2003). http://dx.doi.org/10.1366/000370203322554518 APSPA4 0003-7028 Google Scholar
J. R. Maheret al.,
“Raman spectroscopy detects deterioration in biomechanical properties of bone in a glucocorticoid-treated mouse model of rheumatoid arthritis,”
J. Biomed. Opt., 16
(8), 087012
(2011). http://dx.doi.org/10.1117/1.3613933 JBOPFO 1083-3668 Google Scholar
M. Jankoet al.,
“Anisotropic Raman scattering in collagen bundles,”
Opt. Lett., 35
(16), 2765
–2767
(2010). http://dx.doi.org/10.1364/OL.35.002765 OPLEDP 0146-9592 Google Scholar
A. Carrieroet al.,
“How tough is brittle bone? investigating osteogenesis imperfecta in mouse bone,”
J. Bone Miner. Res., 29
(6), 1392
–1401
(2014). http://dx.doi.org/10.1002/jbmr.2172 JBMREJ 0884-0431 Google Scholar
J. G. RamasamyO. Akkus,
“Local variations in the micromechanical properties of mouse femur: the involvement of collagen fiber orientation and mineralization,”
J. Biomech., 40
(4), 910
–918
(2007). http://dx.doi.org/10.1016/j.jbiomech.2006.03.002 JBMCB5 0021-9290 Google Scholar
X. Yanget al.,
“ATF4 is a substrate of RSK2 and an essential regulator of osteoblast biology; implication for coffin-lowry syndrome,”
Cell, 117
(3), 387
–398
(2004). http://dx.doi.org/10.1016/S0092-8674(04)00344-7 CELLB5 0092-8674 Google Scholar
O. AkkusF. AdarM. B. Schaffler,
“Age-related changes in physicochemical properties of mineral crystals are related to impaired mechanical function of cortical bone,”
Bone, 34
(3), 443
–453
(2004). http://dx.doi.org/10.1016/j.bone.2003.11.003 8756-3282 Google Scholar
X. Fuet al.,
“Effects of ovariectomy on rat mandibular cortical bone: a study using Raman spectroscopy and multivariate analysis,”
Anal. Chem., 84
(7), 3318
–3323
(2012). http://dx.doi.org/10.1021/ac300046x ANCHAM 0003-2700 Google Scholar
L. L. McManuset al.,
“Raman spectroscopic monitoring of the osteogenic differentiation of human mesenchymal stem cells,”
Analyst, 136
(12), 2471
–2481
(2011). http://dx.doi.org/10.1039/c1an15167c ANLYAG 0365-4885 Google Scholar
A. Kunstaret al.,
“Recognizing different tissues in human fetal femur cartilage by label-free Raman microspectroscopy,”
J. Biomed. Opt., 17
(11), 116012
(2012). http://dx.doi.org/10.1117/1.JBO.17.11.116012 JBOPFO 1083-3668 Google Scholar
M. Raghavanet al.,
“Age-specific profiles of tissue-level composition and mechanical properties in murine cortical bone,”
Bone, 50
(4), 942
–953
(2012). http://dx.doi.org/10.1016/j.bone.2011.12.026 8756-3282 Google Scholar
G. Placzek,
“Rayleigh-Streuung und Raman-Effekt,”
Handbuch der Radiologie, 205
–374 Akademische Verlagsgesellschaft, Leipzig, Germany
(1934). Google Scholar
E. P. PaschalisR. MendelsohnA. L. Boskey,
“Infrared assessment of bone quality: a review,”
Clin. Orthop., 469
(8), 2170
–2178
(2011). http://dx.doi.org/10.1007/s11999-010-1751-4 CORTBR 0009-921X Google Scholar
A. BoskeyR. Mendelsohn,
“Infrared analysis of bone in health and disease,”
J. Biomed. Opt., 10
(3), 031102
(2005). http://dx.doi.org/10.1117/1.1922927 JBOPFO 1083-3668 Google Scholar
A. CardenM. D. Morris,
“Application of vibrational spectroscopy to the study of mineralized tissues (review),”
J. Biomed. Opt., 5
(3), 259
–268
(2000). http://dx.doi.org/10.1117/1.429994 JBOPFO 1083-3668 Google Scholar
W. Wagermaieret al.,
“Spiral twisting of fiber orientation inside bone lamellae,”
Biointerphases, 1
(1), 1
–5
(2006). http://dx.doi.org/10.1116/1.2178386 BJIOBN 1559-4106 Google Scholar
R. A. Horchet al.,
“Non-invasive predictors of human cortical bone mechanical properties: T(2)-discriminated H NMR compared with high resolution X-ray,”
PLoS One, 6
(1), e16359
(2011). http://dx.doi.org/10.1371/journal.pone.0016359 1932-6203 Google Scholar
J. M. Wallaceet al.,
“Distribution of type I collagen morphologies in bone: relation to estrogen depletion,”
Bone, 46
(5), 1349
–1354
(2010). http://dx.doi.org/10.1016/j.bone.2009.11.020 8756-3282 Google Scholar
D. Aït-Belkacem,
“Microscopic structural study of collagen aging in isolated fibrils using polarized second harmonic generation,”
J. Biomed. Opt., 17
(8), 080506
(2012). http://dx.doi.org/10.1117/1.JBO.17.8.080506 JBOPFO 1083-3668 Google Scholar
M. Portigliatti Barboset al.,
“Collagen orientation in compact bone: II. Distribution of lamellae in the whole of the human femoral Z with reference to its mechanical properties,”
Metab. Bone Dis. Relat. Res., 5
(6), 309
–315
(1984). http://dx.doi.org/10.1016/0221-8747(84)90018-3 MBDRD6 0221-8747 Google Scholar
A. Boydeet al.,
“Collagen orientation in compact bone: I. A new method for the determination of the proportion of collagen parallel to the plane of compact bone sections,”
Metab. Bone Dis. Relat. Res., 5
(6), 299
–307
(1984). http://dx.doi.org/10.1016/0221-8747(84)90017-1 MBDRD6 0221-8747 Google Scholar
M. G. AscenziA. Lomovtsev,
“Collagen orientation patterns in human secondary osteons, quantified in the radial direction by confocal microscopy,”
J. Struct. Biol., 153
(1), 14
–30
(2006). http://dx.doi.org/10.1016/j.jsb.2005.08.007 JSBIEM 1047-8477 Google Scholar
T. G. Bromageet al.,
“Circularly polarized light standards for investigations of collagen fiber orientation in bone,”
Anat. Rec., 274
(1), 157
–168
(2003). http://dx.doi.org/10.1002/(ISSN)1097-0185 1552-4906 Google Scholar
|


