

|
|
1.IntroductionDetecting changes in the biomechanical properties of ocular tissues can aid in the diagnosis of structurally degenerative diseases.1,2 For example, keratoconus can pathologically decrease the stiffness of the cornea, leading to a loss in the quality of vision.3 Ultraviolet (UV)-induced collagen crosslinking (CXL) is an emerging treatment for keratoconus, which increases corneal stiffness.4 In addition to structural changes within the corneal tissue caused by CXL, intraocular pressure (IOP) also has an effect on the measured stiffness of the cornea.5 Therefore, there is a possibility that a cornea may be structurally weakened by keratoconus, yet have a “normal” measured stiffness due to an elevated IOP. Current techniques are not able to measure the true IOP in vivo without consideration of the effect of corneal biomechanical properties.6 Distinguishing corneas that have the same measured stiffness but are at different IOPs is still a challenge. Optical coherence elastography (OCE) is an emerging noninvasive technique that can map the local biomechanical properties of tissue.7 Similar to ultrasound elastography (USE)8 and magnetic resonance elastography (MRE),9 OCE is usually composed of an external loading component that produces displacements within the tissue. In OCE, imaging this tissue displacement is performed with optical coherence tomography (OCT), which has superior spatial resolution compared with USE and MRE.10 From the velocity of an induced elastic wave (EW), or stress-strain curve measured by OCE, tissue elasticity can be quantitatively estimated.11,12 In this work, we present a method utilizing OCE which is capable of distinguishing corneas of the same measured stiffness but at different IOPs. Validation experiments were performed on agar and gelatin phantoms of the same stiffness. This method was then applied to untreated (UT) and UV-induced collagen CXL porcine corneas. Artificial IOP control was used to induce the same measured corneal stiffness in the UT and CXL eyes. 2.Methods and ResultsA home-built phase-stabilized swept-source OCE (PhS-SSOCE) system consisted of a focused air-pulse delivery system and a phase-stabilized swept-source OCT (PhS-SSOCT) system. Details of the system can be found in our previous work.13,14 Briefly, a short duration-focused air-pulse was expelled through an electronic solenoid-controlled air gate and induced an EW in the sample. A pressure gauge provided air source pressure control and measurement. The localized air-pulse excitation was positioned with a three-dimensional linear micrometer stage. The PhS-SSOCT system was composed of a broadband swept laser source (HSL2000, Santec, Inc., Torrance, California) with a central wavelength of 1310 nm, bandwidth of , scan rate of 30 kHz, and output power of . A-scan acquisition was triggered by a fiber Bragg grating. The axial resolution of the system was in air. The experimentally measured phase stability of the system was , which corresponded to displacement in air. By synchronizing the focused air-pulse with consecutive M-mode images, the EW velocity and a two-dimensional depth-resolved elasticity were calculated.11 Previous studies have demonstrated that OCE is feasible for quantitatively assessing the elasticity of a sample. A validation study was initially conducted on 14.0% gelatin (w/w) and 1.1% agar (w/w) phantom samples ( for each type) with the same cylindrical dimensions of diameter and height . As shown in Fig. 1(a), the EW velocity, , measured by PhS-SSOCE in the gelatin samples was , which was very similar to the EW velocity in the agar samples of . The acoustic surface wave equation [Eq. (1)] was used to estimate the Young’s moduli of the samples, where the density, and Possion ratio, .14,15 As shown in Fig. 1(b), the Young’s modulus for the 14.0% gelatin and 1.1% agar phantoms obtained by the analytical model were and , respectively. Uniaxial mechanical compression tests (Model 5943, Instron Corp., Massachusetts) were conducted on the phantoms for elasticity validation. The measured Young’s modulus was for the 14% gelatin and for the 1.1% agar phantoms as shown in Fig. 1(b). These results demonstrated that the 14.0% gelatin sample and 1.1% agar phantoms were of similar stiffness, as confirmed by both analytical model and uniaxial compression tests Fig. 1(a) Elastic wave (EW) velocities of the 14.0% gelatin (w/w) and 1.1% (w/w) agar phantom samples measured by PhS-SSOCE; (b) Comparison of estimated and measured Young’s moduli of the 14.0% gelatin and 1.1% agar phantoms. 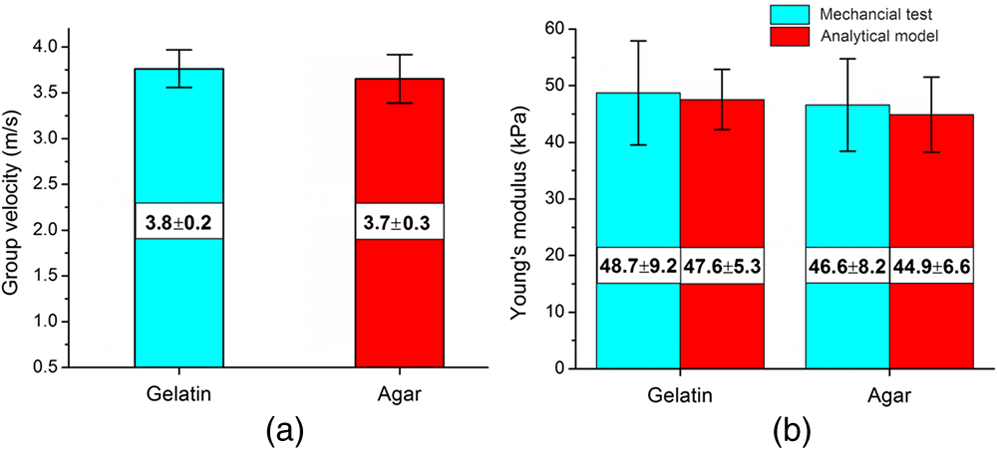 To compare the damping characteristics between any two normalized displacement amplitude attenuation curves of the EWs, a customized ratio, , was used, where and were the normalized displacement of the induced EW at the ’th measurement position for samples 1 and 2, respectively. Displacement amplitudes were normalized by dividing the EW displacement amplitude at each measurement position by the displacement amplitude at the excitation position. If was significantly greater than 1, the displacement in sample 2 damped faster than in sample 1. If was significantly less than 1, sample 1 damped faster than sample 2. If was close to 1, the damping was similar in both samples.This ratio was first calculated for the same 14.0% gelatin phantom to examine the effects of different initial position displacements by changing the focused air-pulse pressure on the sample to 11 and 22 Pa. The normalized displacement attenuation curves are shown in Fig. 2(a) with the ratio , which was very close to 1. As anticipated, this indicated that the initial displacement amplitude did not affect the damping speed of the EW. Fig. 2(a) Comparison between the normalized EW displacement amplitude attenuation curves of the same 14.0% agar phantom at two different excitation pressures; (b) comparison of the normalized EW displacement amplitude attenuation curves of 14.0% gelatin and 1.1% agar phantoms.  This ratio was then calculated to compare the gelatin and agar phantoms. As shown in Fig. 2(b), the normalized displacement in the agar phantoms was higher than in the gelatin phantoms at the same scan position. By using Eq. (2), , which demonstrated that the 14% gelatin damped faster than the 1.1% agar. This result was in agreement with previous findings that gelatin has a higher viscosity than agar, which corresponds to faster damping.16 Therefore, these comparisons showed that this method could be successfully utilized to distinguish two materials of similar stiffness. To induce a similar measured corneal stiffness in the UT and CXL porcine corneas, the IOP of the whole eye was controlled by a custom-built controller comprising a pressure transducer and microinfusion pump connected in a feedback loop. The EW was measured in a porcine cornea by the PhS-SSOCE system before and after UVA-Riboflavin-induced CXL.17,18 EW measurements were taken at IOPs from 15 to 35 mm Hg with 5-mm Hg increments. The EW velocities of the EW in the UT and CXL corneas at the various IOPs are presented in Table 1. It can be observed that before CXL, the EW velocity of the cornea at Hg was calculated as . After CXL, the EW velocity was at Hg. Therefore, based on the EW velocity, it might appear that the stiffness of the cornea is the same. Table 1PhS-SSOCE measured elastic wave (EW) velocities of an untreated (UT) and collagen cross-linking (CXL) cornea at different intraocular pressures (IOPs).
After normalizing the EW displacement amplitudes, the damping features of the EW over the measurement positions were analyzed (Fig. 3). Based on Eq. (2), the ratio of was calculated as , indicating that the damping speed of the cornea had significantly decreased after the CXL treatment. In addition, the normalized displacement attenuation curves were fitted by in which the parameter was treated as the damping speed. According to the fitted results, the damping speed of the UT cornea () was almost twice the damping speed of the CXL cornea (), which confirmed that the damping speed decreased after CXL treatment. One possible reason for this result is that the CXL treatment is a procedure which displaces water from the cornea tissue. The UT cornea contains more water which is responsible for a higher viscosity. Therefore, the EW damps faster in the UT cornea than the CXL cornea. Fig. 3Comparison of the normalized EW displacement amplitude attenuation curves and exponential fit of an untreated (UT) and collagen cross-linking (CXL) porcine cornea at the same measured stiffness but different intraocular pressures.  Kotecha et al.19 measured biomechanical parameters of UT eyes at different IOPs with the ocular response analyzer (ORA, Reichert Inc., Depew, New York) and discussed how the viscosity was negatively correlated with measured corneal stiffness, indicating that the CXL cornea has a lower viscosity than the normal one, which corroborates with our results. However, the ORA only provides the index of corneal hysteresis to reflect the corneal damping ability, but is unable to provide the information about the cornea stiffness. Furthermore, the induced displacement in ORA is in the order of mm, which is hundreds of times larger than in the present method. 3.ConclusionWe have demonstrated a method using PhS-SSOCE to distinguish UT and CXL corneas of the same measured stiffness but at different IOPs. This noninvasive method has potential to evaluate the biomechanical properties of the cornea in vivo for detecting the onset and progression of corneal degenerative diseases such as keratoconus. Future work would entail extracting and separating the elasticity and viscosity of the cornea. AcknowledgmentsThis work was supported, in part, by grants 1R01EY022362, 1R01HL120140, and U54HG006348 from the NIH and PRJ71TN from DOD/NAVSEA. ReferencesZ. L. Hanet al.,
“Air puff induced corneal vibrations: theoretical simulations and clinical observations,”
J. Refract. Surg., 30
(3), 208
–213
(2014). http://dx.doi.org/10.3928/1081597X-20140212-02 JRSUEY 0883-0444 Google Scholar
J. W. RubertiA. S. RoyC. J. Roberts,
“Corneal biomechanics and biomaterials,”
Ann. Rev. Biomed. Eng., 13 269
–295
(2011). http://dx.doi.org/10.1146/annurev-bioeng-070909-105243 ARBEF7 1523-9829 Google Scholar
J. Liet al.,
“Dynamic OCE measurement of the biomechanical properties of gelatin phantom and mouse cornea in vivo,”
Proc. SPIE, 85718 85711T
(2013). http://dx.doi.org/10.1117/12.2007033 PSISDG 0277-786X Google Scholar
G. WollensakE. SpoerlT. Seiler,
“Riboflavin/ultraviolet-a-induced collagen crosslinking for the treatment of keratoconus,”
Am. J. Ophthalmol., 135
(5), 620
–627
(2003). http://dx.doi.org/10.1016/S0002-9394(02)02220-1 AJOPAA 0002-9394 Google Scholar
J. LiuX. He,
“Corneal stiffness affects IOP elevation during rapid volume change in the eye,”
Invest. Ophthalmol. Visual Sci., 50
(5), 2224
–2229
(2009). http://dx.doi.org/10.1167/iovs.08-2365 IOVSDA 0146-0404 Google Scholar
F. A. MedeirosR. N. Weinreb,
“Evaluation of the influence of corneal biomechanical properties on intraocular pressure measurements using the ocular response analyzer,”
J. Glaucoma, 15
(5), 364
–370
(2006). http://dx.doi.org/10.1097/01.ijg.0000212268.42606.97 JOGLES 1057-0829 Google Scholar
B. F. KennedyK. M. KennedyD. D. Sampson,
“A review of optical coherence elastography: fundamentals, techniques and prospects,”
IEEE J. Sel. Top. Quant., 20
(2), 7101217
(2014). http://dx.doi.org/10.1109/JSTQE.2013.2291445 IJSQEN 1077-260X Google Scholar
E. Hernandez-Andradeet al.,
“Evaluation of cervical stiffness during pregnancy using semiquantitative ultrasound elastography,”
Ultrasound Obst. Gyn., 41
(2), 152
–161
(2013). http://dx.doi.org/10.1002/uog.12344 0960-7692 Google Scholar
S. K. VenkateshM. YinR. L. Ehman,
“Magnetic resonance elastography of liver: technique, analysis, and clinical applications,”
J. Magn. Reson. Imaging: JMRI, 37
(3), 544
–555
(2013). http://dx.doi.org/10.1002/jmri.v37.3 1053-1807. Google Scholar
X. LiangS. A. Boppart,
“Biomechanical properties of in vivo human skin from dynamic optical coherence elastography,”
IEEE Trans. Bio-Med. Eng., 57
(4), 953
–959
(2010). http://dx.doi.org/10.1109/TBME.2009.2033464 IEBEAX 0018-9294 Google Scholar
J. Liet al.,
“Air-pulse OCE for assessment of age-related changes in mouse cornea in vivo,”
Laser Phys. Lett., 11
(6), 065601
(2014). http://dx.doi.org/10.1088/1612-2011/11/6/065601 1612-2011 Google Scholar
C. Liet al.,
“Quantitative elastography provided by surface acoustic waves measured by phase-sensitive optical coherence tomography,”
Opt. Lett., 37
(4), 722
–724
(2012). http://dx.doi.org/10.1364/OL.37.000722 OPLEDP 0146-9592 Google Scholar
S. Wanget al.,
“A focused air-pulse system for optical-coherence-tomography-based measurements of tissue elasticity,”
Laser Phys. Lett., 10
(7), 075605
(2013). http://dx.doi.org/10.1088/1612-2011/10/7/075605 1612-2011 Google Scholar
S. Wanget al.,
“Noncontact measurement of elasticity for the detection of soft-tissue tumors using phase-sensitive optical coherence tomography combined with a focused air-puff system,”
Opt. Lett., 37
(24), 5184
–5186
(2012). http://dx.doi.org/10.1364/OL.37.005184 OPLEDP 0146-9592 Google Scholar
J. F. Doyle, Wave Propagation in Structures: Spectral Analysis Using Fast Discrete Fourier Transform, Springer-Verlag, New York
(1997). Google Scholar
S. S. SinghH. B. BohidarS. Bandyopadhyay,
“Study of gelatin-agar intermolecular aggregates in the supernatant of its coacervate,”
Colloids Surf. B, 57
(1), 29
–36
(2007). http://dx.doi.org/10.1016/j.colsurfb.2006.12.017 CSBBEQ 0927-7765 Google Scholar
C. Taoet al.,
“Effects of collagen cross-linking on the interlamellar cohesive strength of porcine cornea,”
Cornea, 32
(2), 169
–173
(2013). http://dx.doi.org/10.1097/ICO.0b013e318264ee6a. CORNDB 0277-3740 Google Scholar
M. D. Twaet al.,
“Spatial characterization of corneal biomechanical properties with optical coherence elastography after UV cross-linking,”
Biomed. Opt. Express, 5
(5), 1419
–1427
(2014). http://dx.doi.org/10.1364/BOE.5.001419 BOEICL 2156-7085 Google Scholar
A. Kotechaet al.,
“Biomechanical parameters of the cornea measured with the ocular response analyzer in normal eyes,”
BMC Ophthalmol., 14
(1), 11
(2014). http://dx.doi.org/10.1186/1471-2415-14-11 BOMPAC 1471-2415 Google Scholar
|


