
|
|
1.IntroductionThe current diagnostic gold standard for melanoma is histopathology, but accurate assessment of early stage lesions remains challenging.1,2 Consequently, some borderline lesions that are biologically benign may appear malignant, and oftentimes the tissue is excised as a preventative measure. It has been suggested that this safe approach has led to an “epidemic” of over-diagnosing melanoma.1,3,4 The fundamental problem is that once an early stage lesion has been excised, one cannot be certain whether it would have progressed to metastatic disease had it been left undisturbed. There have been no direct observations of a melanoma progressing from the early stages to metastasis at the cellular level. Therefore, it is extremely challenging to validate diagnostic criteria for early stage lesions. Also, even though a number of molecular pathways have been implicated in malignant transformation, the exact steps remain uncertain.5 Directly observing these early stage transformations might be possible in animal models, with the use of a noninvasive, in vivo microscopy technique that provides disease-specific contrast. The focus of this paper is on developing such a technique and testing it in vivo on a mouse model that architecturally resembles human skin. Perhaps the most important optically accessible biomarker of melanocyte activity is the melanin pigment generated by melanocytes. Melanin pigment expression is regulated by complex interactions between melanocytes and the surrounding tissue,6 and is implicated both as a possible risk factor7–9 and an indicator of melanoma.10–12 In mammals, melanin is produced primarily in two forms: eumelanin and pheomelanin.13,14 Pheomelanin can act as a photosensitizer, and its production is associated with increased oxidative stress,15 while eumelanin has a more photoprotective role.16 The ratio between eumelanin and pheomelanin increases with increased expression of the master regulator gene, microphthalmia-associated transcription factor (MITF)17 and the melanogenic genes that it upregulates.18 This normally occurs in the tanning response, in which UV-damaged keratinocytes release -MSH, which upregulates MITF in nearby melanocytes via the MC1R receptor and its downstream effectors.19–21 Several studies seem to indicate that dysplastic (premalignant) lesions express higher proportions of pheomelanin, while malignant melanomas express higher proportions of eumelanin.7,10,11 Optical methods for probing pigment and other structures in skin in vivo include linear absorption/reflectance,11 confocal reflectance microscopy,22 optical coherence tomography,23 multiphoton fluorescence and fluorescence lifetime,24–29 multiphoton harmonic microscopy,30 and photoacoustic microscopy/tomography methods,31 and hybrid approaches that combine two or more of these modalities.32 Confocal reflectance is the most widely used and well-established in the clinical setting, but the technique is not pigment-specific. In confocal imaging, the conventional method for diagnosing melanoma involves observing blood flow and tissue morphology.33 Photoacoustic methods address the problem of specificity by providing contrast from pigmented structures, but they lack cellular detail from nonpigmented cells that may provide important histologic information. Multiphoton techniques address these shortcomings by providing high-resolution images based on nonlinear contrast mechanisms that have molecular-specific signatures. This enables in vivo histology, providing details on tissue architecture, morphology of individual cells, and even biochemical content. Previously, we have demonstrated that a two-color multiphoton technique—pump–probe microscopy—reveals differences in pigment chemistry between classes of pigmented lesions, by imaging thin () sections of biopsied tissue.12,34 We have also applied pump–probe to in vivo imaging of pigmented lesions in a mouse xenograft model of human melanoma,35 and demonstrated a multimodal approach that combines pump–probe with confocal reflectance and multiphoton autofluorescence.36 Here, we use pump–probe to track the growth and development of pigmented lesions in a larger number of animals, compare the pump–probe images with the other modalities, investigate intensity-dependent effects, and compare the in vivo pump–probe responses of three different melanoma cell lines. We find that pump–probe imaging gives more useful contrast for pigmented structures over a large range of spatial scales ( to 1 cm), making it a potentially useful tool for tracking the progression of pigmented lesions without the need to introduce exogenous contrast agents. However, when compared with imaging thin tissue sections in transmission mode, the higher optical intensity required to overcome scattering in thick tissue leads to higher-order nonlinearities in the optical response of melanin (e.g., two-photon pump and one-photon probe) that present additional challenges for interpreting the time-resolved pump–probe responses. 2.Materials and Methods2.1.Multimodal Imaging SetupIn vivo microscopy was performed with a custom-built laser scanning microscope, as shown in Fig. 1, which is equipped to detect traditional multiphoton signals [multiphoton autofluorescence and second-harmonic generation (SHG)], confocal reflectance, and pump–probe. Pump–probe contrast is obtained by modulating the pump beam and monitoring the probe beam with a lock-in amplifier for modulation transferred to the probe by nonlinear optical interactions that couple pump and probe beams. Overall, the pump–probe signal is affected by two-photon absorption, stimulated Raman scattering, cross-phase modulation, stimulated emission, ground-state depletion, and excited-state absorption. These signals are either positive or negative depending on whether the interaction causes the probe to decrease or increase in the presence of the pump. They also depend on the time delay between the pump and probe; therefore, pump–probe signals comprise a set of bipolar multiexponential functions. In effect, the pump–probe signal provides a molecular fingerprint, sensitive to energy level structure, excited-state lifetimes, and the pump and probe wavelengths. Fig. 1In vivo pump–probe microscope combining the following modalities: confocal reflectance; multiphoton autofluorescence and second-harmonic generation (SHG); and pump–probe microscopy.  In these experiments, we have chosen a pump wavelength and probe wavelength because this combination was found to give high contrast between Sepia eumelanin and synthetic pheomelanin.12,37 The probe pulses were provided by a Spectra-Physics Tsunami (810 nm, 80 MHz, duration). A portion of the beam was converted by a Coherent Mira OPO to 720 nm, and modulated with a 2 MHz square wave by an acousto-optic modulator to supply the pump pulses. The time delay, , between pump and probe pulses was controlled by a motorized delay line. Both beams were combined by a dichroic mirror (Chroma DCXR760 long-pass) before the galvanometric scan mirrors. The beams were focused into the specimen by a microscope objective; there, absorption of the pump perturbs the optical absorption properties, imprinting the 2 MHz modulation onto the probe beam. Both reflected and scattered light exit the graft and were collected by the objective. In all the measurements presented here, both pump and probe beams were incident on the sample, and all modalities—pump–probe, fluorescence, second harmonic, and confocal reflectance—were acquired simultaneously. Fluorescence and second harmonic light were reflected by a dichroic mirror (Semrock FF662 long-pass) and detected with a photomultiplier tube (Hamamatsu R3896), filtered with a Thorlabs FES0600 short-pass filter and BG-39 glass to reject residual excitation light. Given the transmission properties of the FES0600, the SHG signal was collected only for the 810-nm excitation. The photomultiplier current was amplified with a transimpedance amplifier (Terahertz Technologies Inc., PDA 700). Reflected light passed back through the polarizing beam splitter, was descanned by the galvos, reflected by a glass coverslip, focused by a 30-cm lens into a confocal pinhole, and detected with an amplified silicon photodiode (Thorlabs PDA100A). Scattered, depolarized near-infrared light was directed with a polarizing cube to a large-area silicon photodiode (Thorlabs PDA55, filtered with two Chroma HQ815/65 bandpass filters to reject the pump beam). This probe signal was analyzed with a lock-in amplifier for the 2 MHz pump–probe modulation transfer signal. Different molecular species were resolved by acquiring a series of pump–probe images, each at a different time delay (i.e., a delay stack), and analyzing the stack with methods analogous to those used in hyperspectral imaging and fluorescence lifetime imaging. Images were typically acquired at or pixel resolution. Delay stack acquisition time varied from to 15 min depending on the resolution, pixel dwell time, number of delays acquired, and number of frames averaged at each delay. Acquisition time for each image is noted in the figure captions, not counting the motor repositioning time. Optical power through the objective is estimated by measuring with a power meter before the entrance to the microscope and multiplying by the transmissivity of the microscope optical train. 2.2.Xenograft Mouse Model of Human MelanomaMultiphoton imaging was performed on a xenograft mouse model. Melanoma cells are cultured in a human skin graft that is surgically implanted on the dorsal region of a mouse.38,39 Although these artificially reconstructed melanomas are clearly different from naturally arising melanoma in human patients, this model provides more faithful representation of the morphology and architecture of human skin than native mouse models,40 and serves as an excellent testing ground for instrument development. The grafts were prepared as follows: primary human keratinocytes and human melanoma cells were cultured in a 10:1 ratio onto pieces of devitalized human dermis (), and kept in culture for 3 to 4 days until cells reached confluence on and around the dermis. Primary human keratinocytes were isolated from surgically discarded foreskin samples obtained from Duke Children’s Hospital in accordance to an institutionally approved IRB-protocol. Briefly, skin samples were treated with dispase at 4 deg overnight to separate the epidermis from dermis. The epidermis were carefully peeled from the dermis with a pair forceps, chopped into small pieces, and then digested with trypsin for 5 to 10 min. The cell suspension was neutralized with 10% fetal bovine serum/Dulbecco's modified eagle medium (Life Technology, Grand Island, New York) and pelleted by centrifugation at 12 krpm. The isolated cells were cultured at 37 deg and 5% with serum-free keratinocyte culture media, and used at passage 2 for skin regeneration. All cell culture reagents were purchased from (Invitrogen Life Technologies, Grand Island, New York). So far, we have imaged grafts from three cell lines: A2058, derived from a melanoma metastasis in a lymph node (ATCC® CRL-11147™); WM-115, derived from a primary (vertical growth phase) tumor in the skin of a patient with metastatic melanoma (ATCC® CRL-1675™); and SK-MEL28, derived from a primary tumor located in the skin (ATCC® HTB-72™). These three cell lines were chosen as a starting point because they are readily available, produce measurable pigment, and exhibit invasive behavior. These regenerated skin tissues were then xenotransplanted onto immunodeficient mice (, A2058; , SK-MEL28; , WM-115; and , control) and allowed to heal for two weeks. During in vivo image acquisition, the mice were anesthetized with isoflurane. To enhance optical penetration, the grafts were treated with a 1:1 mixture of polyethylene glycol and propylene glycol.41 This clearing agent was added in sufficient quantity to wet the graft shortly after anesthesia induction, and allowed to penetrate during the preparation time before imaging, typically 15 to 30 min. A coverslip was clamped on top of the graft to provide a clear window for imaging and to minimize motion artifacts. These experiments were conducted in accordance with an animal protocol approved by the Duke University Animal Care and Use Committee. 3.Results and Discussion3.1.Simultaneous Multimodal Imaging With Cellular DetailFigure 2 shows in vivo images of a human skin xenograft with SK-MEL-28 melanoma cells in two different areas of the graft, with all three imaging channels acquired simultaneously. These images were acquired with a water immersion objective. A brief description of the observed features follows with the intent of comparing these imaging modalities with one another. A comparison between the in vivo pump–probe and histopathology is forthcoming. Fig. 2Simultaneous in vivo multimodal imaging in two different regions of a graft. Depths selected in region A are the superbasal layer of the epidermis at (a–c) and the basal layer at (d–f). Depths selected in region B are the basal layer at (g–i) and the dermis at (j–l). Confocal images (a, d, g, and j) show texture typical of keratinocytes, collagen, and even blood vessels are visible (cyan arrow). Autofluorescence/SHG signal images (b, e, h, and k) show individual keratinocytes, dermal collagen fibers, and bright cells in the dermis that are not present in the other channels (green arrow). Pump–probe images (c, f, i, and l) reveal pigment that is not apparent in the other channels (red arrows) and blood vessels (cyan arrow). Acquisition times: (a–f) ; (g–l) .  Keratinocytes have a granular reflectance texture22 in the reflectance channel in Figs. 2(a) and 2(g), and are recognized individually in Figs. 2(b) and 2(h) by their fluorescent cytoplasm and dark nuclei.43 Comparing Figs. 2(d), 2(e), and 2(f), it can be seen that the pump–probe provides high contrast in which pigmented structures stand out from the background, and more extensive pigmentation than can be discerned from the other modalities—note particularly the bright cells in Fig. 2(f) with branching cytoplasmic extensions (dendrites). Figure 2(i) shows two pigmented cells with dendritic processes that are indistinct in the other modalities (red arrows). Deeper in the dermis, collagen is discernible from its characteristic reflectance texture—compare Fig. 2(j) with Fig. 2(a)—and from its web-like appearance in the second harmonic channel in Fig. 2(k). Figure 2(k) also shows pigmented bright cells (green arrow) that are possibly fibroblasts (visible by SHG in the collagen they produce44) or immune cells (visible by autofluorescence45). Additionally, microvasculature is identified from its morphology in the reflectance channel and from transient absorption of hemoglobin in the pump–probe channel—see Figs. 2(j) and 2(l), cyan arrows. In Figs. 2(c), 2(f), and 2(i), pigmented cell dendrites may be distinguished from vasculature by their morphology—dendrites extend from cell bodies and are thinner than the vasculature observed in Fig. 2(l). This is validated by the different pump–probe responses of melanin and hemoglobin in Sec. 3.3. The structural information recorded in the autofluorescence image provides an excellent context for the pump–probe image, which specifically highlights pigment. Although it is generally accepted that melanin provides a bright near-infrared confocal reflectance signature,46 confocal reflectance microscopy does not always reveal pagetoid melanoma cells that are obvious in conventional histology;47 it is unknown why this is so. Comparing Figs. 2(d) and 2(e), it appears that the brightest features in the near-infrared reflectance [Fig. 2(d)] correspond with the brightest features in the multiphoton fluorescence channel [Fig. 2(e)]. A hypothesized explanation that warrants further investigation is that the brightest features in Fig. 2(d) might actually be near-infrared emission instead of reflection.48,49 The presence of such a bright fluorescence might be an indicator of cellular oxidative stress or photochemical transformations in the melanin itself caused by exposure to intense laser light.42,50 This is discussed in more detail in Secs. 3.4 and 3.5. 3.2.Monitoring Tumor Growth With Wide Field-of-View Pigmentation SurveysFigure 3 shows wide field-of-view pump–probe images of a xenograft (melanoma cell line WM115), acquired with a low-NA, low-magnification objective (), acquired in tiles, with power delivered to the sample (14-mW pump, 70-mW probe). The brightest features in the fluorescence/SHG channel are keratin autofluorescence from the albino mouse hair surrounding the graft. Some fluorescence/SHG structure and detail can be seen within the graft itself, but assigning these to particular fluorophores or collagen SHG would require further information from the fluorescence lifetime or wavelength dependence. The pump–probe images show the extent of the pigmented lesion as it develops. There is a growth from 8 to 10 weeks, and then emergence of a large, concentrated tumor at 11 weeks. This large pigmented lesion appears to have been preceded by a lesion at 9 weeks that was lightly pigmented but was bright in the fluorescence/SHG channel. Establishing the nature of the 9th-week lesion would have required a physically disruptive punch biopsy, or more information from, e.g., a fluorescence lifetime measurement. Fig. 3Pump–probe imaging tracking tumor development over several weeks. Pump–probe delay is 280 fs. Grayscale: multiphoton autofluorescence and SHG signal collected by photomultiplier tube. Red/yellow: pump–probe positive response. Blue/cyan: pump–probe negative response. Acquisition times: 8th week, , 3.5 min total; 9th week, , 4.2 min total; 10th week, , 2.7 min total; 11th week, , 1.7 min total.  3.3.Using Delay Stacks to Resolve Pigment ContentThe images presented in Figs. 2 and 3 were acquired at a single probe delay, 280 fs, where the response of Sepia eumelanin is dominated by excited-state absorption (positive signal, shown in red), and synthetic pheomelanin standard is dominated by ground-state bleaching (negative signal, blue).12,42 A more detailed picture of the pigment mixture can be obtained by acquiring a series of images at different probe delays and analyzing the entire stack. In our previous studies of thin biopsy sections of pigmented lesions,12 the optical intensity of the pump and probe was low ( total power with a objective) in order to ensure the transient absorption signal was linear with respect to the pump intensity and linear with respect to the probe intensity , i.e., . Indeed, at low intensity, we observe melanin signatures that are consistent with our observations in thin tissue sections.12 Figure 4(a) shows a false-color pump–probe image from a xenograft that was seeded with WM115 melanoma cells, acquired with a objective under low peak intensity conditions comparable to those in Fig. 3. The false-color image was generated using phasor analysis at 0.25 THz,51 which maps the pump–probe response of each pixel onto a two-dimensional coordinate system (, ) by means of an overlap integral with sine and cosine functions. The resulting phasor histogram is shown in Fig. 4(b), where pixels with similar pump–probe responses cluster together. Points on the left-hand plane of the phasor histogram are dominated by a negative (ground-state depletion) signal, while points on the right-hand plane are dominated by a positive (excited-state absorption) signal. The averaged responses for the regions circled in red and green are shown in Fig. 4(c). In light of our recent findings,42 the differences in the pump–probe response could be attributable to the varying eumelanin/pheomelanin ratio, metal ion content, oxidation, or aggregation. It is a matter of ongoing research to understand the relative importance of these pigment chemistry-related parameters in human tissue and their roles as possible indicators of disease. Fig. 4pump–probe delay stack. Approximately 84 mW delivered to specimen through objective, pixel dwell time. (a) False-color image of pump–probe stack. (b) Phasor histogram (at 0.25 THz) with pixels having excited-state absorption response circled in red (region A), and ground-state depletion response circled in green. (c) Averaged response from regions A and B. Signals normalized to have root mean square value of 1. Acquisition time: 3 min for a delay stack. 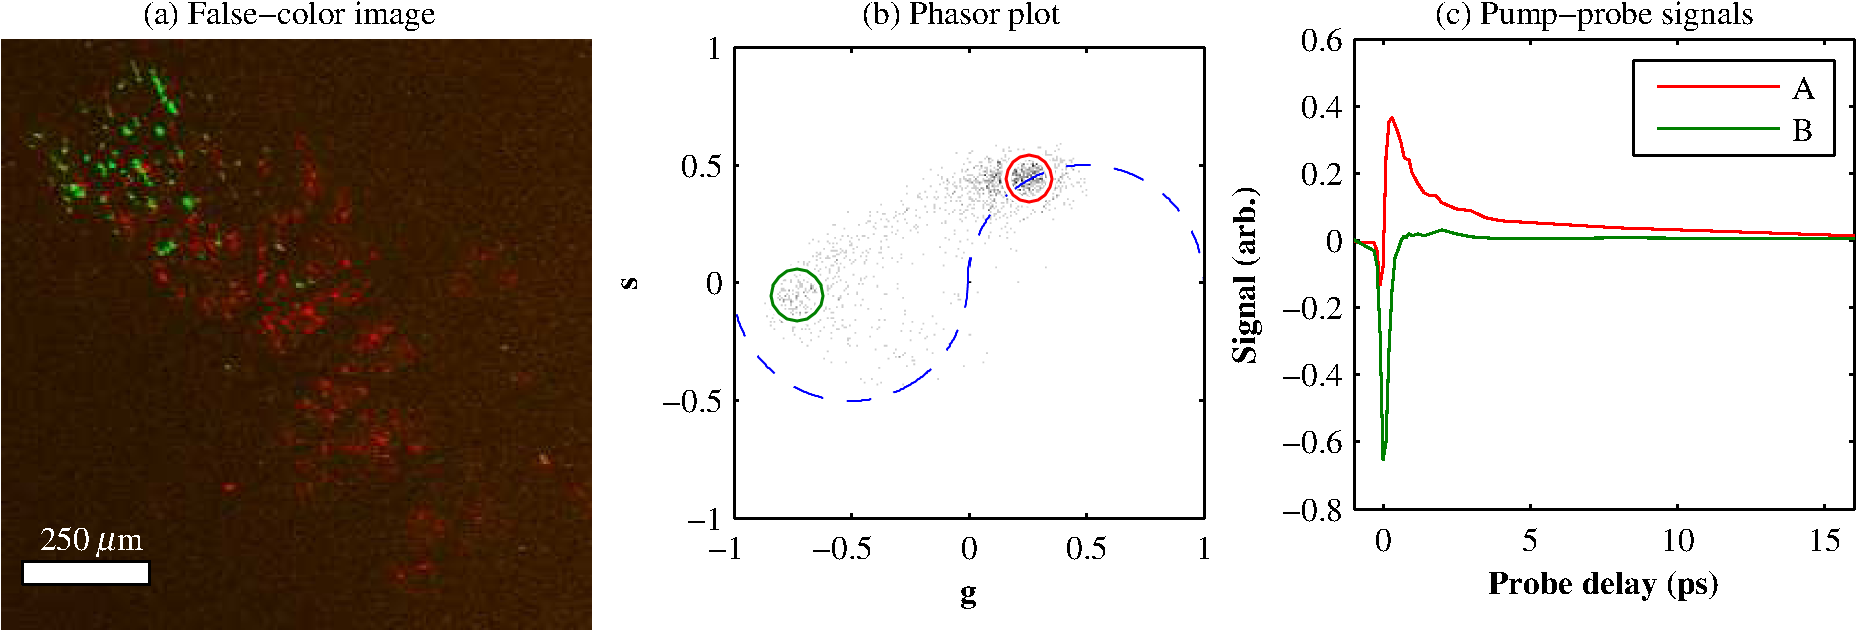 To characterize the response of hemoglobin in vivo, under our imaging conditions, we selected several delay stacks in which the pump–probe signal originated from vascular structures, as shown in Figs. 5(a)–5(c). The corresponding phasor histograms are shown in Figs. 5(d)–5(f). The averaged pump–probe response of these images is compared with the known response of eumelanin and EDTA-washed eumelanin in Fig. 5(g). Although the difference is subtle, eumelanin has a longer lifetime than hemoglobin. Figure 6 shows an application of this finding in discriminating pigmented dendritic processes from vasculature by examining delay stacks acquired at the same location as Fig. 2. Although the difference between hemoglobin and the melanin signal is clear in this instance, it may be impractical to resolve hemoglobin from melanin under low-SNR conditions. However, swapping pump and probe wavelengths hold promise as a future improvement. This would produce a strong excited-state absorption from both oxygenation states, in sharp contrast to the ground-state bleaching we have observed from all melanins at 810/720. Swapping wavelengths also adds the advantage of resolving hemoglobin oxygenation,52 but we do not do this routinely in the interest of time. A dual-detector setup would make this more convenient. Fig. 5Imaging of vasculature in vivo. (a–c) False-color images of three delay stacks that show clear vasculature structure in pump–probe channel (sum across pump–probe delay shown in red); fluorescence/SHG overlaid in grayscale for context. (d–f) Corresponding phasor histograms (0.25 THz) of in vivo hemoglobin response. (g) Averaged in vivo hemoglobin response for each of the images shown (red lines), compared with eumelanin and EDTA-washed eumelanin pump–probe response (black lines). Scale bars . Acquisition times: (a) 3 min for delay stack; (b) 11 min for delay stack; and (c) 3 min for a delay stack.  Fig. 6Comparison of pump–probe response of vasculature with pigmented cell and its dendrites. (a) False-color image (positive summed signal red, negative summed signal blue) generated from a delay stack acquired near the region shown in Figs. 2(j)–2(l), showing vasculature. (b) False-color image generated from a delay stack acquired near the region shown in Figs. 2(d)–2(f), zoomed-in to show a pigmented cell and its dendritic extensions. (c) Averaged pump–probe responses of the regions outlined in (a) and (b). Signals normalized to have root mean square value of 1. Scale bars . Acquisition times 12 min for each delay stack. 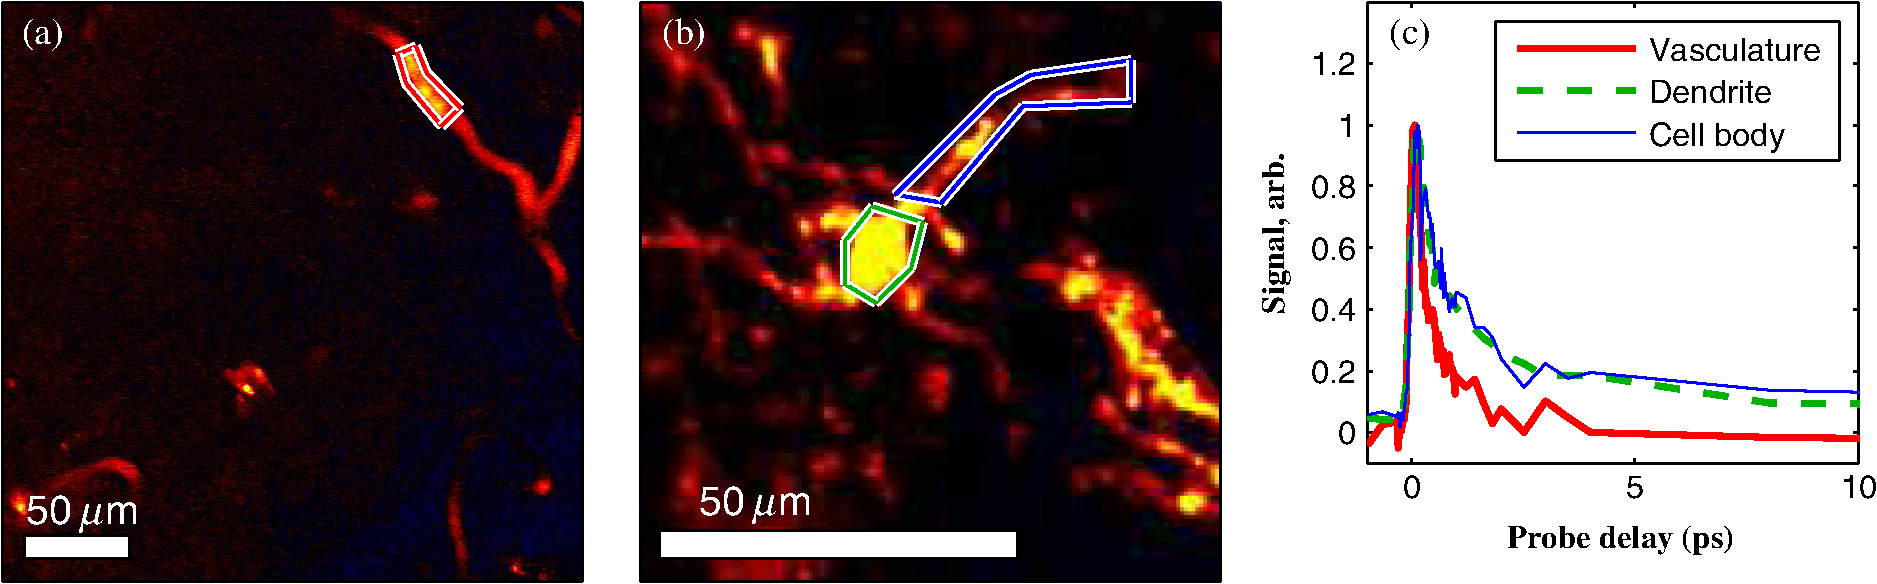 In addition to melanin and hemoglobin pigments, we have also observed what appears to be a nonspecific, instantaneous background signal. Figure 7 shows a few examples. A negative-signed background signal was found in 30% of the 781 delay stacks we have acquired to date, while a positive-signed background signal was found in only 7% of the delay stacks. Because this signal is relatively unstructured in the pump–probe images and it has been observed in both the epidermis and dermis, it is unlikely to have come from melanin pigment. Pump–probe mechanisms that can produce instantaneous signals include stimulated Raman scattering, two-photon absorption, transient absorption/bleach/gain with exceedingly short lifetimes, and cross-phase modulation. Raman is possible because both the abundant keratin protein and the polyethylene glycol we use as a topical clearing agent have strong peaks in the vicinity of (the difference frequency of the 720-nm pump and 810-nm probe). However, in our configuration, constrains Raman signals to be negative-signed; therefore, Raman is not a likely source for this background signal. On the other hand, cross-phase modulation (i.e., Kerr lensing) could, in principle, result in a positive- or negative-signed signal, depending on whether the details of the tissue’s optical properties, spatial overlap of the beams, and collection apertures result in an increase or decrease of scattered probe light reaching the detector. Although further experiments will be necessary to discern the source of this signal, it is important to keep in mind when comparing pigment expression profiles of different study populations that a large number of pixels will have a negative instantaneous signal that is likely unrelated to melanin expression. Fig. 7Examples of instantaneous “background” signal in pump–probe images. Left column: multiphoton fluorescence/SHG. Middle column: pump–probe image at time-overlap. Right column: pump–probe signal for highlighted regions of interest. Scale bars . Acquisition times: (a–l) delay stack; (m–o) 6 min for a delay stack.  3.4.Optical Intensity-Dependence of Melanin Pump–Probe ResponseFor diagnosing melanoma from pump–probe images of melanin, the most important factor is choosing imaging parameters (pump and probe wavelengths, etc.) that maximally expose heterogeneous distributions of melanin chemistry.53 In our initial studies on thin sections of biopsied tissue, we selected and , because at these wavelengths, eumelanin and pheomelanin exhibit nearly orthogonal pump–probe responses.12 Recently, we have found that the pump–probe response of melanins also depends on applied optical intensity.42 Increased intensity tends to increase the contribution of excited-state absorption in both eumelanin and pheomelanin, potentially diminishing contrast. There, we also reported that a total applied power of irreversibly modifies black hair melanin so as to permanently increase the proportion of excited-state absorption. The mechanisms for this change are unknown, though they might be related to activation of stepwise-excited fluorescence42,54,55 or melanin photoionization (see Sec. 3.5). Note that the 10 to 100 mW typically used for in vivo multiphoton imaging far exceeds this 1 mW threshold. In other experiments, where we image thin histology sections in transmission mode, we currently restrict the power to 0.5 mW total to avoid these intensity-dependent effects. However, this is too little power to see a useful signal in vivo, which relies on collecting the small portion of probe light that is backscattered after the focal spot.56 Here, we observe a similar intensity-dependent loss of contrast in our in vivo experiments, though the exact power dependence and damage thresholds are difficult to determine because a variable amount is lost to scattering and absorption in the tissue. Figure 8 shows this effect in a series of delay stacks acquired at different probe power levels: 7, 24.5, and 70 mW. The pump power was fixed at 9.8 mW (the maximum from the OPO on that day). The distributions of pump–probe responses for each pixel in the delay stack are shown as phasor histograms51 in Figs. 8(f)–8(d). As with Fig. 4(b), pixels that fall on the left half of the phasor histogram are dominated by ground-state depletion, while pixels that fall on the right half are dominated by excited-state absorption. It can be seen from Fig. 8 that increasing the probe power causes the melanin signal to shift toward a higher proportion of excited-state absorption, consistent with our previous findings.42 Fig. 8Repeated imaging at varying optical intensity in a xenograft with A2058 melanoma cells at 36 days after the transplant. (a–c) False-color images (positive signal red, negative signal blue) of same region, imaged at fixed 9.8 mW pump and varying probe power level. (f–d) Corresponding phasor histogram showing a shift in pump–probe response distribution with varying power level. (g) Comparison of averaged pump–probe responses, showing a shift toward excited-state absorption with increasing probe intensity. Scale bars . Acquisition times: delay stack.  Whether these shifts are accompanied by cumulative, irreversible changes and damage42 remains to be seen. If so, the pump–probe response itself would evolve during stack acquisition, which would have an effect similar to that of photobleaching on fluorescence lifetime imaging.57 In either case, the intensity dependence of melanin’s pump–probe response will be an important factor in all in vivo and epi-mode pump–probe imaging, unless significant improvements can be made in detection sensitivity. Such improvements might be possible with a large-area photodiode mounted directly underneath the objective.56 It might also be possible to compensate for intensity-dependent effects with an accurate measurement of power delivered to the focal plane, if the intensity dependence of melanin were well-characterized. However, such compensation may be impractical in thick tissue in which an unknown amount of light is lost to scattering and absorption. 3.5.Melanin’s Optical Response at High IntensityThis preclinical mouse model allows for the investigation of the effects of excessive optical intensity without the risk of harming human subjects. The primary concern in using high repetition-rate (MHz) lasers to image pigmented skin lesions is from thermal damage.58 This can lead either to imaging artifacts or to damage of the pigmented cells and surrounding tissue. Of the image stacks we have acquired with incident power, we have observed damage (e.g., cavitation) during imaging in only 7% of the cases (in 73 out of 1079 image stacks); 90% of the time, the damage was no deeper than the stratum corneum (in 66 out of 73 stacks showing damage). One effect of local heating on pump–probe spectroscopy is a long-lived signal that manifests itself as a signal in the lock-in Y channel and a baseline offset visible in the lock-in X channel at negative probe delays ().37 In some instances, we have also observed rapid fluctuations in both the pump–probe and fluorescence channels. This “twinkling” is also accompanied by a bright signal on the photomultiplier tube, and has a grainy appearance in still frames in both the pump–probe and fluorescence images, as shown in Figs. 9(A) and 9(B). Possible explanations for this phenomenon include “activated melanin fluorescence,54,55 oxidation or photodamage,42,50 or plasma generation through multiphoton ionization, which is known to generate intense luminescence.59 In unpigmented tissue, multiphoton ionization with light is a five-photon process with a threshold of .60 Neglecting scattering and absorption losses, the conditions here would generate a peak intensity of , which is likely to generate plasma compared to the at-threshold intensity. However, in densely pigmented tissue, this threshold may be significantly lower, especially considering the presence of long-lived electronic states in melanin that enable multiphoton absorption even with continuous-wave near-infrared light.54,55 Fig. 9z-stack of pigmented cells under high-intensity illumination (approximately 85 mW total power delivered to specimen through a dry objective, pixel dwell time). Top row: multiphoton fluorescence/SHG; bottom row: pump–probe at zero time delay. In the most densely pigmented regions, fluorescence/SHG image shows bright, grainy appearance (A), while pump–probe image shows bright, grainy, positive, and negative fluctuating signals (B). Although pump–probe signal is primarily positive (red/yellow) when in-focus, indicating eumelanin, the pump–probe signal is negative (blue) when focal plane is below (C) and above (D) the pigment. Scale bar ; all images have same scale. Acquisition times: frame.  Another artifact that arises from high optical intensity is a change in the sign of the pump–probe signal when the pigment is out of focus. Figure 9 shows a growing network of A2058 melanoma cells imaged at different focal depths. The signal at zero probe delay () is positive (red/yellow) when the cells are in focus, but turns negative (blue/cyan) when the cells are out of focus. This sign-flip anomaly is relatively rare: we have observed it in about 8% of the pump–probe z-stacks we have acquired in vivo (in 50 out of 619 z-stacks acquired). One might compensate for this artifact by averaging the response over different focal planes. 3.6.Comparing Pump–Probe Signatures From Different GroupsOne of the motivations for this instrument development work is to determine whether different melanoma cell lines have different in vivo pump–probe signatures. So far, to that end, we have imaged xenografted mice with three different cell lines: A2058 from a lymph node metastasis; and SK-MEL-28 and WM115, both from vertical growth phase primary tumors. Figures 10(a), 10(b), and 10(c) show the overall pigment expression of each of these cell lines in the form of cumulative phasor histograms, generated from the collection of pump–probe delay stacks acquired to date (only pixels above a signal-to-noise threshold of 0.25 are included). Pixels that fall in the upper-right quadrant () represent an excited-state absorption response attributable to a eumelanin-like pigment (see Fig. 4) or hemoglobin (see Fig. 5). However, hemoglobin is unlikely to be a significant contributor to these phasor histograms in Fig. 10 because very few of these images contain any discernible vascular structure. Pixels that fall in the lower-left quadrant () represent negative-signed signals, such as pheomelanin-like pigment (see Fig. 4) and the spatially diffuse, nonmelanin, negative signal shown in Fig. 6. As discussed in Sec. 3.3, the origin of this negative signal is uncertain, so the following discussion will focus on the melanin pigment signatures in the upper-right quadrant. Fig. 10Top row: cumulative phasor histograms. Bottom row: phasor contours, zoomed into upper-right quadrant (positive pump–probe signals only). Each color represents the 50% contour of a cumulative phasor histogram for a different animal. Left: A2058 cell line, sourced from a lymph node metastasis. Center: SK-MEL-28 cell line, sourced from primary tumor. Right: WM115 cell line, sourced from a vertical growth phase primary tumor with confirmed metastases. 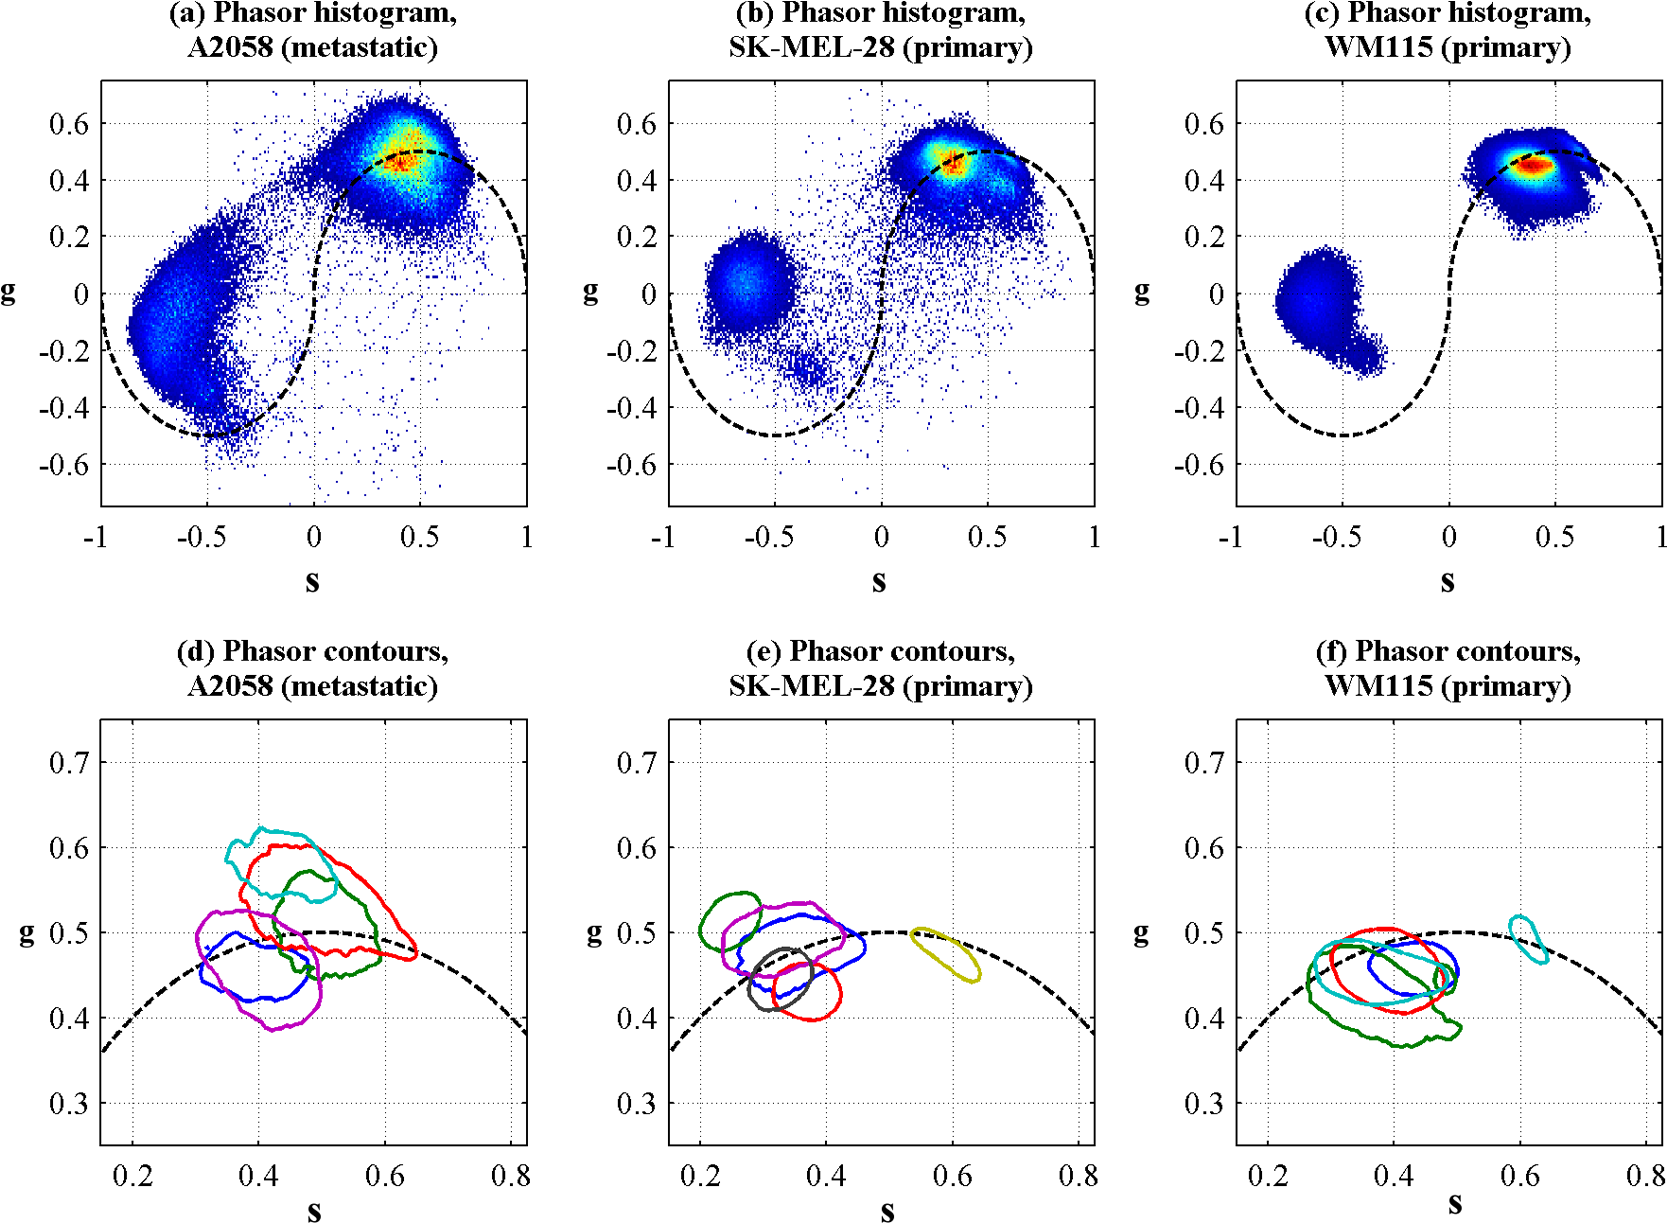 In order to compare the pump–probe response distributions acquired from individual mice, contour lines were rendered around the 50% level of each mouse’s phasor histogram (the histograms were first smoothed by a neighborhood moving average filter), and then plotted in a different color for each mouse. Only mice that had at least 10,000 above-threshold pixels were included. Figures 10(d), 10(e), and 10(f) show the results, zoomed-in to the upper-right quadrant. Although there is considerable variation from one mouse to another, there appears to be a difference between the pigment produced by melanoma cells that originated in a lymph node metastasis [Fig. 10(d)] and pigment produced by melanoma cells that originated in a primary tumor [Figs. 10(e) and 10(f)]. These results should be interpreted with caution, though, because throughout the time course of these experiments, the apparatus was modified and improved and different power levels were used. However, Fig. 10 does clearly demonstrate that phasor analysis of in vivo pump–probe images can be used to compare pigment signatures between different groups. The main challenge in future experiments will be to control for the intensity-dependent effects discussed in Secs. 3.4 and 3.5. Possible solutions are to regulate the optical power delivered to the focal plane, compensate for intensity-dependent effects in postprocessing, or separate linear from nonlinear contributions using a multiharmonic lock-in approach. Precise regulation of optical intensity may be impractical in thick tissue (such as the human skin xenografts presented here) because an unknown amount of power is lost to scattering and absorption before the focal plane. However, native mouse skin is significantly thinner than human skin. Even though mouse and human skin differ in terms of morphology, an all-mouse model might be more appropriate for the purpose of studying the underlying molecular connections between malignancy and pigment chemistry. To that end, in vivo pump–probe imaging experiments in a genetically modified mouse model have been conducted, and will be the subject of a future manuscript. 4.Summary and ConclusionsWe have demonstrated a multimodal in vivo imaging approach that integrates reflectance confocal, multiphoton fluorescence and SHG, and pump–probe microscopy into a single instrument. This multimodal imaging system is able to track the growth of pigmented lesions over time in a xenograft human melanoma model on mice. Although the other channels provide structural information, only the pump–probe imaging channel provides pigment-specific pigment contrast, allowing visualization of pigmented lesions from the microscopic scale of single cells and dendrites up to the mesoscopic scale of overall lesion structure. Pump–probe can also obtain time-resolved pigment signatures that are the product of a number of pigment chemistry-related parameters (e.g., eumelanin/pheomelanin content, metal ion content, aggregation size) that are possible indicators of disease. However, the primary obstacle to quantitative analysis is the nonlinear optical response of melanin, which changes the time-resolved pump–probe trace as a function of optical intensity. Any attempts to correlate the in vivo pump–probe response with disease state and lesion progression should take this account into consideration. One method to minimize these effects is to keep the optical intensity low and maintain consistent power levels when comparing sets of data. However, lower power comes at the cost of reduced SNR in all imaging modalities. In addition, it would be extremely challenging to maintain the same intensity at every imaging plane in thick tissue, because an unknown amount will be lost to scattering and absorption in the upper layers of the tissue. It may be possible to use other methods, such as multiharmonic lock-in detection,61,62 to separate the linear and nonlinear components of the pump–probe response. In addition, it should be noted that the to 100 mW power levels used here and in other multiphoton skin imaging techniques far exceed the 1 mW required to irreversibly modify the pump–probe response of melanin.42 Again, the exact amount of power reaching the pigment in thick scattering tissue is unknown, but it is a potential concern. It is also known that exposing melanin to intense near-infrared pulses can significantly increase fluorescence.54 The susceptibility of melanin to optically induced changes is affected by iron content;42 other factors, such as DHI/DHICA and eumelanin/pheomelanin ratio, may contribute. Although thermal mechanical damage from ultrafast pulses in pigmented cells has been characterized,58 further studies should be conducted to determine the risk of more subtle and long-term damage from interactions between melanin and ultrafast near-infrared pulses. Finally, the ability to track changes in pigmented lesions over time and the ability to resolve the morphology of individual cells may provide the opportunity to accomplish longitudinal studies that would be impossible with histopathology, with potential applications in assessing surgical margins. In addition, the use of melanin as the imaging contrast agent may provide insight into some of the biochemical mechanisms responsible for early tumor formation, metastasis, and even drug resistance. AcknowledgmentsThe authors gratefully acknowledge funding from the NIH (Grants 1RC1CA145105, R01-CA166555, P30-AR066527, and fellowship 1F32CA168497-01A1). ReferencesE. J. Glusac,
“The melanoma ‘epidemic’, a dermatopathologist’s perspective,”
J. Cutaneous Pathol., 38
(3), 264
–267
(2011). http://dx.doi.org/10.1111/cup.2011.38.issue-3 JCUPBN 0303-6987 Google Scholar
J. E. Frangoset al.,
“Increased diagnosis of thin superficial spreading melanomas: a 20-year study,”
J. Am. Acad. Dermatol., 67
(3), 387
–394
(2012). http://dx.doi.org/10.1016/j.jaad.2011.10.026 JAADDB 0190-9622 Google Scholar
R. A. SwerlickS. Chen,
“The melanoma epidemic: more apparent than real?,”
Mayo Clin. Proc., 72
(6), 559
–564
(1997). http://dx.doi.org/10.4065/72.6.559 MACPAJ 0025-6196 Google Scholar
R. A. SwerlickS. Chen,
“The melanoma epidemic: is increased surveillance the solution or the problem?,”
Arch. Dermatol., 132
(8), 881
–884
(1996). http://dx.doi.org/10.1001/archderm.1996.03890320029004 ARDEAC 0003-987X Google Scholar
B. Bandarchiet al.,
“Molecular biology of normal melanocytes and melanoma cells,”
J. Clin. Pathol., 66
(8), 644
–648
(2013). http://dx.doi.org/10.1136/jclinpath-2013-201471 JCPAAK 0021-9746 Google Scholar
Y. YamaguchiM. BrennerV. J. Hearing,
“The regulation of skin pigmentation,”
J. Biol. Chem., 282
(38), 27557
–27561
(2007). http://dx.doi.org/10.1074/jbc.R700026200 JBCHA3 0021-9258 Google Scholar
S. Pavelet al.,
“Disturbed melanin synthesis and chronic oxidative stress in dysplastic naevi,”
Eur. J. Cancer, 40
(9), 1423
–1430
(2004). http://dx.doi.org/10.1016/j.ejca.2003.11.035 EJCAEL 0959-8049 Google Scholar
S. Takeuchiet al.,
“Melanin acts as a potent UVB photosensitizer to cause an atypical mode of cell death in murine skin,”
Proc. Natl. Acad. Sci. U. S. A., 101
(42), 15076
–15081
(2004). http://dx.doi.org/10.1073/pnas.0403994101 PNASA6 0027-8424 Google Scholar
T. Yeet al.,
“Different molecular constituents in pheomelanin are responsible for emission, transient absorption and oxygen photoconsumption,”
Photochem. Photobiol., 84
(2), 437
–443
(2008). http://dx.doi.org/10.1111/j.1751-1097.2007.00281.x PHCBAP 0031-8655 Google Scholar
R. LazovaJ. M. Pawelek,
“Why do melanomas get so dark?,”
Exp. Dermatol., 18
(11), 934
–938
(2009). http://dx.doi.org/10.1111/exd.2009.18.issue-11 EXDEEY 0906-6705 Google Scholar
R. MarchesiniA. BonoM. Carrara,
“In vivo characterization of melanin in melanocytic lesions: spectroscopic study on 1671 pigmented skin lesions,”
J. Biomed. Opt., 14
(1), 014027
(2009). http://dx.doi.org/10.1117/1.3080140 JBOPFO 1083-3668 Google Scholar
T. E. Matthewset al.,
“Pump–probe imaging differentiates melanoma from melanocytic nevi,”
Sci. Transl. Med., 3
(71), 71ra15
(2011). http://dx.doi.org/10.1126/scitranslmed.3001604 STMCBQ 1946-6234 Google Scholar
J. D. SimonD. N. Peles,
“The red and the black,”
Acc. Chem. Res., 43
(11), 1452
–1460
(2010). http://dx.doi.org/10.1021/ar100079y ACHRE4 0001-4842 Google Scholar
M. d’Ischiaet al.,
“Melanins and melanogenesis: methods, standards, protocols,”
Pigm. Cell Melanoma Res., 26
(5), 616
–633
(2013). http://dx.doi.org/10.1111/pcmr.12121 1755-1471 Google Scholar
A. Napolitanoet al.,
“Pheomelanin-induced oxidative stress: bright and dark chemistry bridging red hair phenotype and melanoma,”
Pigm. Cell Melanoma Res., 27
(5), 721
–733
(2014). http://dx.doi.org/10.1111/pcmr.12262 1755-1471 Google Scholar
J.-P. Ortonne,
“Photoprotective properties of skin melanin,”
Br. J. Dermatol., 146 7
–10
(2002). http://dx.doi.org/10.1046/j.1365-2133.146.s61.3.x BJDEAZ 1365-2133 Google Scholar
C. LevyM. KhaledD. E. Fisher,
“MITF: master regulator of melanocyte development and melanoma oncogene,”
Trends Mol. Med., 12
(9), 406
–414
(2006). http://dx.doi.org/10.1016/j.molmed.2006.07.008 TMMRCY 1471-4914 Google Scholar
V. J. Hearing,
“The melanosome: the perfect model for cellular responses to the environment,”
Pigm. Cell Res., 13 23
–34
(2000). http://dx.doi.org/10.1034/j.1600-0749.13.s8.7.x PCREEA 0893-5785 Google Scholar
R. Cuiet al.,
“Central role of p53 in the suntan response and pathologic hyperpigmentation,”
Cell, 128
(5), 853
–864
(2007). http://dx.doi.org/10.1016/j.cell.2006.12.045 CELLB5 0092-8674 Google Scholar
R. BuscàR. Ballotti,
“Cyclic AMP a key messenger in the regulation of skin pigmentation,”
Pigm. Cell Res., 13
(2), 60
–69
(2000). http://dx.doi.org/10.1034/j.1600-0749.2000.130203.x PCREEA 0893-5785 Google Scholar
E. Le Papeet al.,
“Regulation of eumelanin/pheomelanin synthesis and visible pigmentation in melanocytes by ligands of the melanocortin 1 receptor,”
Pigm. Cell Melanoma Res., 21
(4), 477
–486
(2008). http://dx.doi.org/10.1111/pcr.2008.21.issue-4 1755-1471 Google Scholar
K. J. Busamet al.,
“Morphologic features of melanocytes, pigmented keratinocytes, and melanophages by in vivo confocal scanning laser microscopy,”
Mod. Pathol., 14
(9), 862
–868
(2001). http://dx.doi.org/10.1038/modpathol.3880402 MODPEO 0893-3952 Google Scholar
E. SattlerR. KästleJ. Welzel,
“Optical coherence tomography in dermatology,”
J. Biomed. Opt., 18
(6), 061224
(2013). http://dx.doi.org/10.1117/1.JBO.18.6.061224 JBOPFO 1083-3668 Google Scholar
K. KönigI. Riemann,
“High-resolution multiphoton tomography of human skin with subcellular spatial resolution and picosecond time resolution,”
J. Biomed. Opt., 8
(3), 432
–439
(2003). http://dx.doi.org/10.1117/1.1577349 JBOPFO 1083-3668 Google Scholar
A. Ehlerset al.,
“Multiphoton fluorescence lifetime imaging of human hair,”
Microsc. Res. Technol., 70
(2), 154
–161
(2007). http://dx.doi.org/10.1002/(ISSN)1097-0029 MRTEEO 1059-910X Google Scholar
K. König,
“Clinical multiphoton tomography,”
J. Biophotonics, 1
(1), 13
–23
(2008). http://dx.doi.org/10.1002/(ISSN)1864-0648 JBOIBX 1864-063X Google Scholar
E. Dimitrowet al.,
“Sensitivity and specificity of multiphoton laser tomography for in vivo and ex vivo diagnosis of malignant melanoma,”
J. Invest. Dermatol., 129
(7), 1752
–1758
(2009). http://dx.doi.org/10.1038/jid.2008.439 JIDEAE 0022-202X Google Scholar
S. Seidenariet al.,
“multiphoton laser tomography and fluorescence lifetime imaging of melanoma: morphologic features and quantitative data for sensitive and specific non-invasive diagnostics,”
PLoS One, 8
(7), e70682
(2013). http://dx.doi.org/10.1371/journal.pone.0070682 1932-6203 Google Scholar
M. Baluet al.,
“Distinguishing between benign and malignant melanocytic nevi by in vivo multiphoton microscopy,”
Cancer Res., 74
(10), 2688
–2697
(2014). http://dx.doi.org/10.1158/0008-5472.CAN-13-2582 CNREA8 0008-5472 Google Scholar
S.-Y. ChenH.-Y. WuC.-K. Sun,
“In vivo harmonic generation biopsy of human skin,”
J. Biomed. Opt., 14
(6), 060505
(2009). http://dx.doi.org/10.1117/1.3269676 JBOPFO 1083-3668 Google Scholar
H. F. Zhanget al.,
“Functional photoacoustic microscopy for high-resolution and noninvasive in vivo imaging,”
Nat. Biotechnol., 24
(7), 848
–851
(2006). http://dx.doi.org/10.1038/nbt1220 NABIF9 1087-0156 Google Scholar
K. Koenig,
“Hybrid multiphoton multimodal tomography of in vivo human skin,”
IntraVital, 1
(1), 11
–26
(2012). http://dx.doi.org/10.4161/intv.21938 2165-9079 Google Scholar
C. CarreraS. PuigJ. Malvehy,
“In vivo confocal reflectance microscopy in melanoma,”
Dermatol. Ther., 25
(5), 410
–422
(2012). http://dx.doi.org/10.1111/dth.2012.25.issue-5 2193-8210 Google Scholar
J. W. Wilsonet al.,
“Imaging microscopic pigment chemistry in conjunctival melanocytic lesions using pump–probe laser microscopy,”
Invest. Ophthalmol. Vis. Sci., 54
(10), 6867
–6876
(2013). http://dx.doi.org/10.1167/iovs.13-12432 IOVSDA 0146-0404 Google Scholar
T. E. Matthewset al.,
“In vivo and ex vivo epi-mode pump–probe imaging of melanin and microvasculature,”
Biomed. Opt. Express, 2
(6), 1576
–1583
(2011). http://dx.doi.org/10.1364/BOE.2.001576 BOEICL 2156-7085 Google Scholar
J. W. Wilsonet al.,
“In vivo pump–probe microscopy of melanoma and pigmented lesions,”
Proc. SPIE, 8226 822602
(2012). http://dx.doi.org/10.1117/12.908821 PSISDG 0277-786X Google Scholar
I. R. PileticT. E. MatthewsW. S. Warren,
“Probing near-infrared photorelaxation pathways in eumelanins and pheomelanins,”
J. Phys. Chem. A, 114
(43), 11483
–11491
(2010). http://dx.doi.org/10.1021/jp103608d JPCAFH 1089-5639 Google Scholar
K. Satyamoorthyet al.,
“Human xenografts, human skin and skin reconstructs for studies in melanoma development and progression,”
Cancer Metastasis Rev., 18
(3), 401
–405
(1999). http://dx.doi.org/10.1023/A:1006333627271 CMRED4 0167-7659 Google Scholar
Y. Chudnovskyet al.,
“Use of human tissue to assess the oncogenic activity of melanoma-associated mutations,”
Nat. Genet., 37
(7), 745
–749
(2005). http://dx.doi.org/10.1038/ng1586 NGENEC 1061-4036 Google Scholar
D. Dankortet al.,
“Braf(V600E) cooperates with Pten loss to induce metastatic melanoma,”
Nat. Genet., 41
(5), 544
–552
(2009). http://dx.doi.org/10.1038/ng.356 NGENEC 1061-4036 Google Scholar
J. Wanget al.,
“Improvement of in vivo rat skin optical clearing with chemical penetration enhancers,”
Proc. SPIE, 7883 78830Y
(2011). http://dx.doi.org/10.1117/12.874859 PSISDG 0277-786X Google Scholar
M. J. Simpsonet al.,
“Near-infrared excited state dynamics of melanins: the effects of iron content, photo-damage, chemical oxidation, and aggregate size,”
J. Phys. Chem. A, 118
(6), 993
–1003
(2014). http://dx.doi.org/10.1021/jp4107475 JPCAFH 1089-5639 Google Scholar
M. J. Koehleret al.,
“Keratinocyte morphology of human skin evaluated by in vivo multiphoton laser tomography,”
Skin Res. Technol., 17
(4), 479
–486
(2011). http://dx.doi.org/10.1111/srt.2011.17.issue-4 0909-752X Google Scholar
L. MortatiC. DivietoM. P. Sassi,
“CARS and SHG microscopy to follow collagen production in living human corneal fibroblasts and mesenchymal stem cells in fibrin hydrogel 3D cultures,”
J. Raman Spectrosc., 43
(5), 675
–680
(2012). http://dx.doi.org/10.1002/jrs.3171 JRSPAF 0377-0486 Google Scholar
P. Stevenet al.,
“Intravital two-photon microscopy of immune cell dynamics in corneal lymphatic vessels,”
PLoS One, 6
(10), e26253
(2011). http://dx.doi.org/10.1371/journal.pone.0026253 1932-6203 Google Scholar
A. Gergeret al.,
“In vivo confocal laser scanning microscopy in the diagnosis of melanocytic skin tumours,”
Br. J. Dermatol., 160
(3), 475
–481
(2009). http://dx.doi.org/10.1111/bjd.2009.160.issue-3 BJDEAZ 1365-2133 Google Scholar
K. J. BusamA. A. MarghoobA. Halpern,
“Melanoma diagnosis by confocal microscopy: promise and pitfalls,”
J. Invest. Dermatol., 125
(3), vii
–ix
(2005). http://dx.doi.org/10.1111/j.0022-202X.2005.23865.x JIDEAE 0022-202X Google Scholar
X. Hanet al.,
“Near-infrared autofluorescence imaging of cutaneous melanins and human skin in vivo,”
J. Biomed. Opt., 14 024017
(2009). http://dx.doi.org/10.1117/1.3103310 JBOPFO 1083-3668 Google Scholar
Z. Huanget al.,
“Cutaneous melanin exhibiting fluorescence emission under near-infrared light excitation,”
J. Biomed. Opt., 11 034010
(2006). http://dx.doi.org/10.1117/1.2204007 JBOPFO 1083-3668 Google Scholar
P. Kayatzet al.,
“Oxidation causes melanin fluorescence,”
Invest. Ophthalmol. Vis. Sci., 42
(1), 241
–246
(2001). IOVSDA 0146-0404 Google Scholar
F. E. Robleset al.,
“Phasor analysis for nonlinear pump–probe microscopy,”
Opt. Express, 20
(15), 17082
–17092
(2012). http://dx.doi.org/10.1364/OE.20.017082 OPEXFF 1094-4087 Google Scholar
D. Fuet al.,
“Label-free in vivo optical imaging of microvasculature and oxygenation level,”
J. Biomed. Opt., 13
(4), 040503
(2008). http://dx.doi.org/10.1117/1.2968260 JBOPFO 1083-3668 Google Scholar
F. E. RoblesJ. W. WilsonW. S. Warren,
“Quantifying melanin spatial distribution using pump–probe microscopy and a 2-D morphological autocorrelation transformation for melanoma diagnosis,”
J. Biomed. Opt., 18
(12), 120502
(2013). http://dx.doi.org/10.1117/1.JBO.18.12.120502 JBOPFO 1083-3668 Google Scholar
B. G. Saaret al.,
“Video-rate molecular imaging in vivo with stimulated Raman scattering,”
Science, 330
(6009), 1368
–1370
(2010). http://dx.doi.org/10.1126/science.1197236 SCIEAS 0036-8075 Google Scholar
G. I. RedfordR. M. Clegg,
“Polar plot representation for frequency-domain analysis of fluorescence lifetimes,”
J. Fluoresc., 15
(5), 805
–815
(2005). http://dx.doi.org/10.1007/s10895-005-2990-8 JOFLEN 1053-0509 Google Scholar
B. R. Masterset al.,
“Mitigating thermal mechanical damage potential during two-photon dermal imaging,”
J. Biomed. Opt., 9
(6), 1265
–1270
(2004). http://dx.doi.org/10.1117/1.1806135 JBOPFO 1083-3668 Google Scholar
J. KerimoM. RajadhyakshaC. A. DiMarzio,
“Enhanced melanin fluorescence by stepwise three-photon excitation,”
Photochem. Photobiol., 87
(5), 1042
–1049
(2011). http://dx.doi.org/10.1111/php.2011.87.issue-5 PHCBAP 0031-8655 Google Scholar
Z. Laiet al.,
“Stepwise multi-photon activation fluorescence reveals a new method of melanoma imaging for dermatologists,”
Proc. SPIE, 8948 89482D
(2014). http://dx.doi.org/10.1117/12.2038312 PSISDG 0277-786X Google Scholar
K. Königet al.,
“Two-photon excited lifetime imaging of autofluorescence in cells during UVA and NIR photostress,”
J. Microsc., 183
(3), 197
–204
(1996). http://dx.doi.org/10.1046/j.1365-2818.1996.910650.x JMICAR 0022-2720 Google Scholar
A. Vogelet al.,
“Mechanisms of femtosecond laser nanosurgery of cells and tissues,”
Appl. Phys. B, 81
(8), 1015
–1047
(2005). http://dx.doi.org/10.1007/s00340-005-2036-6 APBOEM 0946-2171 Google Scholar
P. TianW. S. Warren,
“Ultrafast measurement of two-photon absorption by loss modulation,”
Opt. Lett., 27
(18), 1634
–1636
(2002). http://dx.doi.org/10.1364/OL.27.001634 OPLEDP 0146-9592 Google Scholar
T. YeD. FuW. S. Warren,
“Nonlinear absorption microscopy,”
Photochem. Photobiol., 85
(3), 631
–645
(2009). http://dx.doi.org/10.1111/php.2009.85.issue-3 PHCBAP 0031-8655 Google Scholar
|


