|
|
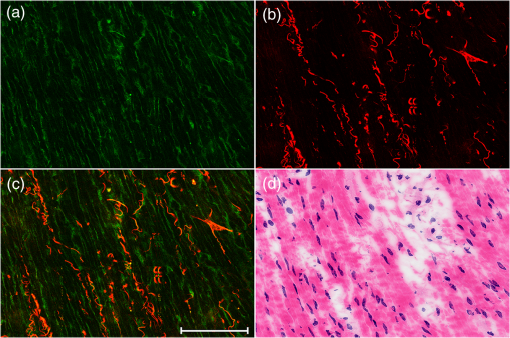
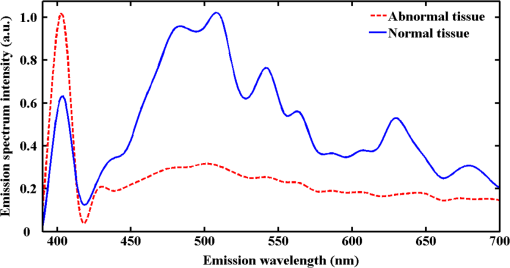
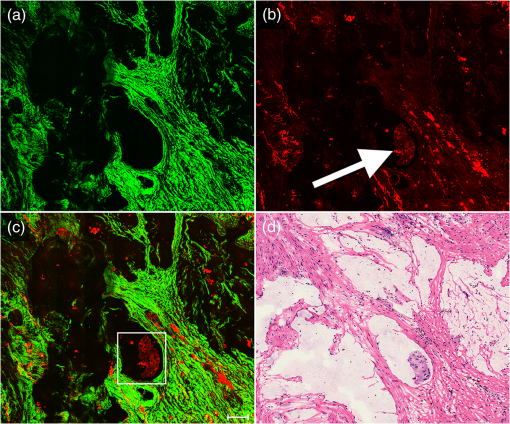
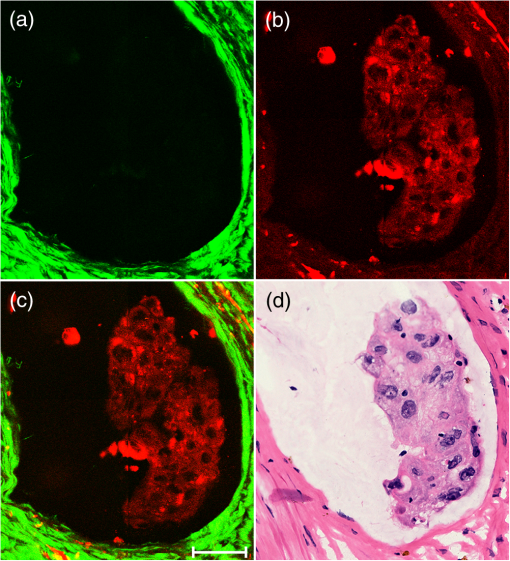
1.IntroductionPreoperative radiochemotherapy is a neoadjuvant treatment that has become the standard of care for locally advanced gastrointestinal tumors and renders initially unresectable patients resectable.1–3 As such, the assessment of the disease therapeutic response and evaluation of residual disease are indispensable. Colloid response is a type of treatment response that is defined by predominant colloid changes with or without residual tumor cells. Colloid response has an important impact on survival and should be taken into account when evaluating histopathological reactions, particularly for the detection of rare residual carcinomatous cells that float in mucin lakes.4–7 However, evaluation of the colloid response by endoscopy, biopsy, ultrasound, and preoperative magnetic resonance (MR) imaging is difficult and small tumor cell clusters may remain undetected, which could lead to incorrect clinical diagnoses.1,4 Multiphoton microscopy (MPM) relies on the nonlinear optical processes, second harmonic generation (SHG) and two-photon excited fluorescence (TPEF), to achieve high resolution imaging of biological tissues and can detect cellular and subcellular tissue microstructures.8–10 This new imaging technique offers several advantages in that results can be acquired in real time without the use of labels while the near-infrared excitation provides superior optical penetration with minimal photodamage. In this study, we used MPM to estimate the colloid response in rectal carcinoma after preoperative radiochemotherapy, with a particular focus on the detection of remaining malignant cells. To the best of our knowledge, no other study describing the use of MPM imaging to examine the colloid response has been conducted. 2.Materials and Methods2.1.Nonlinear Optical Imaging SystemThe nonlinear optical imaging system has been described previously.11,12 In brief, a commercial laser scanning microscopic imaging system (LSM 510 META, Zeiss, Jena, Germany) equipped with a mode-locked femtosecond Ti:sapphire laser (110 fs, 76 MHz) that is tunable from 700 to 980 nm (Coherent Mira 900-F) was used to obtain high-resolution images of the muscularis propria in cancerous human rectum after preoperative radiochemotherapy. A Plan-Apochromat oil immersion objective ( and , Zeiss) was used to focus the excitation beam into tissue samples and also to collect backscattered intrinsic SHG and TPEF signals. The META detector consists of a high-quality reflective grating as a dispersive element and an optimized 32-channel photomultiplier tube array to collect emission signals within the random range from 377 to 716 nm to achieve imaging. An IR beam block filter (Zeiss KP650), which is in front of the META detector, was used to ensure that excitation light is filtered out and only emission signals are recorded. The system has two modes of operation: channel mode and lambda mode. The lambda mode was used to obtain the emission spectrum intensity of regions of interest within the spectral image. To obtain simultaneous high-contrast TPEF/SHG images, TPEF and SHG signals were acquired at 810 nm excitation with in a two-channel mode. One channel corresponded to the wavelength range of 387 to 419 nm for collection of collagen SHG signals (color-coded green), whereas the other channel covered the wavelength range of 430 to 698 nm to show TPEF signals (color-coded red). 2.2.Specimen PreparationSeven patients with rectal adenocarcinoma were recruited to participate in this study, which was approved by the Institutional Review Board of the Affiliated Union Hospital, Fujian Medical University. Prior to study participation, all patients signed an informed consent form. Seven fresh specimens were obtained immediately after proctectomy from patients who had undergone preoperative radiochemotherapy. After removal by surgeons, each specimen was placed in a standard pathologic transport container, covered with ice, and then sent to a pathology laboratory. Every specimen was cut into five thick serial tissue slices. The middle slice was stained with H&E for histological images and the other sections were sandwiched between the microscope slide and a cover slip for multiphoton microscopic imaging. To avoid dehydration or shrinkage during the imaging process, a small amount of phosphate-buffered saline solution was applied to the specimen. Moreover, a total of seven normal samples were obtained for comparison. 2.3.Histology AnalysisMPM images revealed that three patients displayed colloid response to radiochemotherapy and 15 random positions of mucin pools were selected to image. The H&E stained specimen slices were reviewed by a certified pathologist and their images were then obtained using a standard bright field light microscope (Eclipse Ci-L, Nikon Instruments Inc., Japan) with a CCD (Nikon, DS-Fi2, Japan). Finally, results from MPM images were confirmed by comparison with H&E images obtained from light microscopy (). 2.4.Quantification MethodsIn order to quantitatively describe changes of the collagens versus elastic fibers and the redox ratio during the progress of neoadjuvant radiochemotherapy, the SHG-to-TPEF ratio and redox ratio defined as the ratio of nicotinamide adenine dinucleotide (NADH) to flavin adenine dinucleotide (FAD) fluorescence were calculated. They were expressed as the form of a mean value followed by its standard deviation (). In particular, its SD signified the changed degree of SHG-to-TPEF ratio and redox ratio, respectively. 3.ResultsFigure 1 displays representative TPEF/SHG images of normal rectal muscularis propria and corresponding H&E light microscopic images. The major constituents of normal rectal muscularis propria are collagen and elastic fibers. Collagen is visualized distinctively in Fig. 1(a) through its SHG signal (color-coded green), while the elastic fibers are shown in Fig. 1(b) via the TPEF signal (color-coded red). The collagen fibers are bunched and parallel to each other, whereas the elastic fibers have a long rope-like morphology that allows spring-like coil and recoil. Overlaid SHG and TPEF images are shown in Fig. 1(c) and are in agreement with the corresponding H&E image shown in Fig. 1(d). Fig. 1Multiphoton microscopy (MPM) images and corresponding H&E light microscopic images of normal rectal muscularis propria. (a) second harmonic generation (SHG) image (color-coded green); (b) two-photon excited fluorescence (TPEF) image (color-coded red); (c) SHG/TPEF image overlay; and (d) H&E stained image ( magnification). The scale bar represents .  To elucidate the origins of multiphoton signals in fresh samples, the emission spectroscopic investigations on the muscular layer including the normal and abnormal sections were performed. The fresh tissue sections were excited at 810-nm excitation wavelength and the emission signals were collected between 377 and 716 nm using a spectral detector under the Lambda Mode setting. In our results, the normalized spectra of abnormal tissue with and without the colloidal response are consistent, whereas the spectra of the normal and abnormal tissues show obvious differences. There are six distinct peaks at 405, 470, 511, 530, 630 and 690 nm in Fig. 2. According to previous publications, the strong fluorescence peak at 511 nm corresponded to elastin, whereas the fluorescence peaks at 470 and 530 nm were responsible for NADH and FAD respectively, and the 405-nm peak (half of the 810-nm excitation wavelength) originated from collagen.13,14 Additionally, the fluorescence peaks around 630 and 690 nm were attributed to porphyrin derivatives. In comparison with normal muscularis, the SHG signal from the abnormal muscular layer undergoing neoadjuvant therapy is much stronger than the TPEF signal because of fibrosis. Fig. 2Normalized multiphoton emission spectrum of muscular layer, obtained with an excitation wavelength of 810 nm.  Meanwhile, Fig. 3 shows representative SHG/TPEF images of the colloid response after preoperative radiochemotherapy that were obtained by imaging the human rectum with carcinoma cells invading into the muscularis propria and corresponding H&E light microscopic images. Compared with normal muscular tissues, the collagen fibers in cancerous tissues are highly abundant but disordered [Fig. 3(a)], while the elastic fibers are severely disrupted and sparser [Fig. 3(b)]. In order to quantitatively describe the changes in collagens and elastic fibers seen in normal and abnormal rectal muscularis propria, SHG:TPEF intensity ratios, which have been proposed to be a diagnostic indicator for gastrointestinal diseases,15,16 were calculated for normal and abnormal tissue and expressed as a mean value with standard deviation (). Under the lambda mode, the emission intensity from collagens and elastic fibers after background subtraction was simultaneously obtained under the same conditions. The SHG:TPEF ratio in normal tissue was , but in abnormal tissue, it was and there are highly significant differences () between the normal and abnormal tissues according to one-way analysis of variance test (SPSS version 15.0). In a representative high-contrast SHG/TPEF image, the collagen fibers appear yellowish because they simultaneously produce SHG and TPEF signals [Fig. 3(c)]. Fig. 3MPM images and corresponding H&E light microscopic images of colloid response after preoperative radiochemotherapy characterized by large mucin pools with rare residual cancerous cells (white arrow). (a) SHG image (color-coded green); (b) TPEF image (color-coded red); (c) SHG/TPEF image overlay; and (d) H&E stained image ( magnification). The scale bar represents .  Upon cancer cell invasion, muscular tissues can be seriously damaged and the amount of collagen and elastic fibers is severely depleted, while normal cells are replaced with large numbers of abnormal cells.17 After preoperative radiochemotherapy, rectal cancer that responds to this treatment undergoes significant regression, which results in the disappearance of carcinoma cells and replacement of the tumor by fibrous or fibroinflammatory tissue such as collagen fibers.18,19 More importantly, the colloid response or so called mucin lakes that are often seen in postirradiation tumors can be identified in Fig. 3, where large areas of mucin pools appear dark. However, rare residual carcinomatous cells floating in the mucin lakes can be detected (white arrow). These tissue architecture details readily correlate with the H&E stained image [Fig. 3(d)]. The microstructures of these rare residual cancerous cells are shown more clearly in Fig. 4, which represents magnified SHG/TPEF images of the region within the white box seen in Fig. 3(c) and the corresponding H&E image. The carcinomatous cells are present in small clusters and float in mucin pools as evidenced by their TPEF signal, while the mucin lake is dark and does not emit TPEF or SHG signals. These qualitative morphological variations are in excellent agreement with the paired histopathological sections with H&E staining [Fig. 4(d)]. Furthermore, the ratio of NADH to FAD fluorescence, which was previously reported to be a good indicator of the cellular metabolic state,20,21 was calculated for abnormal cells through a similar procedure. Detailed information including the SHG:TPEF intensity ratio and redox ratio was summarized in Table 1, where the abnormal tissue stands for the tissue with and without colloidal response as the colloid does not emit any signals and then does not affect the calculated ratios. In our study, the ratio of NADH to FAD is , which is close to the metabolic state of normal cells .22 This result further reflects that the abnormal cells undergo significant regression after preoperative radiochemotherapy. Fig. 4Magnified MPM images of the region of interest (ROI) shown in Fig. 3(c) (white box) and the corresponding H&E light microscopic image, which provide more detailed structural information for the residual abnormal cells. (a) SHG image (color-coded green); (b) TPEF image (color-coded red); (c) SHG/TPEF image overlay; (d) H&E stained image. The scale bar represents .  Table 1Feature parameters of normal and abnormal tissues.
4.DiscussionDworak et al.1 initially described predominant colloid changes that occur after preoperative radiotherapy. Such changes include the presence of a mucin substance or mucin pools with very sparse residual tumor cells involving the rectal wall. Nevertheless, the ability to detect viable tumor cells in such mucin lakes is critical to determine whether there is remaining viable tumor tissue that could be dispersed within the rectal wall or perirectal tissue. In addition, the difficulty in identifying vital tumor cells in mucin lakes on the resection margin, especially in frozen sections, could lead to unnecessary surgical extensions of the resected area whether or not vital tumor cells are present.1,4 However, remaining viable tumor cells are often rare and exist as either isolated cells or in small clusters, making them difficult to find by conventional microscopic examination or undetectable by conventional preoperative examination techniques such as ERUS, CT, PET, and MRI.23 Biological tissues have many naturally occurring fluorescence sources, including NADH, FAD and cellular structural proteins that can generate TPEF signals, while the nucleus does not emit any signals.13,14 Such signals are obvious against the dark background of cell nuclei and mucin lakes that are surrounded by strong TPEF or SHG signals, which offers the possibility of using MPM to detect the rare residual carcinomatous cells. Furthermore, MPM can provide sequences of optical sections within the scattering specimens, which can be advantageous when combined with endoscopy to realize a real-time microscopic diagnosis that can assist the surgeon in selecting the resection margin. Moreover, the intensity ratio of cellular NADH to FAD fluorescence, the redox ratio, can be used as a diagnostic tool to evaluate mitochondrial energy metabolism. The metabolic state of the cancerous cells is known to be accelerated compared to normal cells so that comparison of redox ratios of normal and abnormal tissues from the same patient can reflect the degree of pathological changes.20–22 Thus, MPM may provide real-time noninvasive optical diagnosis of tumor response to preoperative radiochemotherapy. The impact of colloid response on survival after preoperative radiotherapy for rectal carcinoma was initially evaluated by Rullier et al., who found that patients with colloid response had an exceptional risk of local recurrence that was similar to those with downstaging, but a high risk of distant recurrence was found in patients who had no response.4 Furthermore, the survival after colloid response was higher than for patients showing no response but lower than for those who showed downstaging. These results demonstrate that tumors with colloid response should not be underestimated by the pathologist, regardless of whether vital cancer cells are present or absent in microscopic examinations. Given the advantages provided by MPM, including the capacity to produce real-time, label-free images that can be acquired in the near-infrared range, MPM may represent a valuable tool to assess colloid response, in particular to detect remaining tumor cells after preoperative radiotherapy to treat rectal carcinoma. 5.ConclusionsIn summary, MPM was used to evaluate colloid response after preoperative radiochemotherapy in rectal cancer. MPM was found to be effective for identifying the colloid response and especially for detecting rare residual cancerous cells in mucin lakes. These results suggest that this new nonlinear optical technique has potential, as a noninvasive in vivo imaging tool, to diagnose tumor response after neoadjuvant treatment. AcknowledgmentsThe project was supported by the Program for Changjiang Scholars and Innovative Research Team in University (Grant No. IRT1115), the National Natural Science Foundation of China (Grant No. 81271620), the Natural Science Foundation for Distinguished Young Scholars of Fujian Province (Grant No. 2014J06016), and the Youth Scientific Research Foundation of Fujian Provincial Department of Health (2013-2-36), National Clinical Key Specialty Construction Project (General Surgery). ReferencesO. DworakL. KeilholzA. Hoffmann,
“Pathological features of rectal cancer after preoperative radiochemotherapy,”
Int. J. Colorect. Dis., 12 19
–23
(1997). http://dx.doi.org/10.1007/s003840050072 IJCDE6 1432-1262 Google Scholar
J. M. D. Wheeleret al.,
“Preoperative radiotherapy for rectal cancer: implications for surgeons, pathologists and radiologists,”
Br. J. Surg., 86 1108
–1120
(1999). http://dx.doi.org/10.1046/j.1365-2168.1999.01209.x BJSUAM 0007-1323 Google Scholar
S. ThiesR. Langer,
“Tumor regression grading of gastrointestinal carcinomas after neoadjuvant treatment,”
Front. Oncol., 3 1
–7
(2013). http://dx.doi.org/10.3389/fonc.2013.00262 FRTOA7 0071-9676 Google Scholar
A. Rullieret al.,
“Impact of colloid response on survival after preoperative radiotherapy in locally advanced rectal carcinoma,”
Am. J. Surg. Pathol., 29 602
–606
(2005). http://dx.doi.org/10.1097/01.pas.0000153120.80385.29 AJSPDX 0147-5185 Google Scholar
J. Shiaet al.,
“Patterns of morphologic alteration in residual rectal carcinoma following preoperative chemoradiation and their association with long-term outcome,”
Am. J. Surg. Pathol., 28 215
–223
(2004). http://dx.doi.org/10.1097/00000478-200402000-00009 AJSPDX 0147-5185 Google Scholar
I. D. Nagtegaalet al.,
“Short term preoperative radiotherapy interferes with determination of pathological parameters in rectal cancer,”
J. Pathol., 197 20
–27
(2002). http://dx.doi.org/10.1002/(ISSN)1096-9896 JPTLAS 0022-3417 Google Scholar
M. O’NeilI. Damjanov,
“Histopathology of colorectal cancer after neoadjuvant chemoradiation therapy,”
Open Pathol. J., 3 91
–98
(2009). http://dx.doi.org/10.2174/1874375700903020091 2164-6775 Google Scholar
E. E. HooverJ. A. Squier,
“Advances in multiphoton microscopy technology,”
Nat. Photonics, 7 93
–101
(2013). http://dx.doi.org/10.1038/nphoton.2012.361 1749-4885 Google Scholar
S. M. Zhuoet al.,
“Label-free multiphoton imaging and photoablation of preinvasive cancer cells,”
Appl. Phys. Lett., 100 023703
(2012). http://dx.doi.org/10.1063/1.3676271 APPLAB 0003-6951 Google Scholar
P. J. CampagnolaL. W. Loew,
“Second-harmonic imaging microscopy for visualizing biomolecular arrays in cells, tissues and organisms,”
Nat. Biotechnol., 21 1356
–1360
(2003). http://dx.doi.org/10.1038/nbt894 NABIF9 1087-0156 Google Scholar
S. M. Zhuoet al.,
“Quantitatively linking collagen alteration and epithelial tumor progression by second harmonic generation microscopy,”
Appl. Phys. Lett., 96 213704
(2010). http://dx.doi.org/10.1063/1.3441337 APPLAB 0003-6951 Google Scholar
J. X. Chenet al.,
“Establishing diagnostic features for identifying the mucosa and submucosa of normal and cancerous gastric tissues by multiphoton microscopy,”
Gastrointest. Endosc., 73 802
–807
(2011). http://dx.doi.org/10.1016/j.gie.2010.12.016 GAENBQ 0016-5107 Google Scholar
N. Ramanujam,
“Fluorescence spectroscopy of neoplastic and non-neoplastic tissues,”
Neoplasia, 2 89
–117
(2000). http://dx.doi.org/10.1038/sj.neo.7900077 1522-8002 Google Scholar
M. Monic,
“Cell and tissue autofluorescence research and diagnostic applications,”
Biotechnol. Annu. Rev., 11 227
–256
(2005). http://dx.doi.org/10.1016/S1387-2656(05)11007-2 BAREFD 1387-2656 Google Scholar
B. de C. VidalM. L. S. Mello,
“Optical anisotropy of collagen fibers of rat calcaneal tendons: an approach to spatially resolved supramolecular organization,”
Acta Histochem., 112 53
–61
(2010). http://dx.doi.org/10.1016/j.acthis.2008.07.005 AHISA9 0065-1281 Google Scholar
P. J. Campagnolaet al.,
“High-resolution nonlinear optical imaging of live cells by second harmonic generation,”
Biophys. J., 77 3341
–3349
(1999). http://dx.doi.org/10.1016/S0006-3495(99)77165-1 BIOJAU 0006-3495 Google Scholar
N. R. Liuet al.,
“Detecting the imaging characteristics of colorectal carcinoma invading the muscularis propria with multiphoton microscopy,”
Laser Phys. Lett., 9 155
–159
(2012). http://dx.doi.org/10.1002/lapl.v9.2 1612-2011 Google Scholar
H. Bouzoureneet al.,
“Importance of tumor regression assessment in predicting the outcome in patients with locally advanced rectal carcinoma who are treated with preoperative radiotherapy,”
Cancer, 94 1121
–1130
(2002). http://dx.doi.org/10.1002/(ISSN)1097-0142 60IXAH 0008-543X Google Scholar
C. Rodelet al.,
“Prognostic significance of tumor regression after preoperativechemoradiotherapy for rectal cancer,”
J. Clin. Oncol., 23 8688
–8696
(2005). http://dx.doi.org/10.1200/JCO.2005.02.1329 JCONDN 0732-183X Google Scholar
S. M. Zhuoet al.,
“Depth-cumulated epithelial redox ratio and stromal collagen quantity as quantitative intrinsic indicators for differentiating normal, inflammatory, and dysplastic epithelial tissues,”
Appl. Phys. Lett., 97 173701
(2010). http://dx.doi.org/10.1063/1.3505762 APPLAB 0003-6951 Google Scholar
L. M. Tiedeet al.,
“Determination of hair cell metabolic state in isolated cochlear preparations by two-photon microscopy,”
J. Biomed. Opt., 12 021004
(2007). http://dx.doi.org/10.1117/1.2714777 JBOPFO 1083-3668 Google Scholar
S. M. Zhuoet al.,
“Two-layered multiphoton microscopic imaging of cervical tissue,”
Laser Med. Sci., 24 359
–363
(2009). http://dx.doi.org/10.1007/s10103-008-0570-2 LMSCEZ 1435-604X Google Scholar
E. Mckeownet al.,
“Current approaches and challenges for monitoring treatment response in colon and rectal cancer,”
J. Cancer, 5 31
–43
(2014). http://dx.doi.org/10.7150/jca.7987 JCANDL 0378-2360 Google Scholar
|

