
|
|
1.IntroductionMagnetomotive optical coherence tomography (MM-OCT) is a variant of OCT that utilizes embedded magnetic particles within the sample to enhance imaging contrast and probe the viscoelastic properties of the sample.1,2 These magnetic particles can be engineered to target specific molecules that can enable the generation of molecular specific contrast and aid in the identification of diseased sites or organs in conjunction with MM-OCT.3,4 The goal of MM-OCT imaging is to spatially localize the presence of magnetic particles within a tissue or organ. The underlying principle is based on the displacement of the magnetic particles under the influence of an externally applied magnetic field. The particles move in the direction of the magnetic field gradient and the axial component of this displacement can be detected by OCT with nanometer sensitivity. The resulting signals can be processed to generate contrast and probe the viscoelastic properties of materials and biological specimens.5,6 The availability of fast OCT systems has allowed three-dimensional (3-D) datasets to be routinely acquired, which is especially beneficial for in vivo measurements or in clinical environments where rapid scanning over large tissue volumes can have numerous benefits. However, in techniques such as dynamic optical coherence elastography (OCE)7–9 and MM-OCT,1,10 where dynamic excitation in the form of sinusoidal waveforms are utilized, the acquisition time is limited by the number of modulation cycles within the B-mode image. Acquiring several B-mode images for constructing a 3-D dataset, therefore, results in a prohibitively large acquisition time. For example, in a previous study, 5 min were required to acquire a 3-D elastogram of in vivo human skin.7 This is more problematic in MM-OCT, which typically uses an electromagnetic coil to perturb the magnetic particles within the specimen. The continuous operation of the coil requires several seconds of waiting time (coil turned off to prevent heating of the coil) before acquisition of subsequent frames, which further increases the acquisition time. MM excitation in the form of pulsed waveforms can be used to minimize heat generation in the coil and the sample, and increase the operating range.11 However, leveraging the capability of lock-in detection using a sinusoidal excitation of a known frequency allows for much better noise rejection (hence, higher SNR)12,13 and can also enable more quantitative evaluation based on the phase and amplitude response of the sample under harmonic excitation.14 In this paper, we first discuss the operating factors that determine the MM-OCT data acquisition speed and then demonstrate an order-of-magnitude improvement in the imaging speed for the acquisition of a 3-D MM-OCT dataset using a modified scanning scheme. This is achieved by acquiring a volumetric scan at the maximum camera line-scan rate while applying the magnetic modulation cycles along the slow-scanning axis. Furthermore, we show that this volumetric scan scheme can be combined with other phase modulation techniques, such as full-range OCT, by applying a linear-phase modulation along the orthogonal-scan axis, which allows us to decouple the fast-axis modulation from the slow-axis modulation. 2.Methods2.1.MM-OCT Image Acquisition TimeA number of valid scanning schemes can be used for MM imaging under harmonic excitation. The simplest and the more intuitive scan scheme is taking M-mode measurements (A-lines collected as a function of time) at several spatial locations. However, depending on the number of modulation cycles in each M-mode, this scheme substantially increases the imaging time, results in a large amount of acquired data, and requires continuous sinusoidal modulation, which will heat up the coil. Moreover, the transients arising due to the settling time of the galvanometers limit the speed at which data can be acquired. One alternate scheme utilized in dynamic OCE and MM-OCT, as shown in Fig. 1(a), is performed by modulating the magnetic field along time () with frequency while continuously scanning along the transverse dimension () with a lateral scan velocity () given by , where is the lateral field of view, is the sampling rate, and is the number of A-scans within a cross-sectional image.1 Ideally, the scanning distance of the optical beam during one modulation cycle () should be less than the transverse resolution () of the OCT system, i.e., . In addition, a high degree of spatial oversampling is required to ensure the separation of the structural image from the MM signal, while high temporal sampling ensures sufficient sampling of the modulation frequency and prevents phase-wrapping problems. These requirements impose constraints on the sampling rate , modulation frequency , lateral field of view (), and the imaging time (proportional to the number of modulation cycles ), and can be expressed as , where is the temporal oversampling factor (number of A-lines per modulation cycle given by , for Nyquist criteria) and is defined as the spatial oversampling factor (number of A-scans per transverse resolution element), given by .1 Fig. 1Scanning scheme used in (a) conventional B-mode magnetomotive optical coherence tomography (MM-OCT), where is the number of modulation cycles that are acquired per fast axis frame. Before the acquisition of the next frame, a certain wait time (highlighted in blue) is given for cooling of the coil. During this wait time, a fast-axis frame with the magnetic field off can also be acquired. (b) Volumetric MM-OCT, where a number of fast-axis frames are acquired per modulation cycle, resulting in an order-of-magnitude increase in MM-OCT data acquisition speed. 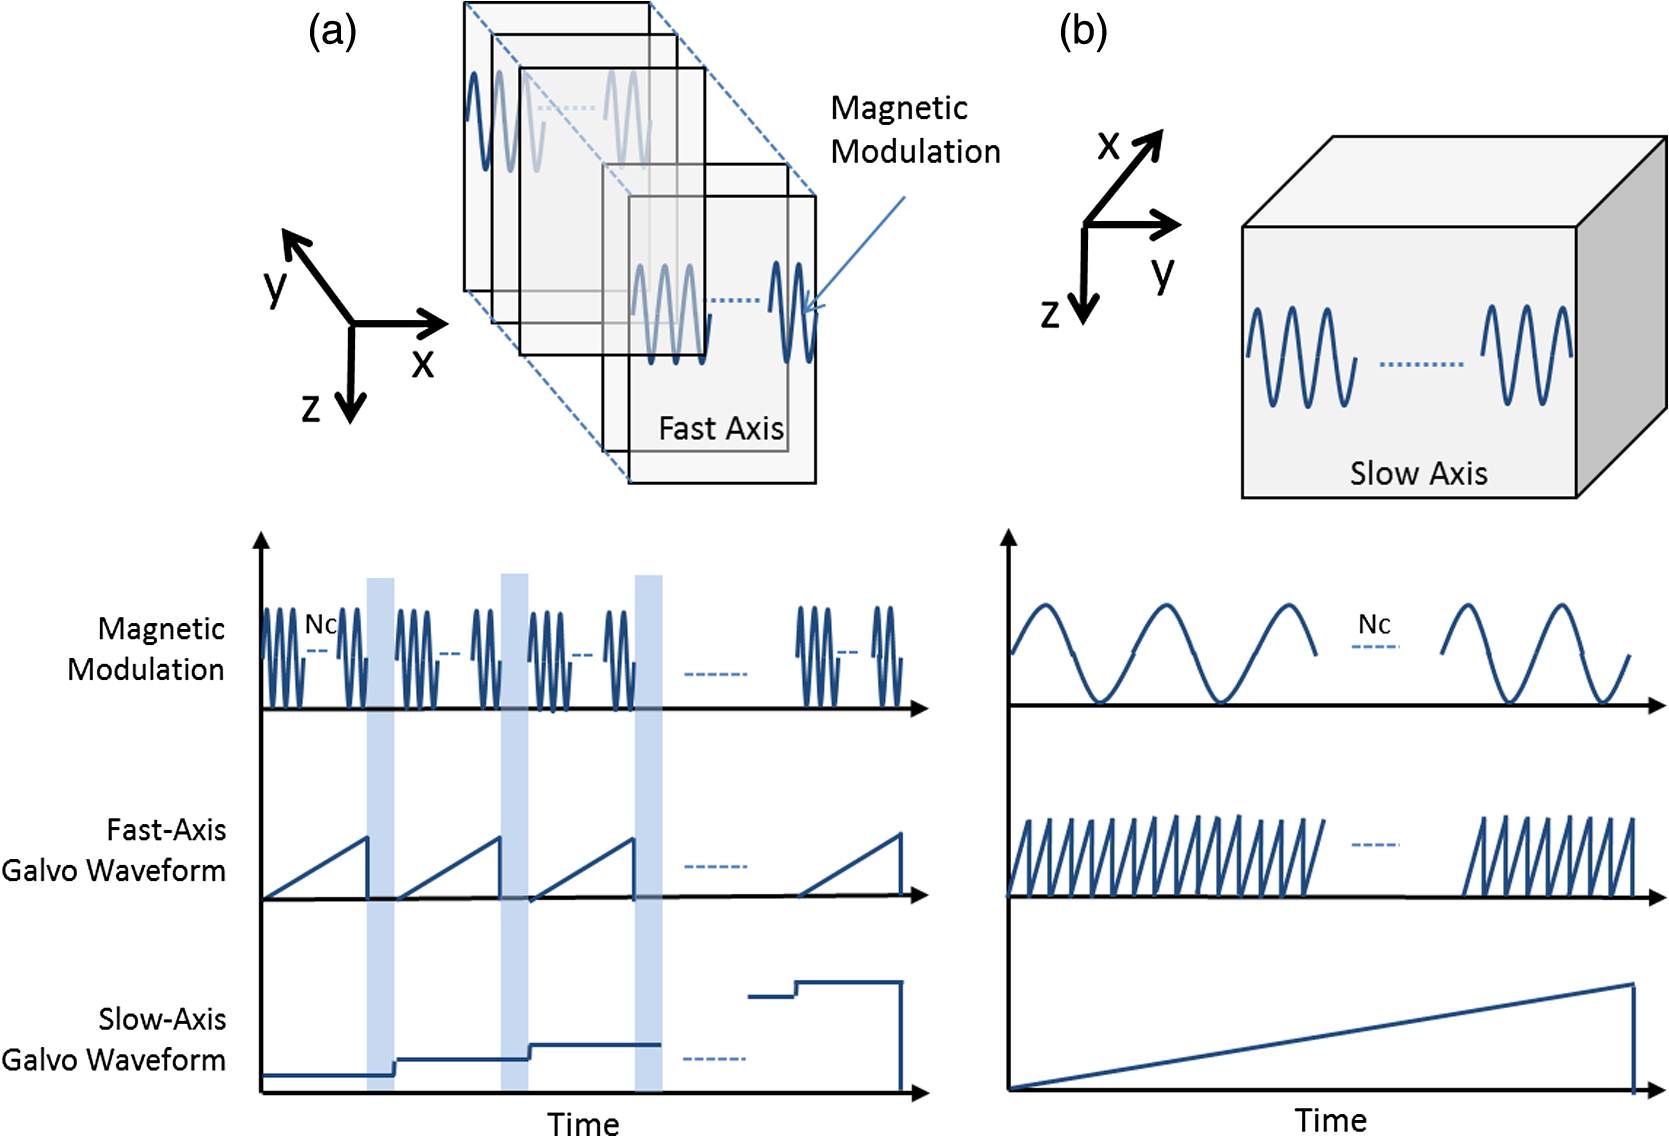 The mechanical properties of the sample and the OCT imaging parameters govern the operating frequency regime and the optimum number of modulation cycles required during MM-OCT imaging. The choice of the modulation frequency is dependent upon the tissue geometry and viscoelastic properties, and it is preferable to operate near the mechanical resonance frequency of the sample to attain the maximum sensitivity of the MM response. Considering the typical physical dimensions of the samples used and the range of elastic moduli ( to 1000 kPa) of biological soft tissues of interest, the samples exhibit mechanical resonances at frequencies .2,5,14 On the other hand, alternating magnetic field of higher frequencies () should be avoided for imaging purposes as they can induce hyperthermia due to heating of the magnetic particles.15 The upper constraint given by prevents the use of high sampling rates [which is equivalent to the line-scan rate in the scheme shown in Fig. 1(a)]. As is generally fixed for a given sample, higher line-scan rates can only be used by either excessive spatial oversampling, reducing the field of view , or decreasing the number of modulation cycles within the imaging time window. For a typical modulation frequency of 100 Hz, , , and , the corresponding line-scan rate has the limits , which is much less than the capabilities of current OCT systems, which can have line-scan rates of up to several hundred thousand A-scans per second.16 A more optimal scanning scheme with substantially reduced imaging time can be devised as shown in Fig. 1(b), which leverages the fast line-scan rates possible by current generation OCT systems. This scan scheme requires the electromagnetic coil to have sufficient magnetic field strength to cover the entire imaged tissue volume. In this scheme, the harmonic modulation is applied along the slow-time axis while a number of fast-axis frames are acquired per modulation cycle, resulting in an order-of-magnitude decrease in MM-OCT data acquisition time. The data processing for the volumetric MM-OCT is very similar to that described previously1 with the main difference being that the phase differences are now computed between successive fast-axis frames rather than successive A-scans. 2.2.Experimental SetupFigure 2 shows the setup for volumetric MM-OCT. A 1310 nm spectral-domain OCT system with a superluminescent diode (LS2000B, Thorlabs) with 170 nm bandwidth was used as the light source. The measured axial and transverse resolutions (full width at half maximum) of the system were 6 and , respectively. A 1024-pixel InGaAs line-scan camera (SU-LDH2, Goodrich) operating at a line-scan rate of 92 kHz was used in the spectrometer with an optical imaging depth of 2.2 mm. The phase noise of the system measured with a static sample placed in the sample arm was milli-radians along the slow axis and milli-radians along the fast axis. A solenoid coil was placed in the sample arm for magnetic modulation. The magnetic field strength generated by the coil was measured to be Gauss at a distance away from the coil. On activation of the coil, the magnetic particles undergo displacements in the direction of the magnetic field gradients and the optical path length changes induced by these small-scale displacements are measured using phase-resolved processing methods. A mirror mounted galvanometer was placed in the reference arm for the full-range modulation while the waveforms shown in Fig. 2(b) were used for driving the system. Fig. 2Spectral-domain full-range volumetric MM-OCT. (a) Experimental setup. The beam is incident on the mirror at an offset from the galvo pivot in the reference arm, providing the phase modulation along the fast axis for full-range imaging. The electromagnetic coil in the sample arm is driven by a sinusoidal signal to provide the magnetic modulation. (b) The driving waveforms for full-range volumetric MM-OCT operation.  2.3.Phantom PreparationIn order to show the merits of the proposed technique, we prepared samples with the magnetic particles present in a localized region within a 3-D field of view imaged using OCT. Tissue-mimicking phantoms were prepared by mixing polydimethylsiloxane (PDMS) fluid with the curing agent RTVA and cross-linker RTVB (with the ratios 100:10:1, PDMS:RTVA:RTVB). Titanium dioxide scattering particles (, ) were added to the mixture to increase the optical scattering and the solution was sonicated for 1 h. A small amount of microspheres () that contained magnetic nanoparticles (, size 50 to 100 nm)4 were then added, and subsequently, the mixture was left in the oven for 8 h at 80°C for curing. 3.Results3.1.Influence of Scanning Parameters on MM-OCT SignalWe first investigated the influence of different scanning parameters on the MM signal under a harmonic excitation waveform. These measurements were performed on a PDMS-based phantom containing a uniform concentration of magnetic nanoparticles (MNPs). In Fig. 3(a), the dependency of the MM response on M-mode data acquired with different temporal oversampling factors () and number of modulation cycles () is shown. The MM signal (dB) values were computed from the mean power spectrum (obtained after averaging the power spectrum along depth) of the acquired M-mode data at a modulation frequency of 100 Hz. The values reported are obtained by subtracting the peak values (in dB) at the modulation frequency from the baseline noise floor in the adjacent frequency bands. As expected, the MM signal improves by increasing while an increase in improves the MM response up to the point where it is sufficiently sampled to prevent any phase-wrapping problems. The choice of should at the minimum satisfy the Nyquist criteria while is desirable for optimal results.13 However, a higher temporal oversampling factor may be needed if the displacements are large to prevent any phase-wrapping problems and for more accurate phase lag estimates. In Fig. 3(b), the effect of scan speed and the number of modulation cycles per transverse resolution element on the MM-OCT signal is shown. B-mode data over a lateral scan range of 1.5 mm were acquired and the number of modulation cycles () within the imaging time window was varied by changing the number of A-scans (over a fixed lateral scan range) while keeping the sampling rate () constant. This will increase both the spatial oversampling factor () and the number of modulation cycles () within the image. As mentioned previously, at least one modulation cycle per resolution element is highly desirable; however, as the plot in Fig. 3(b) suggests, increasing the number of modulation cycles per transverse resolution element increases the MM SNR as averaging over spatial locations having uniform motion can enhance the sensitivity.13 We also note that at higher sampling rates (), the MM-OCT signal level improves, which is possibly due to a reduction in the phase noise of the system at higher scan rates. Fig. 3Effect of the scanning parameters on MM signal levels. (a) MM signal as a function of an increase in the temporal oversampling factor. M-mode measurements were taken at a single spatial location with different number of modulation cycles (). (b) MM signal as the number of modulation cycles per resolution element is increased. B-mode images were acquired with a lateral field of view of 1.5 mm and MM signal values were calculated for each spatial location. The MM signal (dB) values shown correspond to the mean value of the MM signal obtained from each B-mode image.1 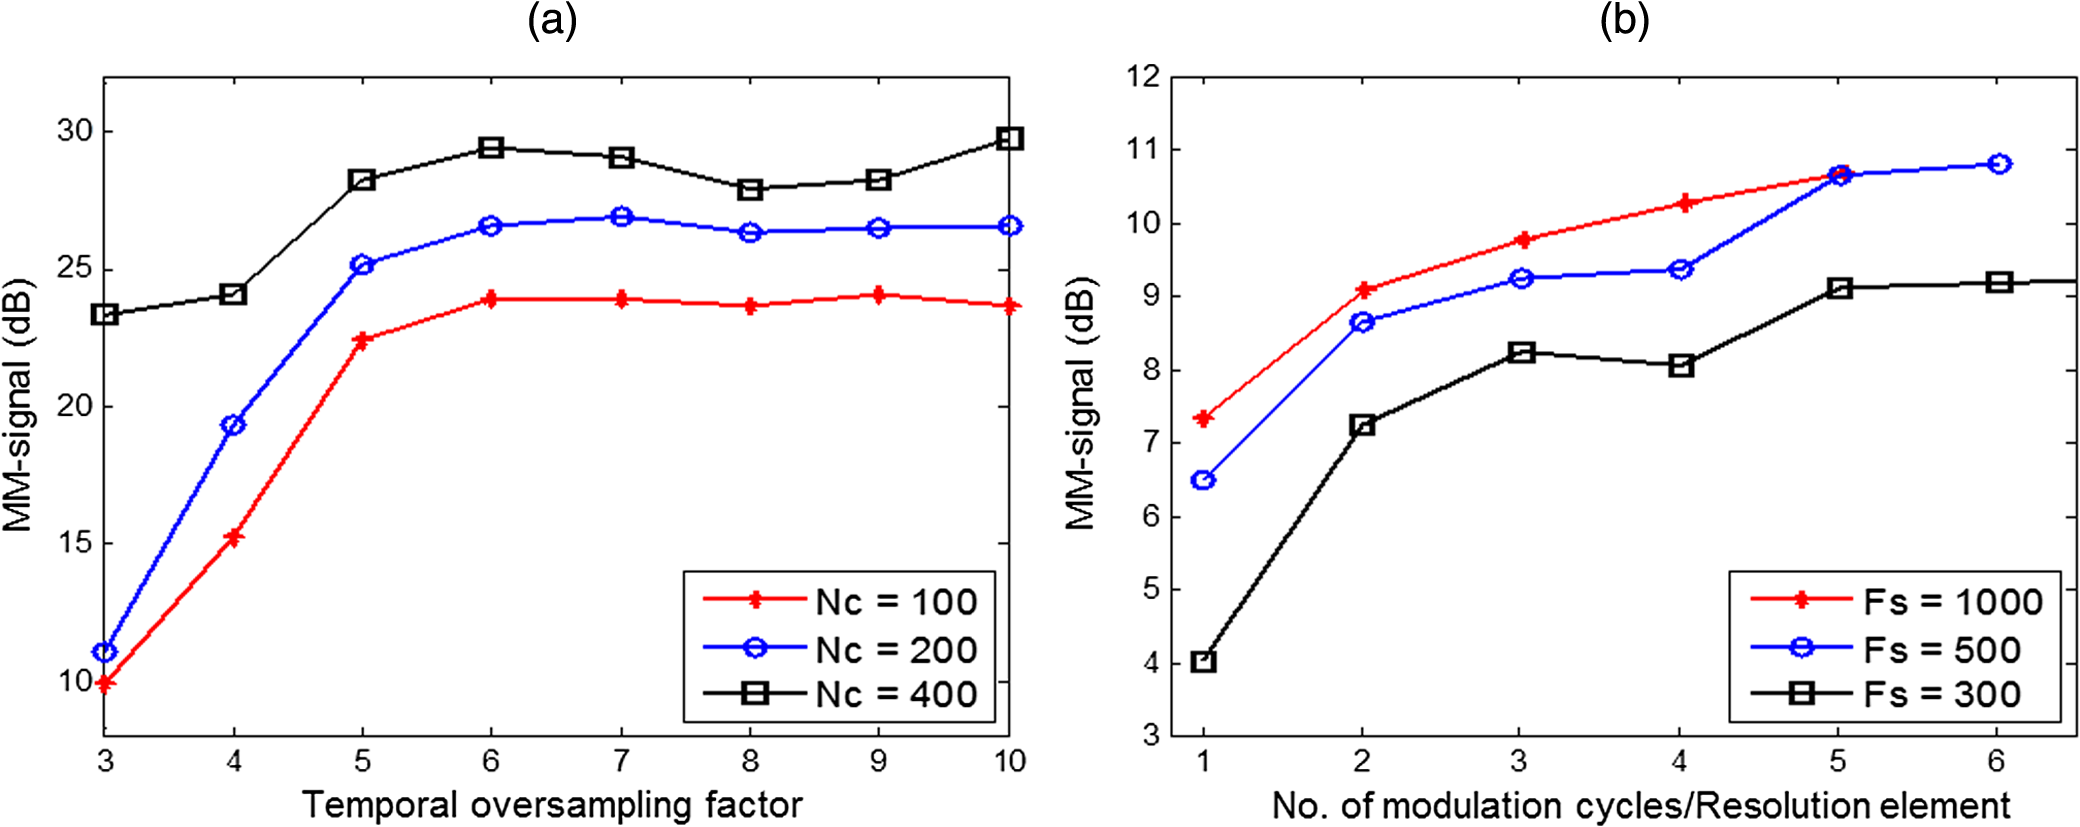 These plots point out an inherent tradeoff between the imaging time and MM sensitivity, as was alluded to in the previous section. The plots suggest that the larger the number of modulation cycles and the higher the temporal and spatial oversampling factors, the greater the MM sensitivity, but at the expense of an increased imaging time. 3.2.Volumetric MM-OCTVolumetric MM-OCT datasets using tissue-mimicking phantoms and human adipose tissue are shown in Fig. 4. These datasets were acquired using a maximum camera line-scan rate of 92 kHz at 300 frames per second (fps) using the modified scan scheme shown in Fig. 1(b). The magnetic modulation frequency of 50 Hz was applied, giving a temporal oversampling factor of 6. The lateral pixel dimensions were 256 and 2048 along the fast and slow axes, respectively, with a total volume acquisition time of , which corresponds to 340 modulation cycles. The same dataset, if acquired with the traditional MM-OCT scan scheme [Fig. 1(a)], would have required (excluding the time it would require for the coil to cool down during imaging). Hence, our results demonstrate a significant reduction ( times) in the acquisition time. Figures 4(a) and 4(b) show volume-rendered datasets of a PDMS-based phantom acquired over a transverse field of view of . Standard OCT processing was performed to obtain the dataset shown in Fig. 4(a), where a corner cut through the volume shows the microsphere inclusion within the sample. The presence of the magnetic microsphere inclusion is clearly revealed after MM-OCT processing in Fig. 4(b), where only the region that corresponds to the presence of microspheres gives a strong MM-OCT signal within the PDMS phantom. The MM-OCT volume in Fig. 4(b) was obtained by further processing the OCT dataset by calculating phase differences between adjacent A-scans along the slow-axis frames and filtering the signal corresponding to the magnetic modulation frequency of 50 Hz. Subsequently, a two-dimensional median filtering operation was done on each frame to remove any residual noise. Fig. 4Volumetric MM-OCT results. (a) Volume rendered OCT processed dataset of a PDMS-based phantom. The lateral dimensions of the volume are , while the optical length along depth is 2.2 mm. (b) Volume rendered MM-OCT processed dataset showing the presence of magnetic microspheres. (c) Volume rendered OCT processed dataset () of human adipose tissue with an embedded tumor mimicking PDMS-based inclusion. (d) Volume rendered MM-OCT dataset with the inclusion giving the MM-OCT signal. 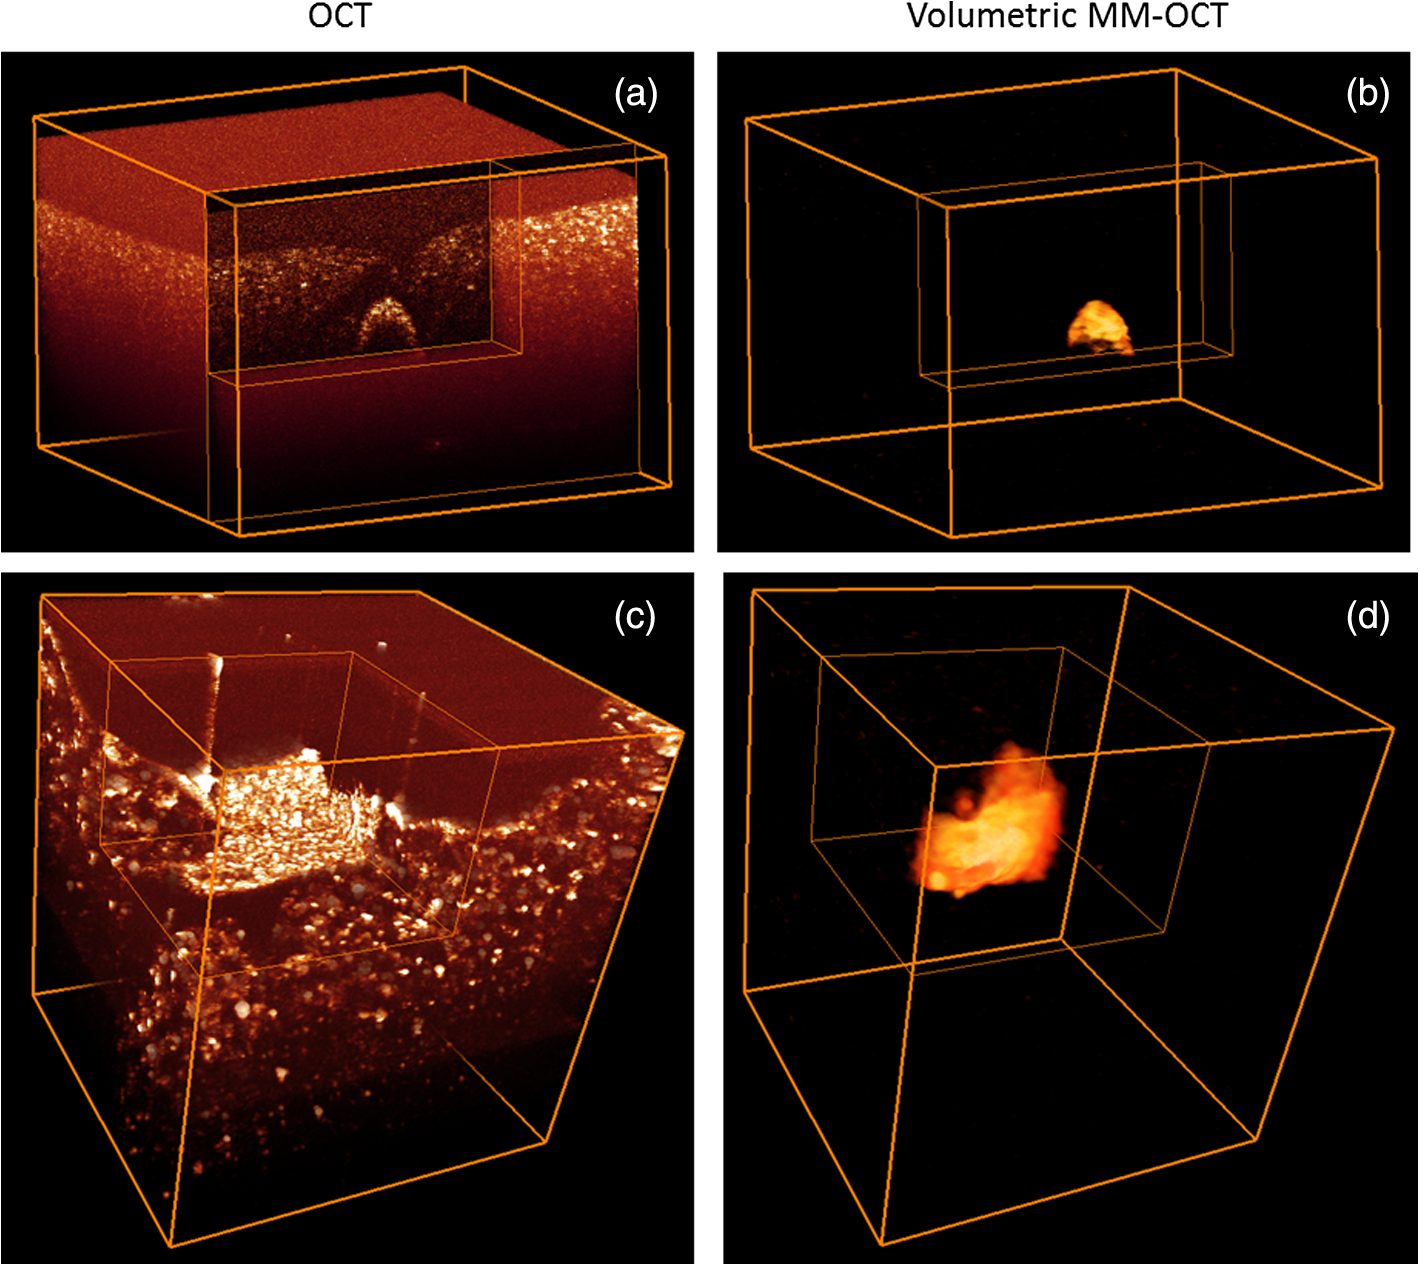 In Figs. 4(c) and 4(d), we show an ex vivo human adipose tissue dataset containing an artificially embedded inclusion mimicking the presence of a tumor within the normal tissue. The inclusion was cut from a PDMS-based phantom containing a relatively high concentration of MNPs () and having a stiffness of . Figure 4(c) shows the OCT processed volume rendered dataset, while Fig. 4(d) shows the MM-OCT processed dataset that clearly shows that only the tumor-mimicking region gives an MM-OCT signal. 3.3.Full-Range Volumetric MM-OCTNext, we combine the volumetric MM-OCT with full-range OCT by modulating a galvanometer-mounted mirror in the reference arm. The full-range OCT operation removes the conjugate image in spectral-domain OCT systems, enabling the utilization of the full imaging depth allowed by the spectrometer. This also allows higher sensitivity by placing the zero optical path length (OPL) inside the sample as the sensitivity degrades away from the zero OPL in spectral-domain OCT due to the finite spectral resolution of the spectrometer. The axial motion of the particles due to magnetic modulation can degrade the full-range reconstruction.17 In our experiments, we applied the sinusoidal modulation along the slow axis for the MM signal and linear-phase modulation along the fast axis for the full-range operation.18,19 Similar utilization of the orthogonal scan axes has been used for combining full-range operation with optical microangiography.20 As only a fraction of the magnetic modulation cycle is completed during each fast-axis frame acquisition, the two modulations do not significantly influence one another. The full-range volumetric MM-OCT data were processed postacquisition and the processing steps are outlined in Fig. 5(a). After background subtraction and resampling of the raw spectrum, the full-range processing steps of the lateral Fourier transform (FFT), band-pass filtering, and inverse FFT are each performed for the fast-axis frames followed by an FFT along wavenumber () for reconstructing full-range OCT.19 Subsequently, the MM processing is applied to all the slow-axis frames as outlined in Fig. 5(a). Figure 5(b) shows the typical spectrum obtained after a lateral FFT is applied along the fast axis (-direction) in full-range processing, while the plot in Fig. 5(c) shows the MM response by taking the FFT of the phase differences of adjacent A-scans along the slow axis. The dashed lines highlight the regions that are band-pass filtered. Fig. 5Full-range volumetric MM-OCT. (a) Processing steps. (b) Lateral Fourier transform of the fast-axis frame showing the shift in frequency due to the linear-phase modulation along the fast axis. The highlighted region corresponds to the filtered region. (c) Lateral Fourier transform of the phase differences along the slow axis showing the peak corresponding to the magnetic modulation frequency. The highlighted region corresponds to the band-pass filter bandwidth. 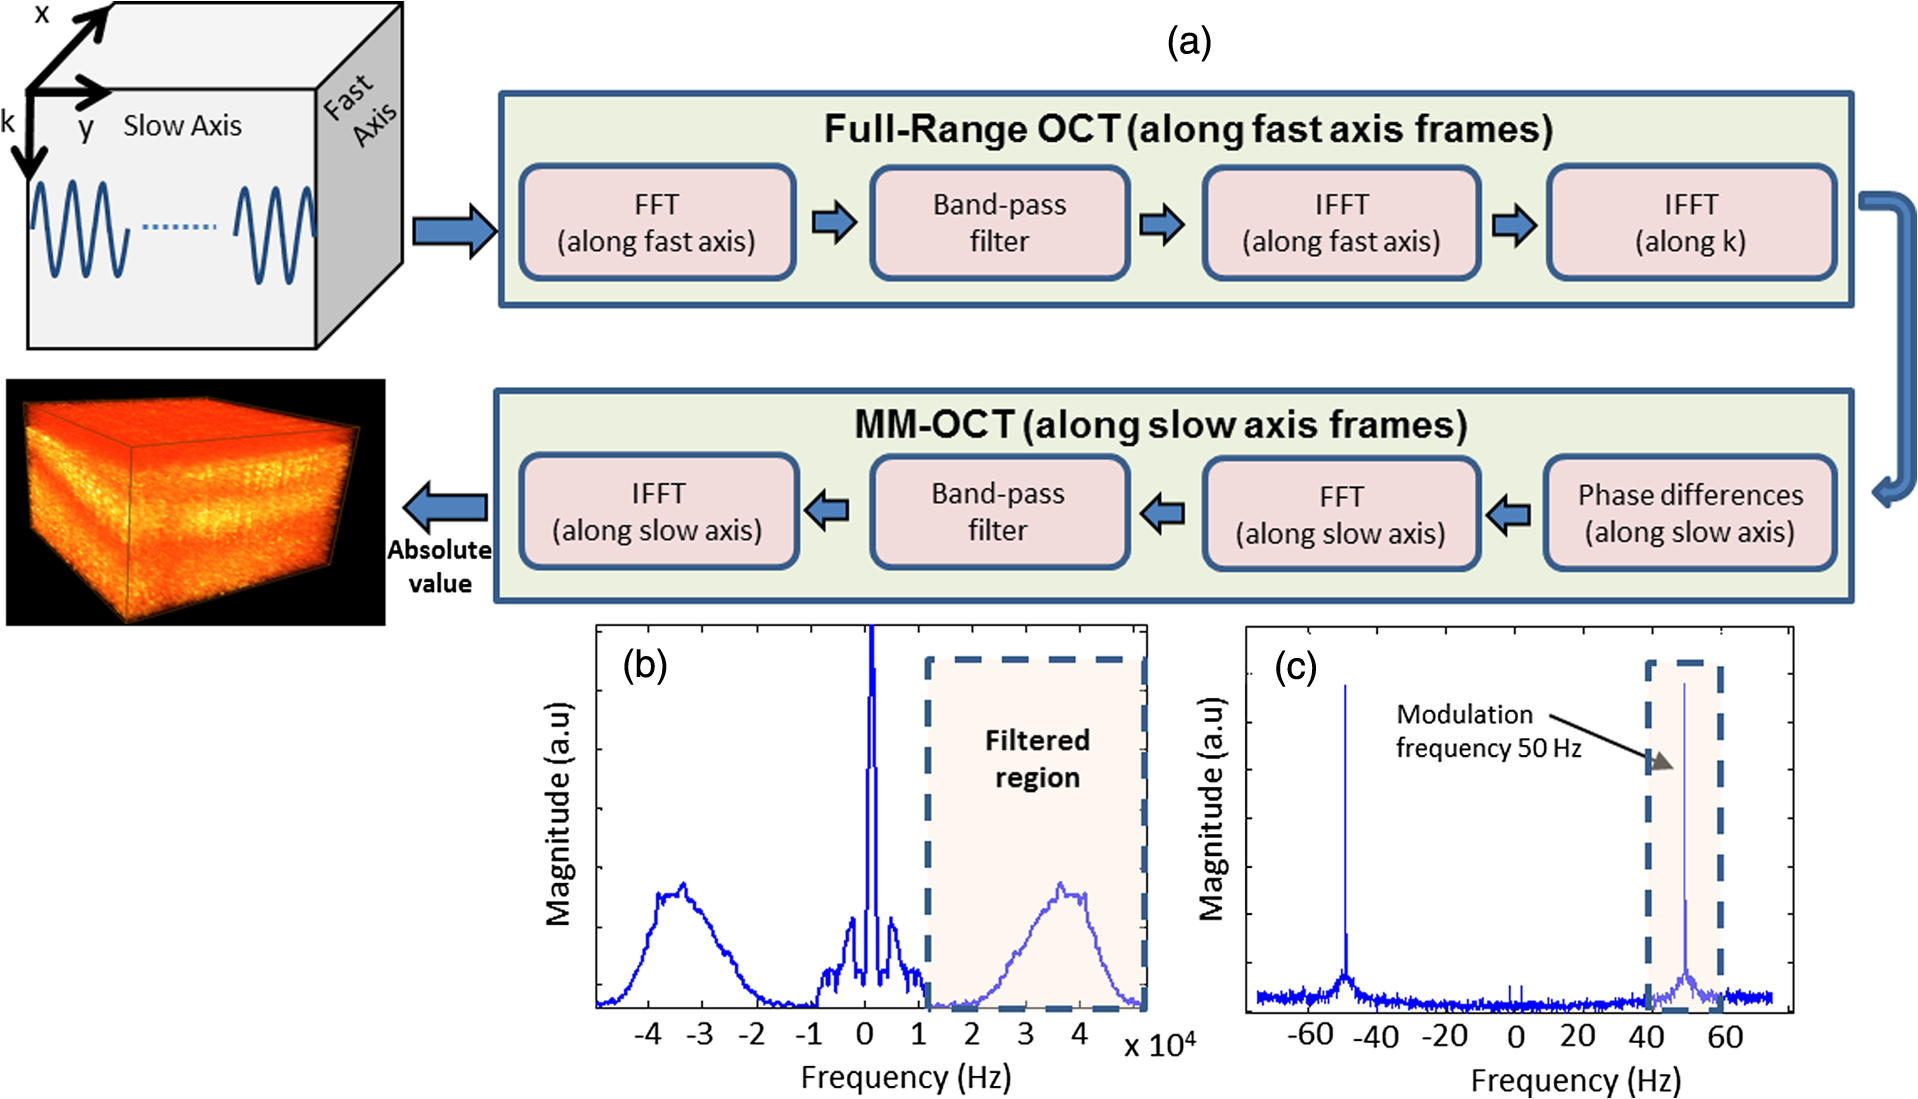 Figure 6 shows the results of volumetric MM-OCT data acquisition combined with the full-range OCT, which enabled us to obtain a total optical imaging depth of 4.4 mm. In Fig. 6(a), a cross-sectional plane of a PDMS phantom containing an inclusion of magnetic microspheres is shown. In spectral-domain OCT systems, the roll-off of the spectrometer decreases the sensitivity away from the zero OPL. Hence, the inclusion containing microspheres can be seen only faintly at an optical distance of beneath the top surface. If the phantom is placed close to zero OPL, the conjugate image overlaps with the original image as shown in Fig. 6(b). After applying the full-range operation, the conjugate image is removed, and the microsphere inclusion can now be clearly seen in Fig. 6(c). The lateral pixel dimensions in this dataset were 512 and 2048 along the fast and slow axes, respectively, over a field of view. This dataset was acquired with an effective frame rate of 150 fps with an acquisition time of . Figure 6(d) shows the full-range volumetric MM-OCT where, as expected, only the magnetic microspheres give a signal. The banding artifact seen in this cross-sectional image is most likely due to aliasing caused by the low temporal sampling. Figure 6(e) shows a volume rendered dataset, which clearly shows the presence of the microsphere inclusions within the OCT volume. Fig. 6Full-range volumetric results of a PDMS-based phantom with magnetic microspheres. (a) Cross-sectional image of a standard OCT scan without the phase modulation for full-range OCT. (b) Cross-sectional image of the data acquired with the phantom placed near the zero optical path length (OPL) without the full-range processing. (c) Full-range processed OCT dataset where the conjugate image has been removed. (d) Full-range processed MM-OCT dataset. (e) Volume rendered full-range MM-OCT dataset. The line artifact that can be seen at zero OPL was cropped for better visualization in the MM-OCT datasets. 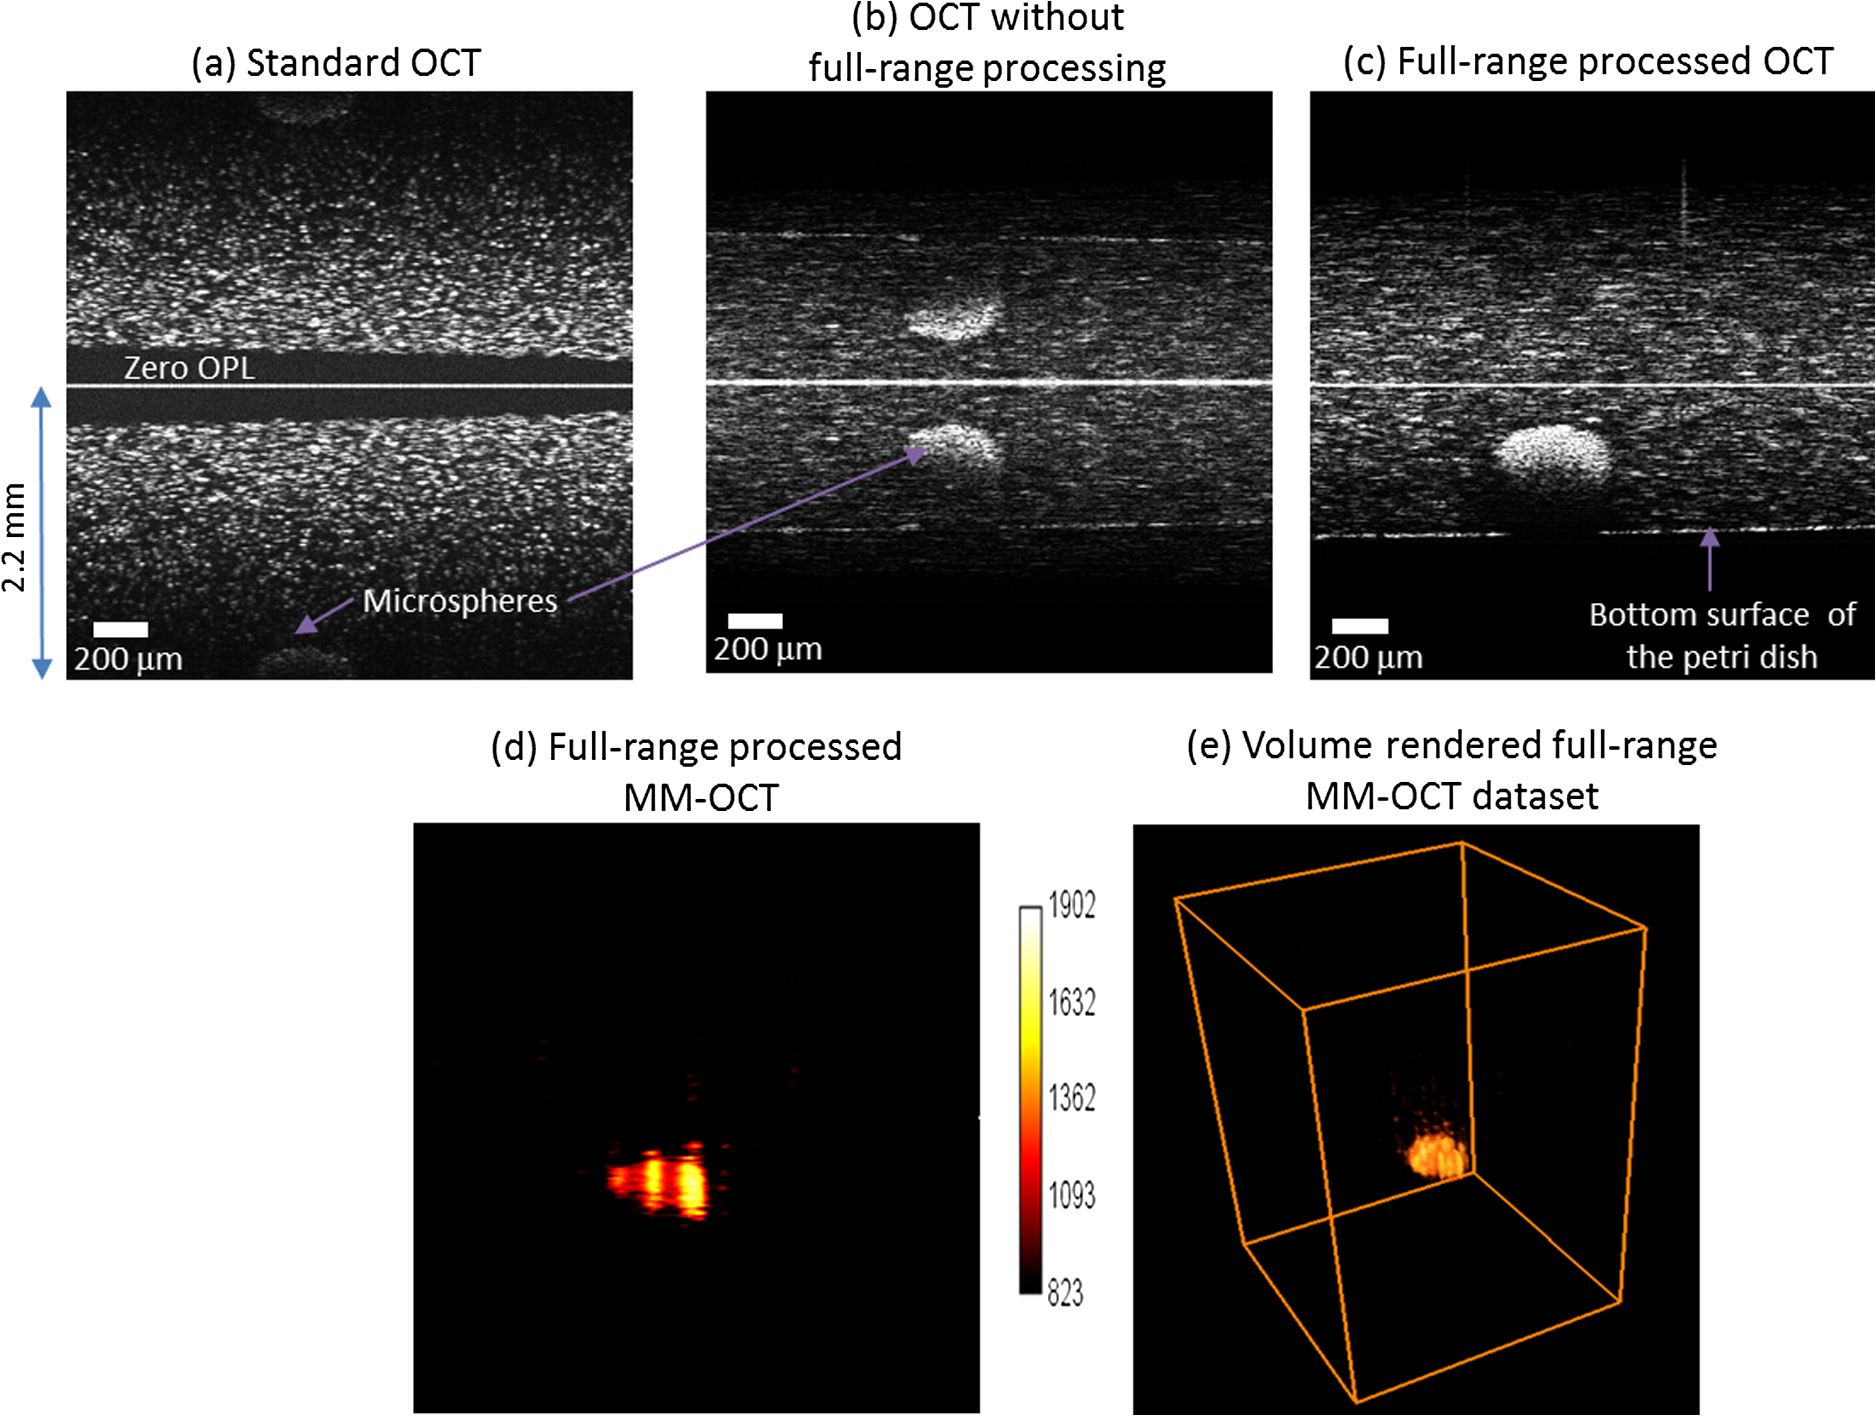 4.Discussion and ConclusionIn this paper, we have demonstrated an order-of-magnitude improvement in the data acquisition speed for volumetric MM-OCT and combined it with full-range OCT, enabling us to obtain measurements over a large imaging depth. This volumetric scan scheme relies on the electromagnetic coil to provide sufficient magnetic field strength over the entire tissue volume scanned with OCT. For better spatial localization, it might be desirable to use a focused magnetic field that can excite tissue regions smaller than the OCT imaging volume. However, designing highly spatially focused magnetic fields with sufficient strength is challenging, especially given the typically small OCT fields of view. In volumetric MM-OCT, the temporal sampling rate along the slow axis is dependent on the frame rate of the system. Hence, a tradeoff exists between spatial sampling along the fast axis and the achievable system frame rate. The relatively low temporal sampling rate would make this technique more susceptible to phase-wrapping problems, limiting the dynamic range of the MM-OCT measurements. However, phase wrapping can be avoided by decreasing the voltage on the coil, increasing the distance between the coil and the sample, or by employing phase-unwrapping algorithms.21 This technique would substantially benefit from higher A-scan rates, which would allow the acquisition of large fields of view with both high spatial and temporal sampling along both the fast and slow axes, which may increase the sensitivity13 and dynamic range of MM measurements. In the full-range dataset, we note some degradation in the image quality, which is due to a number of factors, including fringe washout, band-pass filtering, low spatial oversampling, and the small amount of OPL changes that we were able to induce through the galvanometer-mounted mirror in the reference arm. Many of these problems can be avoided by using higher line-scan rates and better system design. The processing steps for both full-range and MM-OCT are primarily based on the FFTs and band-pass filtering that can be implemented in the graphics processing units for processing and displaying the volumetric MM-OCT in real time. In the future, the MM-OCT volumetric scan scheme can be combined with other phase modulation schemes, such as optical microangiography.22 This volumetric scheme might also be extended to catheter-based MM-OCT configurations, where, due to the pullback and fast rotation of the catheter, the standard B-mode MM-OCT scan scheme cannot be easily implemented. Moreover, it can be used in other dynamic excitation methods that use sinusoidal excitation, such as dynamic OCE.7–9 AcknowledgmentsThis research was supported in part by grants from the National Institutes of Health (1 R01 EB009073, 1 R01 EB012479, S.A.B.). Dr. Jongsik Kim was funded by a Carle Foundation Hospital-Beckman Institute fellowship. The ex vivo human breast tissue imaged in this study was acquired under the institutional review board protocols approved by the University of Illinois at Urbana–Champaign and Carle Foundation Hospital. We thank Eric Chaney for his assistance with managing these IRB protocols. We also thank Darold Spillman for providing operations and information technology support. Additional information can be found at http://biophotonics.illinois.edu. ReferencesA. L. Oldenburget al.,
“Phase-resolved magnetomotive OCT for imaging nanomolar concentrations of magnetic nanoparticles in tissues,”
Opt. Express, 16
(15), 11525
–11539
(2008). http://dx.doi.org/10.1364/OE.16.011525 OPEXFF 1094-4087 Google Scholar
V. Creceaet al.,
“Magnetomotive nanoparticle transducers for optical rheology of viscoelastic materials,”
Opt. Express, 17
(25), 23114
–23122
(2009). http://dx.doi.org/10.1364/OE.17.023114 OPEXFF 1094-4087 Google Scholar
R. Johnet al.,
“ In vivo magnetomotive optical molecular imaging using targeted magnetic nanoprobes,”
Proc. Natl. Acad. Sci. USA, 107
(18), 8085
–8090
(2010). http://dx.doi.org/10.1073/pnas.0913679107 1091-6490 Google Scholar
J. Kimet al.,
“Magnetomotive optical coherence tomography for the assessment of atherosclerotic lesions using αvβ3 integrin-targeted microspheres,”
Mol. Imaging Biol., 16
(1), 36
–43
(2014). http://dx.doi.org/10.1007/s11307-013-0671-6 1536-1632 Google Scholar
V. CreceaA. AhmadS. A. Boppart,
“Magnetomotive optical coherence elastography for microrheology of biological tissues,”
J. Biomed. Opt., 18
(12), 121504
(2013). http://dx.doi.org/10.1117/1.JBO.18.12.121504 JBOPFO 1083-3668 Google Scholar
A. Ahmadet al.,
“Magnetomotive optical coherence elastography using magnetic particles to induce mechanical waves,”
Biomed. Opt. Express, 5
(7), 2349
–2361
(2014). http://dx.doi.org/10.1364/BOE.5.002349 BOEICL 2156-7085 Google Scholar
B. F. Kennedyet al.,
“In vivo three-dimensional optical coherence elastography,”
Opt. Express, 19
(7), 6623
–6634
(2011). http://dx.doi.org/10.1364/OE.19.006623 OPEXFF 1094-4087 Google Scholar
X. Lianget al.,
“Dynamic spectral-domain optical coherence elastography for tissue characterization,”
Opt. Express, 18
(13), 14183
–14190
(2010). http://dx.doi.org/10.1364/OE.18.014183 OPEXFF 1094-4087 Google Scholar
S. G. Adieet al.,
“Spectroscopic optical coherence elastography,”
Opt. Express, 18
(25), 25519
–25534
(2010). http://dx.doi.org/10.1364/OE.18.025519 OPEXFF 1094-4087 Google Scholar
J. Ohet al.,
“Detection of magnetic nanoparticles in tissue using magneto-motive ultrasound,”
Nanotechnology, 17
(16), 4183
–4190
(2006). http://dx.doi.org/10.1088/0957-4484/17/16/031 NNOTER 0957-4484 Google Scholar
J. Kooet al.,
“Pulsed magneto-motive optical coherence tomography for remote cellular imaging,”
Opt. Lett., 37
(17), 3714
–3716
(2012). http://dx.doi.org/10.1364/OL.37.003714 OPLEDP 0146-9592 Google Scholar
R. K. WangA. L. Nuttall,
“Phase-sensitive optical coherence tomography imaging of the tissue motion within the organ of Corti at a subnanometer scale: a preliminary study,”
J. Biomed. Opt., 15
(5), 056005
(2010). http://dx.doi.org/10.1117/1.3486543 JBOPFO 1083-3668 Google Scholar
E. W. ChangJ. B. KoblerS. H. Yun,
“Subnanometer optical coherence tomographic vibrography,”
Opt. Lett., 37
(17), 3678
–3680
(2012). http://dx.doi.org/10.1364/OL.37.003678 OPLEDP 0146-9592 Google Scholar
A. L. OldenburgS. A. Boppart,
“Resonant acoustic spectroscopy of soft tissues using embedded magnetomotive nanotransducers and optical coherence tomography,”
Phys. Med. Biol., 55
(4), 1189
–1201
(2010). http://dx.doi.org/10.1088/0031-9155/55/4/019 PHMBA7 0031-9155 Google Scholar
H. Rudolfet al.,
“Magnetic particle hyperthermia: nanoparticle magnetism and materials development for cancer therapy,”
J. Phys.: Condens. Matter, 18
(38), S2919
(2006). http://dx.doi.org/10.1088/0953-8984/18/38/S26 JCOMEL 0953-8984 Google Scholar
W. Drexleret al.,
“Optical coherence tomography today: speed, contrast, and multimodality,”
J. Biomed. Opt., 19
(7), 071412
(2014). http://dx.doi.org/10.1117/1.JBO.19.7.071412 JBOPFO 1083-3668 Google Scholar
F. Jaillonet al.,
“Parabolic BM-scan technique for full range Doppler spectral domain optical coherence tomography,”
Opt. Express, 18
(2), 1358
–1372
(2010). http://dx.doi.org/10.1364/OE.18.001358 OPEXFF 1094-4087 Google Scholar
R. K. Wang,
“In vivo full range complex Fourier domain optical coherence tomography,”
Appl. Phys. Lett., 90
(5), 054103
(2007). http://dx.doi.org/10.1063/1.2437682 APPLAB 0003-6951 Google Scholar
K. W. Ruikang,
“Fourier domain optical coherence tomography achieves full range complex imaging in vivo by introducing a carrier frequency during scanning,”
Phys. Med. Biol., 52
(19), 5897
(2007). http://dx.doi.org/10.1088/0031-9155/52/19/011 PHMBA7 0031-9155 Google Scholar
L. AnR. K. Wang,
“Full range complex ultrahigh sensitive optical microangiography,”
Opt. Lett., 36
(6), 831
–833
(2011). http://dx.doi.org/10.1364/OL.36.000831 OPLEDP 0146-9592 Google Scholar
H. C. Hendargoet al.,
“Synthetic wavelength based phase unwrapping in spectral domain optical coherence tomography,”
Opt. Express, 17
(7), 5039
–5051
(2009). http://dx.doi.org/10.1364/OE.17.005039 OPEXFF 1094-4087 Google Scholar
R. K. WangL. An,
“Doppler optical micro-angiography for volumetric imaging of vascular perfusion in vivo,”
Opt. Express, 17
(11), 8926
–8940
(2009). http://dx.doi.org/10.1364/OE.17.008926 OPEXFF 1094-4087 Google Scholar
BiographyAdeel Ahmad received his MS and PhD degrees in electrical engineering from the University of Illinois at Urbana-Champaign, USA, in 2010 and 2014, respectively, under the guidance of professor Stephen Boppart. During his graduate research, he worked on using magnetic particles for optical imaging contrast enhancement and elastography applications. Jongsik Kim completed his PhD degree in bioengineering at the University of Pittsburgh in 2009. He was formerly a postdoctoral research associate in the Center for Ultrasound Molecular Imaging and Therapeutics at the University of Pittsburgh Medical Center. He joined the Biophotonics Imaging Laboratory at the University of Illinois at Urbana-Champaign in 2011 where he worked on magnetomotive optical coherence tomography and magnetic hyperthermia applications. Nathan D. Shemonski earned his BS degree in electrical engineering from Washington University in St. Louis, and his BS degree in computer science from Elon University, MS degree in control systems from the University of Illinois at Urbana-Champaign under the guidance of professor Tamer Başar, and his PhD degree in optical biomedical imaging from the University of Illinois at Urbana-Champaign under the guidance of professor Stephen Boppart. He currently works at Carl Zeiss Meditec, Inc. Marina Marjanovic is the associate director of imaging at the University of Illinois at Urbana-Champaign and adjunct associate professor in the Department of Bioengineering. Her fields of interest are cancer biology and imaging. She is working in the areas of animal models for imaging, the development of contrast agents for specific targeting, and their application for preclinical assessment of diseases. Stephen A. Boppart is an Abel Bliss professor of engineering in the Departments of Electrical and Computer Engineering, Bioengineering, and Medicine, and the Head of the Biophotonics Imaging Laboratory, Beckman Institute for Advanced Science and Technology, University of Illinois at Urbana-Champaign. He is also director of the “Imaging at Illinois” initiative. His research interests include developing and translating novel optical biomedical imaging technologies for applications in medicine and surgery. He is a fellow of AAAS, SPIE, IEEE, OSA, and AIMBE. |


