|
|
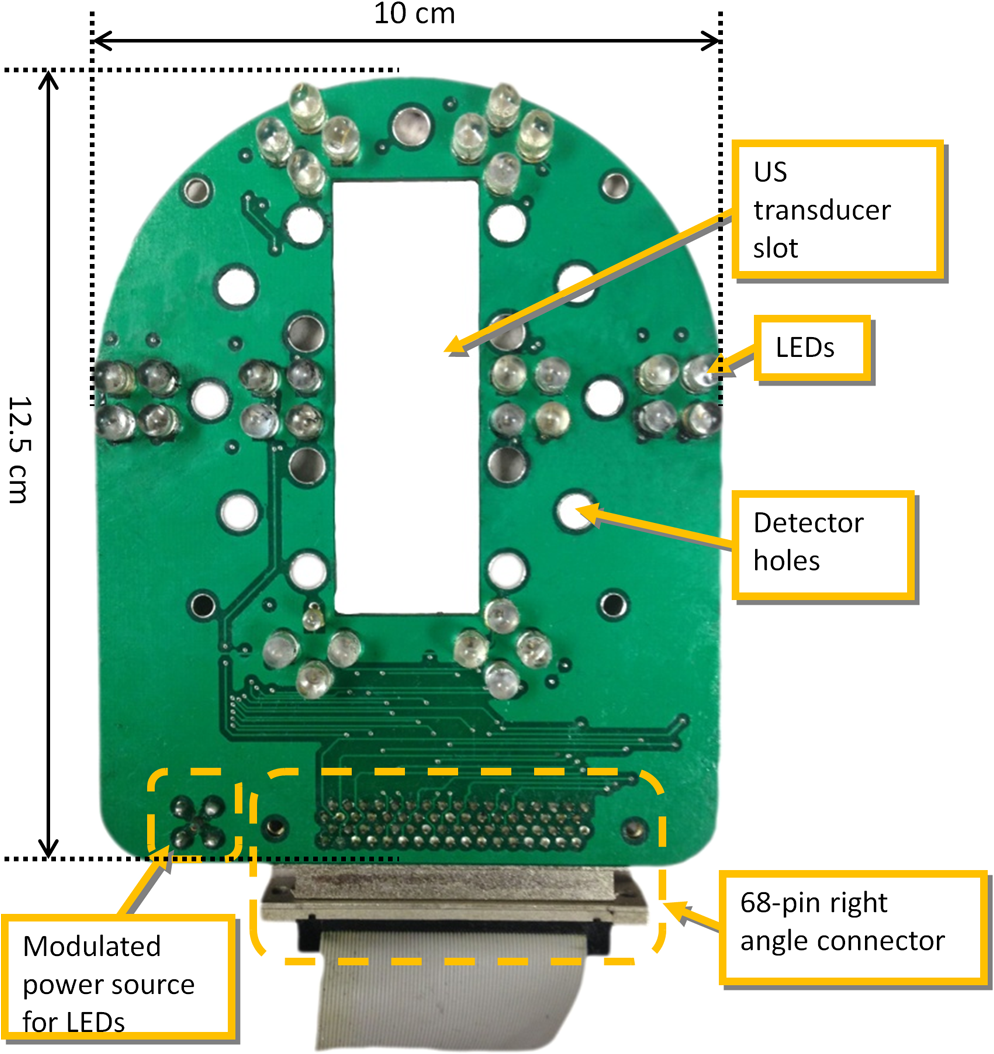
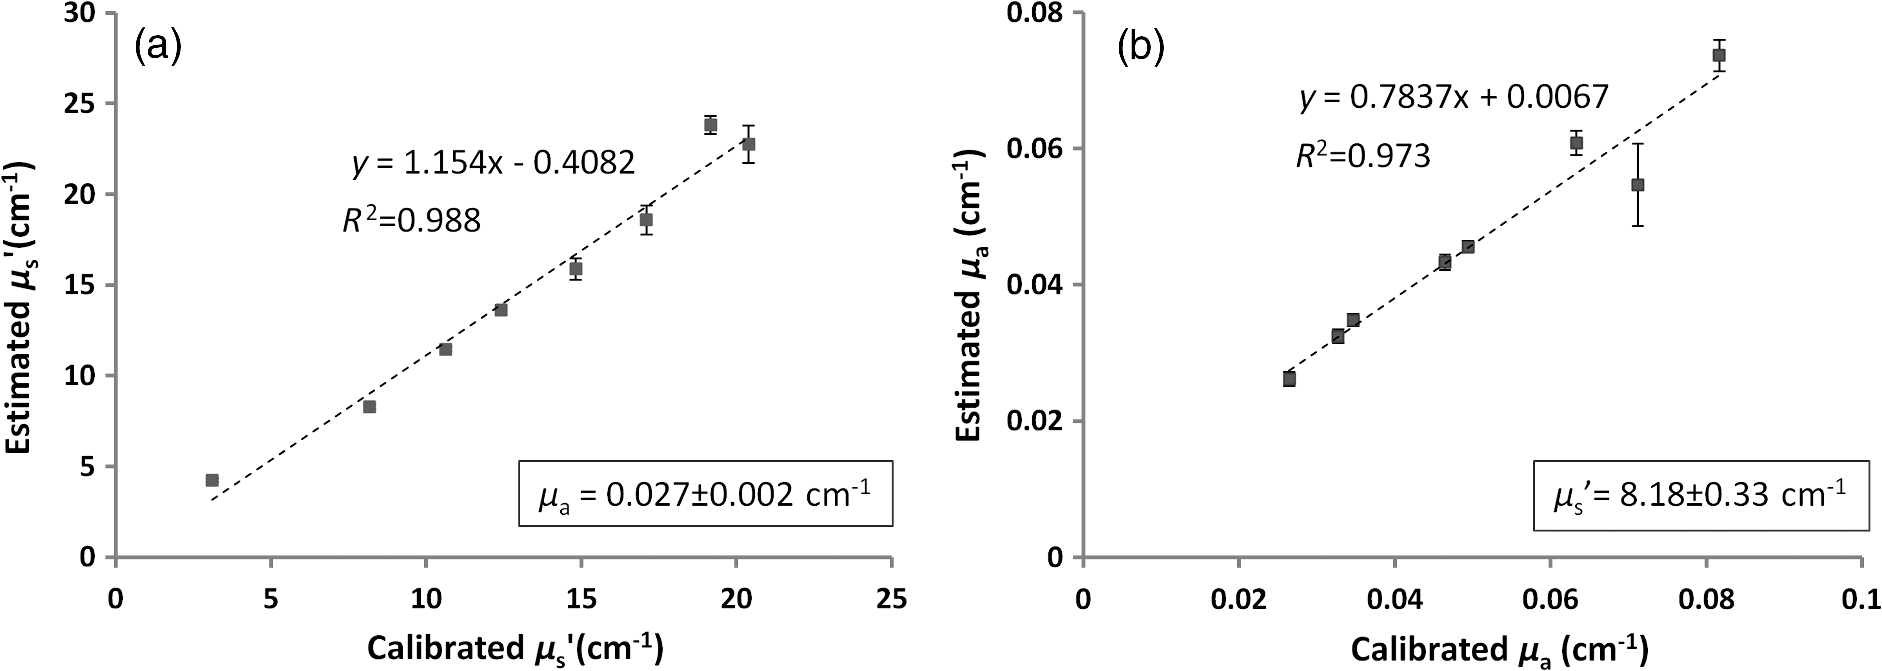
1.IntroductionDiffuse optical tomography (DOT) is a noninvasive imaging technique that provides tissue vasculature and hemoglobin oxygen saturation information in the near-infrared (NIR) spectrum ( to 900 nm). Recent studies have shown that tumor vasculature and oxygen saturation parameters can improve breast cancer detection of the existing modalities and monitor the chemotherapy response of breast cancers.1–11 The DOT systems can be divided into three main categories: continuous-wave (CW), frequency-domain (FD), and time-domain (TD) systems. Among them, the CW system is the simplest in construction and lowest in cost given the same number of sources and detectors.12 Despite its advantages, most of the current DOT CW systems employ laser diodes as light sources, which are fragile and would cost up to a few hundreds of dollars for the required power levels in the wavelength range of 700 to 780 nm.13 With recent advances in photonics, the performance of light-emitting diodes (LEDs) is becoming increasingly comparable in terms of output power and spectral width.14 One of the most appealing strengths of LEDs is the cost, which is several dollars at a similar output power level as that of laser diodes. In addition, LEDs have demonstrated to be safer and more reliable in medical use due to their high resistance to physical lacerations, heat, and electrical damage.15,16 During the last decade, LEDs in the NIR range have been widely used in fluorescence imaging of disease markers as excitation light sources.17–19 Recently, several research groups have made great progress in utilizing LEDs as illuminating light sources in imaging tissue hemoglobin concentrations and oxygenation changes for skin cancer.20–22 These studies indicated that NIR LEDs have the ability to characterize the optical properties of superficial lesions. In 2005, Chance et al. developed a hand-held probe with a three-wavelength LED for a CW NIR spectrometer.23 They have demonstrated that LEDs are capable of characterizing the oxygenated and deoxygenated hemoglobin content. Later, in 2007, Athanasiou et al. demonstrated an optical mammography system for visualizing breast lesions in women presenting nonpalpable BIRADS 4 to 5 imaging findings using a 640-nm LED panel and a charge-coupled device camera.24 This study has shown that the LEDs have the potential to image thicker tissues such as, breast; however, this type of mammographic system does not provide quantitative tumor vasculature and tumor oxygen saturation information, and the system data acquisition is about 70 s for a single sequence. In this paper, we introduce a new low-cost LED-based multiwavelength CW DOT system guided by ultrasound that allows imaging of deeply seated targets. The system design, background tissue calibration, and the target experimental procedures are described in Sec. 2. The imaging results of the LED-based CW system compared with a laser-diode-based frequency-domain system are given in Sec. 3. The summary and discussion are addressed in Sec. 4. 2.Materials and Method2.1.Light-Emitting Diode-Based Diffuse Optical Tomography SystemNIR wavelength LEDs are commercially available with power ranges from 10 to 30 mW, which is sufficient to illuminate deep lesions up to several centimeters.25 Our system uses eight groups of four different LEDs (Roithner Lasertechnik Inc.), centered at 740, 780, 810, and 830 nm with 28 to 35 nm half widths. LEDs are distributed on a hand-held probe based on a certain layout and the geometry as shown in Fig. 1. The hand-held probe consists of a black plate which is used to form the semi-infinite boundary condition and a custom designed printed circuit board (PCB) that controls eight groups of LEDs one at a time using a 32-transistor array. The LEDs were modulated at 20 kHz to avoid ambient light noise. The transistors were controlled by LabView GUI through NI PCI-6602 counter/timers (National Instruments, Texas). The switching interval between different LEDs can be user controlled to within a few tens of milliseconds and the total data acquisition time is about 1 to 2 s. Such a short period is necessary for in vivo studies. Connections between the control PCB and the PC were made using a 68-pin right angle connector with a parallel cable. Ten parallel photomultiplier tube (PMT) detectors were fiber coupled through the holes on the PCB to the black plate to detect diffusely reflected photons from the turbid medium. As shown in Fig. 2, the parallel signals detected by the PMTs were amplified by 10 two-stage broadband 40 dB amplifiers (20 dB amplification for the first stage and 20 dB for the second stage), and bandpass filtered at 20 kHz. The amplified signals were digitized at 200 kHz by an NI PCI-6251 data acquisition card (DAQ) (National Instruments, Texas). The 20-kHz modulation signal was also generated and modified using one analog output of the DAQ card. A commercial ultrasound transducer (UM 4 ultrasound system, Ultramark, Advanced Technology Laboratories, Inc., Bothell, Washington) was located at the center of the probe to provide the lesion depth and structure information. Figure 3 shows a photograph of the compact LED-based CW DOT system. 2.2.Estimation of Background Tissue Optical PropertiesFor the ultrasound guided frequency-domain system, the absorption coefficient and a reduced scattering coefficient of background tissues were obtained from fitting amplitude and phase profiles as a function of source and detector separations.25,26 However, a CW system can only provide an amplitude profile, which makes it difficult to estimate two unknowns from one equation. Liu et al. proposed a simple estimation algorithm to measure the optical properties and blood oxygenation in bulk tissue. The method considered source-detector separations larger than 2 cm and makes an approximation to linearize the relationship between the reflectance and source-detector separation.27 Based on the method, and of an unknown sample can be calculated from the slope and intercept of Eq. (1): where and are the detected diffuse reflectances of a calibrated sample and the unknown sample, respectively; is the source-detector distance (), is the average of chosen minimum and maximum source-detector separation in the measurement; and is the effective optical coefficient and total interaction coefficient of the unknown sample, respectively, while and are for the calibrated sample. For given minimum and maximum source-detector separations with the known optical properties of the calibrated sample, the slope and intercept of Eq. (1) can be only denoted by and of the unknown sample. Therefore, by determining the slope and intercept, the absorption and scattering coefficients can be estimated.Phantom experiments were conducted to evaluate the accuracy of the above estimation method. Two sets of experiments were done with the intralipid solution. In the first set of scattering experiments, we started with a 0.4% intralipid solution and added 40 ml of 20% intralipid each time to gradually increase from 3 to while keeping the same. In principle, adding intralipid to the solution mainly affects the value of the scattering coefficient without changing the absorption coefficient. In the second set of experiments, we started with a 0.8% intralipid solution and kept the same, but gradually increased from 0.02 to by dropping an equal amount of ink for each measurement. and of different ink and intralipid concentrations were estimated by the LED-based CW DOT system, while a laser-diode-based FD DOT system was used to calibrate the solution’s and and the values were noted as calibrated. 2.3.Phantom ImagingThe image reconstruction of the target is modified from a dual-mesh reconstruction method introduced by our group using the ultrasound-guided DOT approach.28 The reconstruction is performed by segmenting target and background regions with fine and course voxel sizes, respectively. The target region is measured from the co-registered ultrasound image. As a result, the scattered field can be determined as where, and are the source and detector locations of the source-detector pair , and and are the center of voxels and in the lesion region (L) and background region (B), respectively. and are the Green functions of the semi-infinite geometry and measurement of the homogenous tissue. Since the CW system does not provide phase information, Eq. (2) can be rewritten into an integral with the real part only asEquation (2) can be written into the following matrix form: where A conjugate gradient algorithm was used to find the spatial distributions. A series of solid phantom experiments were conducted to evaluate the performance of the LED-based CW DOT system in visualizing deeply seated targets. Absorbers of 1 and 3-cm diameter of high (, calibrated at 780 nm) and low contrast (, calibrated at 780 nm) were located in 0.8% intralipid solution at different depths. The fitted backgrounds and ranged from 0.02 to and 7.3 to in different sets of measurements, and were calibrated using the laser-diode-based FD DOT system at a wavelength of 780 nm with a modulation frequency at 140 MHz. Similar sources (9) and detectors (10) were used for comparison. In each set of 1-cm-diameter-sphere experiments, the absorber was centered from a 1.0 to 3.5 cm depth with a step size 0.5 cm. In each set of 3-cm-diameter-sphere experiments, the absorber was centered from a 2.0 to 5.0 cm depth with a step size of 0.5 cm.For each target location, two sets of measurements obtained from LED-based CW and laser-diode-based FD systems were used to reconstruct the absorption maps, respectively. Six sets of repeated measurements were made with each system. For each set of measurements, the maximum of the reconstructed absorption map was obtained and the average maximum of six repeated measurements was used to quantify the target at each location. The absorption maps were generated based on the dual-mesh reconstruction method with the region of interest chosen to be twice the size of the actual target size. Ultrasound images were simultaneously taken to provide the target depth and size information. At last, the 1-cm-diameter and 3-cm-diameter high-contrast absorbers were placed approximately 2.0 and 2.5 cm deep into the pork loin, respectively, to evaluate the LED system’s ability of imaging lesions in an inhomogeneous medium. Calibrated intralipid (, calibrated at 780 nm) and pork loin were used as the known and unknown samples, respectively. The reconstruction method is the same as mentioned above. 3.Results3.1.Background Tissue Optical PropertiesIn the first set of experiments, the intralipid concentration was gradually increased from to , while the was kept the same (). As shown in Fig. 4(a), the estimated (mean values of six repeated measurements) linearly increases with respect to the calibrated and the estimated slope is 1.15. The standard deviation is also shown in the plot. In the second set of experiments, ink was added to the intralipid solution to gradually increase the from 0.02 to while the was kept the same (). As shown in Fig. 4(b), the estimated linearly increases with respect to the calibrated and the estimated slope is 0.8. The error is slightly larger when the is greater than which is at the high end of the average breast tissue . The correlation coefficients () for estimated and calibrated values were 0.988 and 0.973 for scattering and absorption coefficients, respectively. Because the measurements of 740, 810, and 830 nm are similar to the measurements made at 780 nm, the plots are not shown in the paper. The results indicated that, by utilizing this simple algorithm, our LED-based CW DOT system is able to estimate sample optical properties ; and with a high precision. 3.2.Phantom Experiments of 3-cm-Diameter AbsorbersFigure 5 provides the estimated of 3-cm-diameter high- and low-contrast absorbers in comparison with the calibrated at a wavelength of 780 nm. The estimated obtained for each target at each location as well as the standard deviation are displayed in the figures. As shown in Fig. 5(a), the highest of a high-contrast absorber estimated by the LED-CW system is (80.1% of the calibrated ) which is obtained when the target is centered at 3 cm depth; this value is slightly lower than the value obtained from the FD system, (93.6% of the calibrated ), at the same location. The reconstructed values from the LED-CW system are lower than the values from the FD system by an average of (9%) across all depths. This can be explained by the lack of phase information for the LED-CW system. Compared with the FD system, which utilizes both real and imaginary information for imaging reconstruction, the performance of the LED-CW system is reasonable for quantification accuracy. As the target is located deeper, the reconstructed values quickly drop, and they both reach about 50% of the calibrated at target center depths of 4.5 cm. Figure 5(b) displays the estimated values of the 3-cm-diameter low-contrast absorber. It shows that the accuracy of the reconstructed target absorption maps has been improved for both systems across all the depths. They both reach their highest reconstructed values at 3 cm, where the estimated value obtained from the LED-CW system is , while the reconstructed value from the FD system is . Similar to the high contrast big target, the reconstructed values averaged over all of the depths from the LED-CW system are slightly lower than the FD system by 10%, but closer to the calibrated value in this low contrast case. This suggests that our LED-based CW DOT system has a comparable performance for distinguishing larger malignant lesions versus benign lesions at all depths. 3.3.Phantom Experiments of 1-cm-Diameter AbsorbersFigures 6(a) and 6(b) compare the calibrated values with the reconstructed values of 1-cm-diameter absorbers for both high and low contrasts at 780 nm, respectively. Results are averaged over six repeated measurements. The results of the high-contrast absorber [Fig. 6(a)] indicate that both systems reach the highest reconstructed values ( for FD and for LED-CW) at a 2 cm depth and the average of the estimated over all depths from the LED-CW system is only (7%) less than that of the FD system. This demonstrates that the LED-based CW system has a similar performance as compared with the FD system when the target is small and the target center is located from 1 to 3 cm depth. Figure 6(b) shows the reconstructed values of the low-contrast absorber. The curves are quite similar compared to the results of the 3-cm-diameter low-contrast target: reconstructed values averaged over all the depths are higher than the calibrated value by 16.8% for the LED-CW system and 24.5% for the FD system, while the values from the LED-CW system have less variation and are closer to the calibrated value, which again suggests that the LED-based CW system may have better accuracy for imaging low-contrast small absorbers. 3.4.Imaging ExamplesAn example of a co-registered ultrasound image of a 3-cm-diameter tumor-like spherical target located at 3 cm depth is given in Fig. 7(a). Because the ultrasound images of the high-contrast absorber are essentially the same as the images of the low-contrast absorber, these low contrast images are not shown in Fig. 7. The absorption maps of high- and low-contrast absorbers are reconstructed by the FD [Figs. 7(b) and 7(d)] and the LED-CW [Figs. 7(c) and 7(e)] systems at 780 nm, respectively (results of 740, 810, and 830 nm are similar to 780 nm, and are not shown). The absorption map of each target is displayed by 11 slices of from 0.5 to 5.5 cm center depth with a 0.5 cm spacing. The order of the slices is from left to right and from top to bottom. The absorption maps reconstructed by the LED-CW system are similar to the results of the FD system. For a larger target, the reconstructed absorption coefficients are highly dependent on depth; in other words, the absorption coefficients of the top layer of the target are higher than the rest of the layers.29 Therefore, the target is only visible in the top two layers, and is barely visible in the third layer reconstructed from the LED-CW system. An ultrasound image of a 1-cm-diameter tumor-like low-contrast spherical target centered at 2 cm is given in Fig. 8 with absorption maps of high- and low-contrast absorbers reconstructed by the FD [Figs. 8(b) and 8(d)] and the LED-CW [Figs. 8(c) and 8(e)] systems at 780 nm, respectively. The target is only visible in one slice since the target size is 1-cm diameter. While the target image as reconstructed by the LED-CW system is not as sharp as the FD system due to the lack of phase information, the image quality is comparable in terms of target shapes. Fig. 7First column: (a) ultrasound image of a 3-cm-diameter absorber embedded in the intralipid solution centered at 3 cm depth. Second column: absorption maps of 3-cm-diameter high (b) and low (d) contrast absorbers measured by FD DOT system at 3 cm center depth. Third column: absorption maps of 3-cm-diameter high (c) and low (e) contrast absorbers measured by LED-CW DOT system at 3 cm center depth. 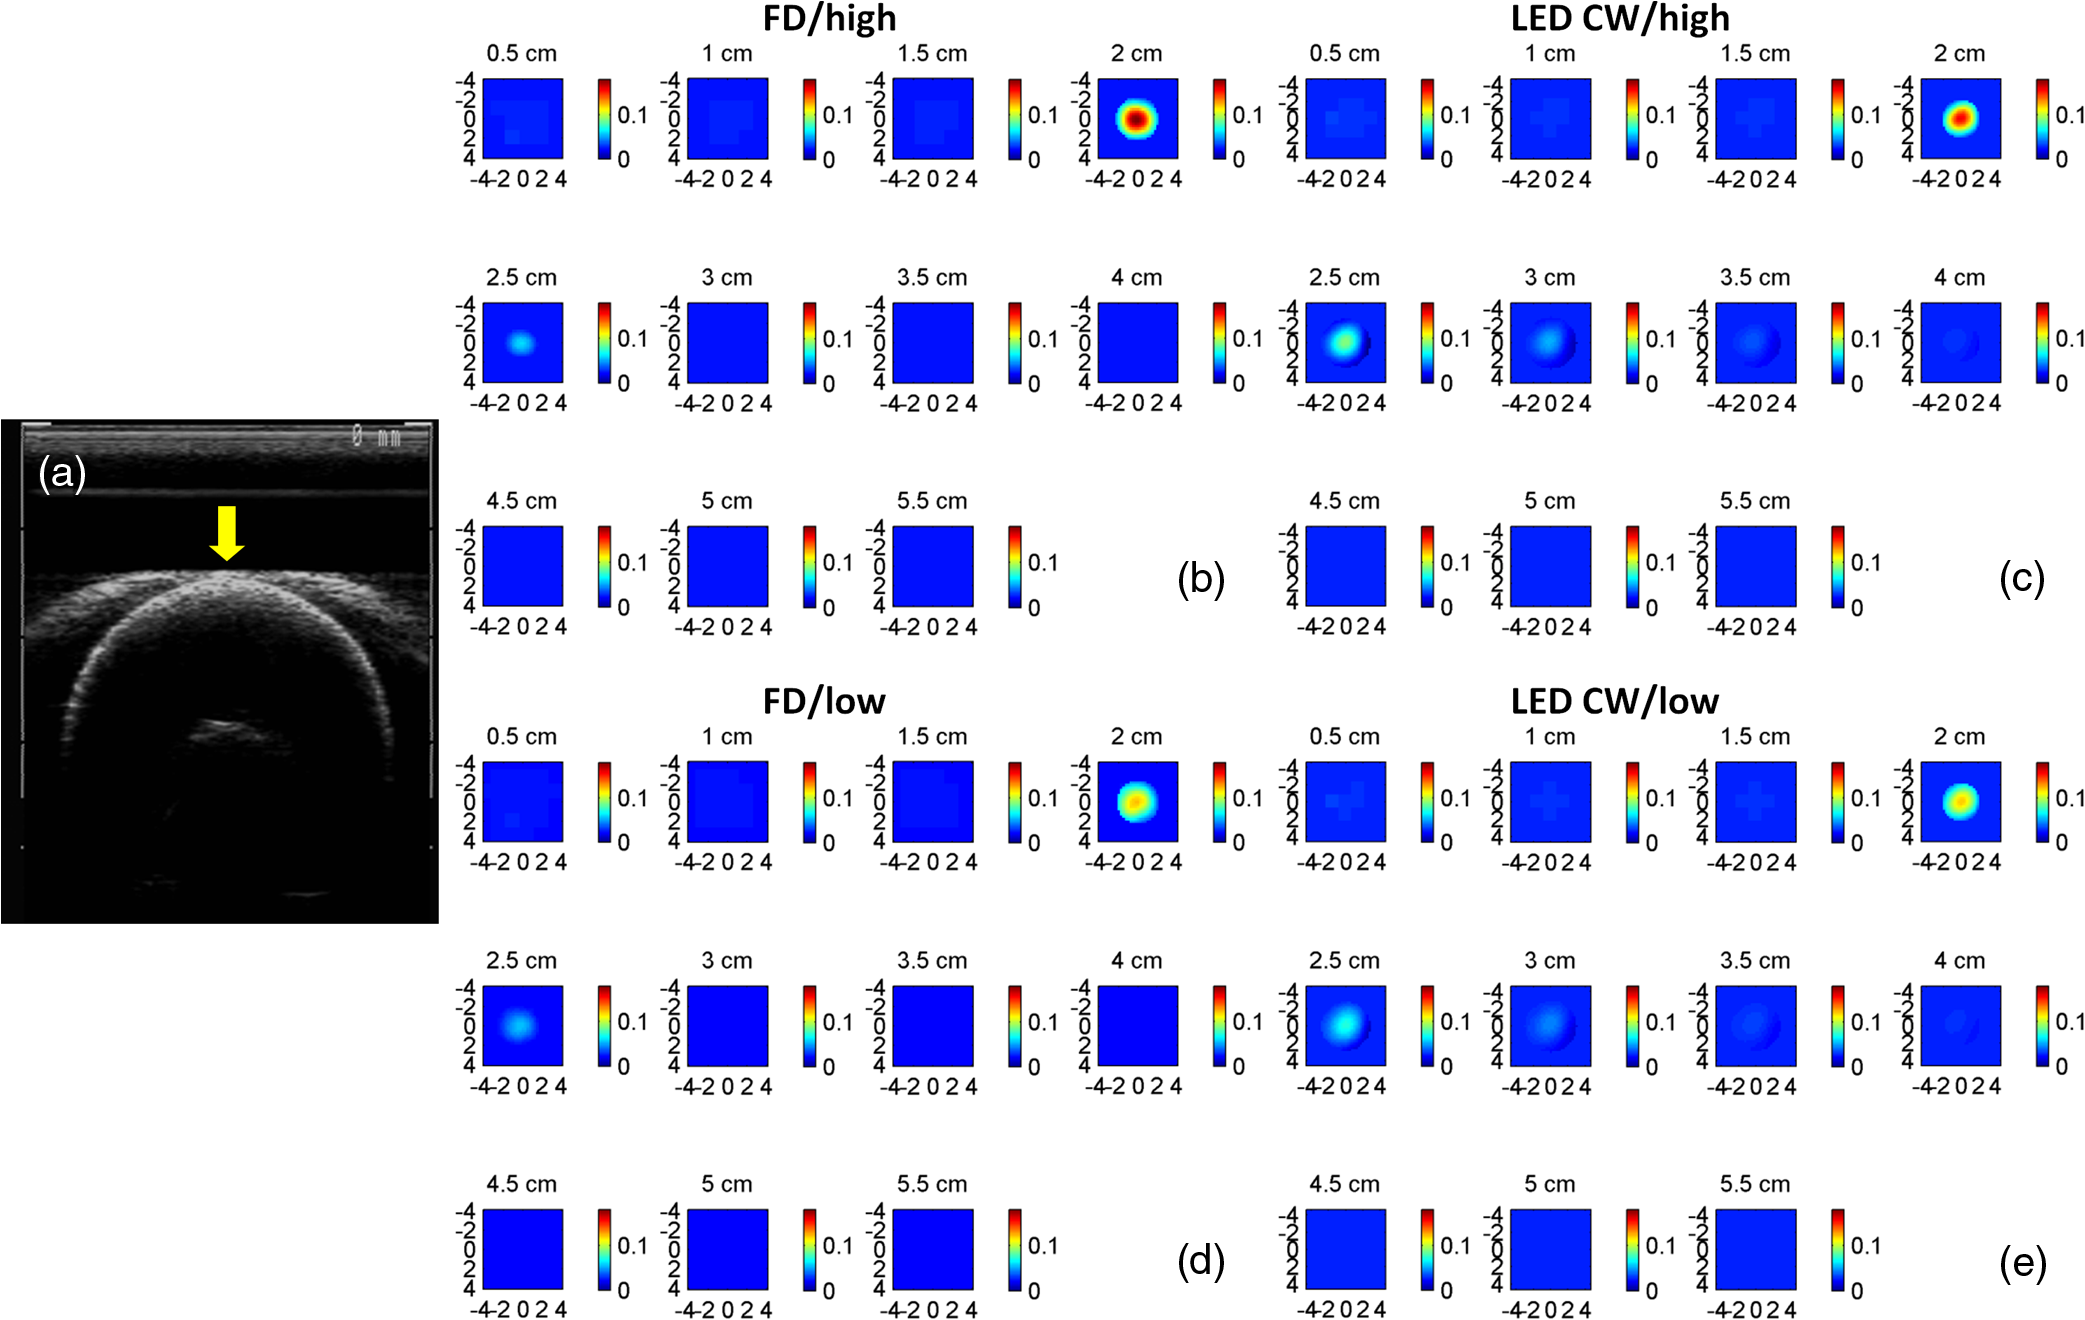 Fig. 8First column: (a) ultrasound image of a 1-cm-diameter absorber embedded in the intralipid solution centered at 2 cm depth. Second column: absorption maps of 1-cm-diameter high (b) and low (d) contrast absorbers measured by FD DOT system at 2 cm center depth. Third column: absorption maps of 1-cm-diameter high (c) and low (e) contrast absorbers measured by LED-CW DOT system at 2 cm center depth. 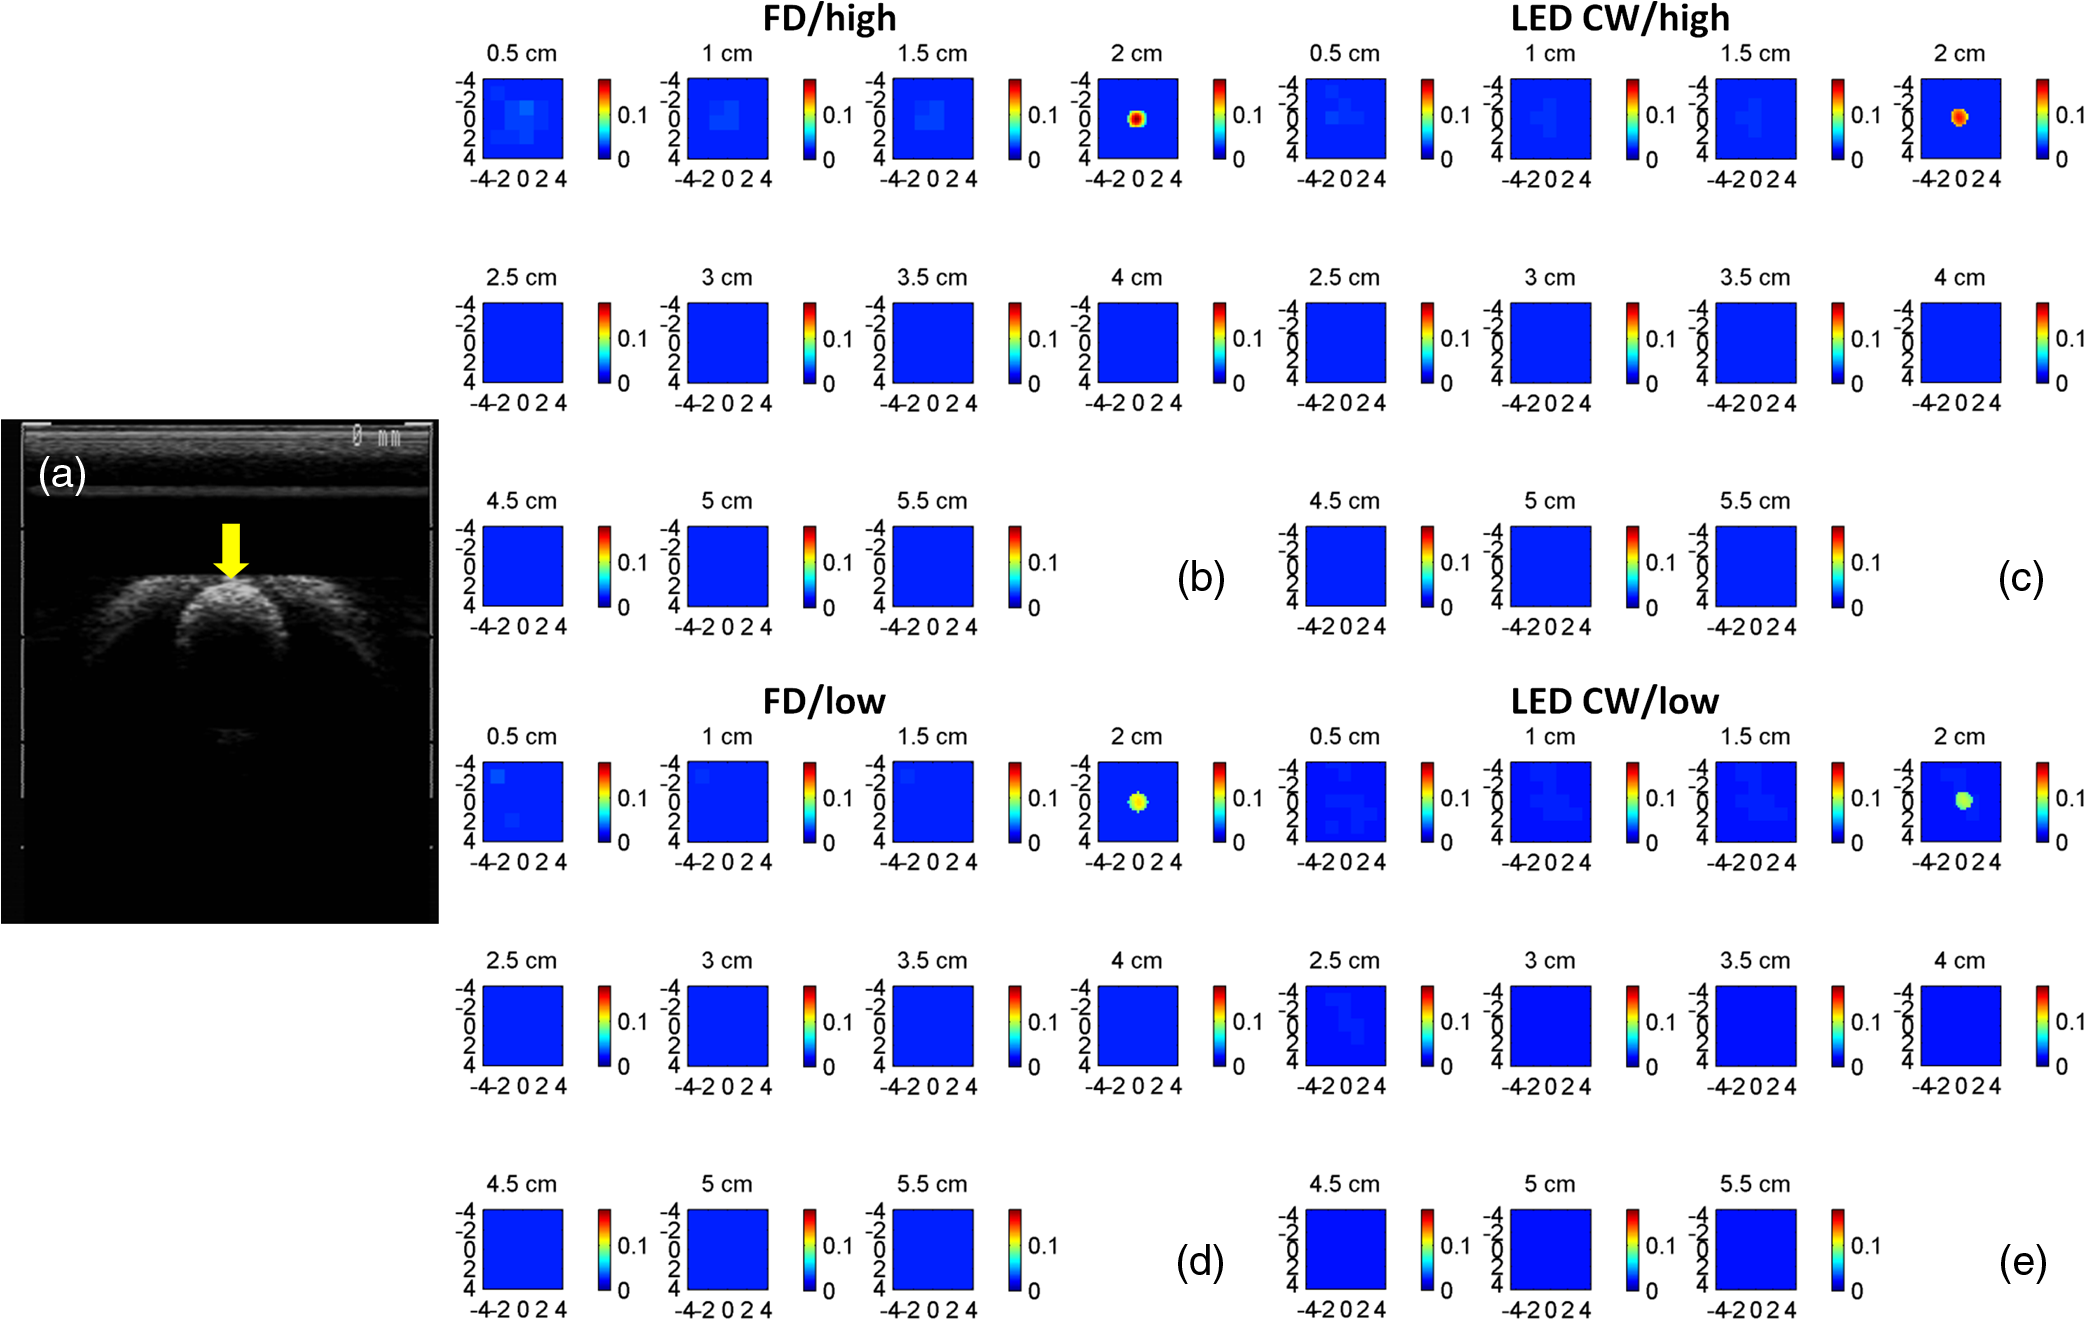 Ultrasound images of the 1-cm-diameter high-contrast absorber located at approximately 2.0 cm depth and the 3-cm-diameter high-contrast absorber located at approximately 2.5 cm depth in pork loin were shown in Figs. 9(a) and 9(b), respectively. The corresponding absorption maps were given in Figs. 9(c) and 9(d). The reconstructed maximum absorption coefficients of 1 and 3 cm targets were (68%) and (77%), respectively. The absorption value of the 1 cm absorber is about 15% lower than that obtained from intralipid at the corresponding depth and the value of the 3 cm absorber is essentially the same as that from intralipid. These examples have demonstrated the potential of the LED-based system to image deeply seated breast lesions. Fig. 9First column: co-registered ultrasound images of (a) 1-cm-diameter high-contrast absorber located at approximately 2 cm depth in pork loin; and (b) 3-cm-diameter high-contrast absorber located at approximately 2.5 cm depth in pork loin. Second column: corresponding reconstructed absorption maps of (c) 1-cm-diameter and (d) 3-cm-diameter high-contrast absorbers obtained from LED-based CW system.  4.Discussion and SummaryIn this paper, we have demonstrated the potential application of an LED-based ultrasound guided tomography system and compared its performance with a laser-diode-based frequency-domain system. We have shown that LEDs in the NIR spectrum have adequate power to image deeply seated targets with good quantification accuracy. For high-contrast absorbers, the absorption coefficient reconstructed from the LED-CW system is about 7% to 9% lower than that obtained from the FD system due to the lack of phase information. However, the reconstruction accuracy for low-contrast absorbers is 10% closer to calibrated values than that obtained from the FD system. Therefore, the contrast ratio of high- and low-contrast absorbers is similar for both systems, which suggests that both systems may have a similar performance in distinguishing malignant from benign lesions. Our current prototype LED-based system is not suitable for clinical studies yet and careful packaging of the probe is needed to protect circuits of LEDs from ultrasound gel and intralipid solution. Additionally, we are looking into different solutions to modify the LEDs’ frequency response to increase the modulation frequency to at least beyond 50 MHz for probing tissue with phase information. The current LEDs can only be modulated up to several MHz. The significant advantage of the LED-based system is the cost as shown in the detailed comparison in Table 1. A typical FD system source used in our clinical studies utilizes four wavelengths of higher power laser diodes and two sets of optical switches to deliver light to nine source positions on the probe. The higher diode power is used to compensate the loss of the optical switches. The cost of the four-wavelength LED source reported in this manuscript is two orders less than that of the FD system. As reported, the significant reduction in cost does not compromise the performance. Additionally, the cost of the PMT-based detection system can be significantly reduced by using avalanched diode detectors or photodetectors provided that the sensitivity is adequate to probe deeply seated breast lesions. Another advantage of the LED-based source system is the easy and robust operation of the LEDs in clinical environments. Table 1Source system cost comparison between a laser-diode-based system and LED-based system.
In summary, we have developed an ultrasound-guided low-cost diffuse optical tomography system using LEDs of four NIR wavelengths, which has proved to be capable of probing deeply seated tumor-like targets located at different depths. Phantom experiments in comparison with a laser-diode-based frequency-domain system have demonstrated that our system is able to reconstruct the absorption coefficient of targets with different sizes and contrasts with high accuracy, and may have the potential to more precisely characterize the optical properties of benign lesions. AcknowledgmentsThis research is partially supported by the National Institutes of Health (NIH), R01EB002136. ReferencesQ. Croninet al.,
“Benign versus malignant breast masses: optical differentiation with US-guided optical imaging reconstruction,”
Radiology, 237239
(12), 57613
–66
(20052005). OPEXFF 1094-4087 Google Scholar
Q. Fanget al.,
“Combined optical and X-ray tomosynthesis breast imaging,”
Radiology, 258
(1), 89
–97
(2011). http://dx.doi.org/10.1148/radiol.10082176 PSISDG 0277-786X Google Scholar
V. Krishnaswamyet al.,
“A digital x-ray tomosynthesis coupled near infrared spectral tomography system for dual-modality breast imaging,”
Opt. Express, 20
(17), 19125
–19136
(2012). http://dx.doi.org/10.1364/OE.20.019125 Google Scholar
V. Ntziachristoset al.,
“MRI-guided diffuse optical spectroscopy of malignant and benign breast lesions,”
Neoplasia, 4
(4), 347
–354
(2002). Google Scholar
M. J. Kimet al.,
“US-guided diffuse optical tomography for breast lesions: the reliability of clinical experience,”
Euro. Radiol., 21 1353
–1363
(2011). Google Scholar
Q. Zhuet al.,
“Ultrasound-guided diffuse optical tomography (DOT) of invasive breast carcinoma: Does tumour total haemoglobin concentration contribute to the prediction of axillary lymph node status?,”
Euro. J. Radiol., 81 3185
–3189
(2012). JBOPFO 1083-3668 Google Scholar
Q. Zhuet al.,
“Early-stage invasive breast cancers: potential role of optical tomography with US localization in assisting diagnosis,”
Radiology, 256 367
(2010). MPHYA6 0094-2405 Google Scholar
D. R. Buschet al.,
“Optical malignancy parameters for monitoring progression of breast cancer neoadjuvant chemotherapy,”
Biomed. Opt. Express, 4
(1), 105
–121
(2013). http://dx.doi.org/10.1364/BOE.4.000105 EJRADR 0720-048X Google Scholar
A. Cerussi et al.,
“Predicting response to breast cancer neoadjuvant chemotherapy using diffuse optical spectroscopy,”
Proc. Natl. Acad. Sci. U. S. .A., 104
(10), 4014
–4019
(2007). EJRADR 0720-048X Google Scholar
S. Jianget al.,
“Predicting breast tumor response to neoadjuvant chemotherapy with Diffuse Optical Spectroscopic Tomography prior to treatment,”
Clin. Cancer Res., 266 433
(2014). RADLAX 0033-8419 Google Scholar
Q. Zhuet al.,
“Breast cancer: assessing response to neoadjuvant chemotherapy by using US-guided near-infrared tomography,”
Radiology, 266 433
(2013). RADLAX 0033-8419 Google Scholar
D. A. Boaset al.,
“Imaging the body with diffuse optical tomography,”
IEEE Signal Process. Mag., 18 57
–75
(2001). http://dx.doi.org/10.1109/79.962278 ISPRE6 1053-5888 Google Scholar
E. M. Vincket al.,
“Increased fibroblast proliferation induced by light emitting diode and low power laser irradiation,”
Lasers Med. Sci., 18 95
–99
(2003). http://dx.doi.org/10.1007/s10103-003-0262-x LMSCEZ 1435-604X Google Scholar
X. Zhang,
“Instrumentation in diffuse optical imaging,”
Photonics, 1
(1), 9
–32
(2014). 2328-7780 Google Scholar
H. T. Whelanet al.,
“Effect of NASA light-emitting diode irradiation on molecular changes for wound healing in diabetic mice,”
J. Clin. Laser Med. Surg., 21 67
–74
(2003). http://dx.doi.org/10.1089/PLT.2003.21.issue-2 JCLSEO 1044-5471 Google Scholar
O. Khullaret al.,
“Image-guided sentinel lymph node mapping and nanotechnology-based nodal treatment in lung cancer using invisible near-infrared fluorescent light,”
Semin. Thorac. Cardiovasc. Surg., 21
(4), 309
–315
(2009). http://dx.doi.org/10.1053/j.semtcvs.2009.11.009 Google Scholar
H.-J. LimC.-H. Oh,
“Indocyanine green-based photodynamic therapy with 785 nm light emitting diode for oral squamous cancer cells,”
Photodiagn. Photodyn. Ther., 8 337
–342
(2011). http://dx.doi.org/10.1016/j.pdpdt.2011.06.002 PPTHBF 1572-1000 Google Scholar
H. Abeet al.,
“Indocyanine green fluorescence imaging system for sentinel lymph node biopsies in early breast cancer patients,”
Surg. Today, 41 197
–202
(2011). http://dx.doi.org/10.1007/s00595-009-4254-8 SUTOE5 1436-2813 Google Scholar
J. H. Klaessenset al.,
“Non-contact multi-spectral imaging combined with thermography to determine physiological changes in perfusion during clinical interventions,”
(2012). Google Scholar
R. Saageret al.,
“A light emitting diode (LED) based spatial frequency domain imaging system for optimization of photodynamic therapy of nonmelanoma skin cancer: quantitative reflectance imaging,”
Lasers Surg. Med., 45 207
–215
(2013). http://dx.doi.org/10.1002/lsm.v45.4 LSMEDI 0196-8092 Google Scholar
D. J. Rohrbachet al.,
“Preoperative mapping of nonmelanoma skin cancer using spatial frequency domain and ultrasound imaging,”
Acad. Radiol., 21 263
–270
(2014). http://dx.doi.org/10.1016/j.acra.2013.11.013 1076-6332 Google Scholar
B. Chanceet al.,
“Breast cancer detection based on incremental biochemical and physiological properties of breast cancers: a six-year, two-site Study1,”
Acad. Radiol., 12 925
–933
(2005). http://dx.doi.org/10.1016/j.acra.2005.04.016 1076-6332 Google Scholar
A. Athanasiouet al.,
“Optical mammography: a new technique for visualizing breast lesions in women presenting non palpable BIRADS 4–5 imaging findings: preliminary results with radiologic–pathologic correlation,”
Cancer Imaging, 7 34
(2007). http://dx.doi.org/10.1102/1470-7330.2007.0006 1470-7330 Google Scholar
Q. Zhuet al.,
“Optimal probing of optical contrast of breast lesions of different size located at different depths by US localization,”
Technol. Cancer Res. Treat., 5 365
–380
(2006). http://dx.doi.org/10.1177/153303460600500408 TCRTBS 1533-0346 Google Scholar
N. G. Chenet al.,
“Simultaneous near-infrared diffusive light and ultrasound imaging,”
Appl. Opt., 40 6367
–6380
(2001). http://dx.doi.org/10.1364/AO.40.006367 APOPAI 0003-6935 Google Scholar
H. Liuet al.,
“Determination of optical properties and blood oxygenation in tissue using continuous NIR light,”
Phys. Med. Biol., 40 1983
(1995). http://dx.doi.org/10.1088/0031-9155/40/11/015 PHMBA7 0031-9155 Google Scholar
Q. ZhuN. ChenS. H. Kurtzman,
“Imaging tumor angiogenesis by use of combined near-infrared diffusive light and ultrasound,”
Opt. Lett., 28 337
–339
(2003). http://dx.doi.org/10.1364/OL.28.000337 OPLEDP 0146-9592 Google Scholar
M. HuangQ. Zhu,
“Dual-mesh optical tomography reconstruction method with a depth correction that uses a priori ultrasound information,”
Appl. Opt., 43 1654
–1662
(2004). http://dx.doi.org/10.1364/AO.43.001654 APOPAI 0003-6935 Google Scholar
BiographyGuangqian Yuan received her BS degree in biomedical engineering from Beihang University, China, in 2010. She joined the Optical and Ultrasound Imaging Lab of the University of Connecticut as a research assistant since 2011 and received her MS degree in biomedical engineering in 2014. Umar Salman Alqasemi received his BSc degree in electrical and computer engineering (biomedical engineering minor) from King Abdulaziz University – Jeddah, Saudi Arabia, in 2007. Afterward, he received his MSc and PhD degrees in biomedical engineering from the University of Connecticut – Storrs, Connecticut, USA, in 2011 and 2013, respectively. Since January 2014, he has been an assistant professor in the Department of Electrical and Computer Engineering at King Abdulaziz University. Aaron Chen is a junior undergraduate at the University of Pennsylvania. His research interests include the biology of cancer and the molecular differences between tumor and normal cells. He will pursue a career in medicine in the future. Yi Yang received his PhD degree from Department of Electrical and Computer Engineering, University of Connecticut, in 2012. Currently, he is working as a product development engineer at Qorex. His research interests include optical imaging and fiber optic sensing. Quing Zhu received her PhD degree from the Bioengineering Department of the University of Pennsylvania in 1992. She is a professor of Biomedical Engineering and Electrical Engineering Departments of the University of Connecticut. Her research interests include diffuse optical tomography and fluorescence tomography, photoacosiustic tomography, optical coherent tomography, and ultrasound imaging for breast and ovarian cancer detection and diagnosis. |
||||||||||||||||||||||||