
|
|
1.IntroductionRecent advances in nanotechnology provide us with a variety of nanomaterials with diverse physical and chemical properties and direct applications in daily life.1,2 Among the inorganic nanoparticles, carbon derivatives, which include carbon nanotubes,3–6 carbon nanofibers,7 fullerenes (),8,9 and nanodiamonds (NDs),10–14 have been used for a broad range of applications, such as electronic, electrochemical devices, sensors, protective coatings, optical window, and biomedical applications.12–15 The bioapplications of carbon nanoparticles reported until now show considerable interactions with different biomolecules and cells,16,17 including blood cells and the elements of blood.17 In contrast to these nanoparticles, nanoscale diamond particles of an average diameter 5 to 100 nm have been proved to be an excellent probe for biolabeling and sensing applications due to their apparent low cytotoxicity and biocompatibility. The natural green fluorescence18–23 of ND particles makes them an attractive substitute for other carbon nanoparticles, metallic nanoparticles,24,25 and highly fluorescent quantum dots.26 It has been recently shown that although carbon nanotubes display cytotoxicity in human lung cells, treatment with 5 or 100 nm carboxylated nanodiamonds (cNDs) did not induce cell death or apoptosis.21,26–30 It is also observed that NDs (such as cNDs) can adsorb large protein molecules, which makes the detection of proteins such as cytochrome c, myoglobin, hemoglobin, and albumin in dilute solution possible.26,31,32 After selective functionalization, it can also serve for the detection of DNA oligonucleotides by using matrix assisted laser desorption/ionization time-of-flight mass spectroscopy.31 There are some other applications like the construction of a biochip with a coating of ND particles carrying immobilized bacterial luciferase.33 Because of the variety of applications offered by NDs in the field of biomedicine, their biocompatibility still remains an important topic. NDs have been reported to be biocompatible for various cells and animal cell cultures. Nevertheless, a recent research report has illustrated that NDs are found to be toxic to some unicellular microorganisms. Lin et al. has shown that ultrafine ND can destroy the T. thermophile and P. caudatum.34 As a consequence, it would be even more interesting to study the antibacterial properties of NDs as well. Until now, the antibacterial behavior of toxic metals,24,35 ceramic oxide nanoparticles,36 titanium dioxide,37 or even pure carbon black or diamond-like carbon nanoparticles38,39 has been observed. However, the mechanism of the biocidal effect has not yet been fully defined. Few studies have reported that the antibacterial action of nanoparticles is attributed to the presence of electronic effects that are brought about as a result of changes in local electronic structures. The antibacterial effect of oxide nanoparticles has been explained considering the fact that the electrons subsequently react with to form superoxide radicals, while the holes react with the surface OH groups to form OH radicals. These radicals attack the organic molecule, which is eventually oxidized to become , , and HCl, thus achieving an antibacterial effect or even free radicals.40 The antibacterial behavior of ultrafine ND particles has not been thoroughly studied. Only one paper analyzes the bactericidial activity of ND both to gram-negative and gram-positive bacteria depending on the NDs’ surface chemistry.41 In the present work, we have used gram-negative bacteria Escherichia coli (E. coli) to study their interaction with 5 nm cNDs and compare with the effect of 100 cNDs. E. coli is an extraordinary diverse prokaryotic model organism; they are normally harmless, but some of them can cause serious diseases in humans, like gastroenteritis, infections of the urinary tract, bloodstream, and central nervous system. We focus on the direct interaction of ultrafine cNDs with E. coli in a nutritious medium and in an aqueous medium to observe the nature of inhibition that occurs during the growth either inside the bacterial cell or in the membrane structure. The destruction in the bacterial cell wall structure has been analyzed using UV-visible spectroscopy and scanning electron microscopy (SEM). Raman spectroscopy has been used to study the interaction of NDs and E. coli to get specific information about the biochemical structures of E. coli after and before interaction. The electrotransformation of E. coli with fluorescent protein markers was done to analyze the interaction mechanism for E. coli. 2.Experimental Procedures2.1.Preparation of Carboxylated Nanodiamond SamplesDetonation NDs with an average size of crystallites of 4 to 5 nm were purchased from Microdiamant AG, Switzerland. The carboxylation of NDs was done to remove the metallic impurities, non-diamond carbon, and to create carboxyl groups on the surface by using a standard chemical method as described earlier.42 The carboxylation of NDs was confirmed by characterizing well-resolved lines of C═O stretching (1720 to and O─H bending (1620 to ) of carboxyl groups on the ND surface using Fourier transform infrared spectroscopy42 (ABB Bomem MB154 FTIR spectrometer, Zurich, Switzerland) (not shown here). The size distribution of 5 nm ND nanoparticles analyzed using a Zetasizer Nano-ZS90 (Malvern Instruments, Worcestershire, United Kingdom) has demonstrated strong aggregation in a water medium. 100 nm ND powders purchased from Kay Diamond, United States of America, has been carboxylated and analyzed via the same procedures and shows many COOH surface groups and an insignificant degree of aggregation. 2.2.Preparation of Bacteria Samples for Growth StudiesE. coli bacteria were cultivated in 5 ml of Luria–Bertani (LB) medium in a shaking incubator (200 rpm) overnight at 37°C. After incubation, the bacteria were separated by centrifugation at 12,000 rcf for 10 min and the sediment was resuspended in LB medium. Optimal cultivating was achieved when the optical density level at a wavelength of 600 nm () reached 0.5 to 1.0 compared to the culture medium OD (OD of 0.1 corresponds to a concentration of ),43 as analyzed by a UV-visible spectrometer (Jasco V-550). 2.3.Experimental Conditions and Instrumental ParameterTo monitor the antibacterial effect in LB medium, aliquot of bacterial aqueous suspension was put in 3 ml of LB medium and incubated at 37°C together with and without 5 nm cNDs () for 13 h. The UV-visible measurements were carried out at 30 min interval up to 13 h. The concentration of bacteria was determined by measuring the absorbance () at different time intervals using a UV-visible spectrometer. Lysozyme () was also used to interact with E. coli in similar conditions. Simultaneously, for the interaction studies in an aqueous medium, E. coli and E. coli interacted with cNDs (0 to 6 h) were washed three times with double distilled water (D. D. water) by centrifugation (12,000 rcf for 10 min, each) and resuspended in 1 ml of D. D. water. For SEM images and Raman measurements, E. coli were incubated with cND particles or lysozyme at 37°C for 4 h. Subsequently, it was centrifuged at 11,000 rcf for 10 min, and the sediment was resuspended in D. D. water (). The samples were dropped and dried on either a silicon substrate or an indium tin oxide-coated glass substrate. SEM images were taken using a scanning electron microscope (SEM JEOL JSM6500F, Japan). Raman measurements were performed using a confocal Raman spectrometer (Alpha 300, Witec, Germany) with a piezo-driven controlled scanning stage, a Nikon objective () lens at room temperature, and an Ar ion laser (Melles Griot) at a wavelength of 488 nm. To avoid specimen damage from laser power, a low laser power ( in focal spot) was used. 2.4.Electrotransformation of E. coli with Fluorescent Protein Markers and Interaction with cND and LysozymeE. coli HB101 cells were rendered electrocompetent for plasmid transformation. Five ml of LB was inoculated with a colony-forming unit of E. coli and incubated overnight at 37°C with shaking at 200 rpm. The overnight culture was diluted 100-fold in LB and incubated at 37°C with shaking at 200 rpm until the reached 0.5 to 1.0. The culture was chilled on ice for 10 min and then centrifuged at 12,000 rcf for 5 min at 4°C. The supernatant was discarded, and the sediment was resuspended in D. D. water at half the diluted culture volume and centrifuged at 12,000 rcf for 5 min at 4°C. This step was repeated two times. The washed cells were then resuspended in a sterile solution with 10% glycerol at a dilution, and dispensed in microcentrifuge tubes that were chilled at 4°C. A volume of of the electrocompetent cells in a chilled 1.5 ml tube was mixed with of plasmid (pGLO, Bio-Rad, Hercules, California). DNA and cells were transferred to a chilled 1 mm gap electroporation cuvette (Bio-Rad) and incubated on ice for 5 min. The cells were then electroporated in a GenePulser II electroporator (Bio-Rad) at a voltage of 1.25 kV, capacitance of , resistance of 200 Ω, and a time constant of 4 ms. The cells were transferred to 1 ml of LB and incubated at 37°C for 1 h with shaking at 100 rpm. of cell culture was then spread onto selective LB agar plates supplemented with ampicillin and incubated overnight at 37°C. Successful E. coli transformations survived and were verified with the green fluorescent protein (GFP) expression by overnight growth on LB agar supplemented with of arabinose. Each positive clone that emitted green fluorescence by UV light illumination was transferred to LB containing ampicillin for further propagation. The bacteria were washed and finally resuspended in 1 ml of D. D. water. For electrotransformation of E. coli, cNDs with various concentrations (100, 500, and ) and of lysozyme separately interacted with 3 ml of E. coli suspension in water. The interaction was done for 4 h by incubating the solutions at 37°C with shaking. Additionally, a negative control E. coli sample was prepared by mechanically breaking the bacterial cell membrane using ultrasonic centrifugation. The volume of the samples was 3 ml. After 4 h, E. coli was separated from all of the samples by ordinary centrifuge. The absorption spectra of the supernatant of these six samples were measured with equal dilution to monitor the change in the absorbance at 260 nm, which is the signal of nucleic acids. The supernatants were also exposed to UV light to visualize the transformation of GFP containing E. coli. 3.Results and Discussion3.1.Optical Density MeasurementsThe antibacterial effect was examined by measuring the bacterial growth in the presence of 5 nm cND particles in LB medium. The growth was estimated via measurements of the turbidity of bacterial suspension using a UV-visible spectrophotometer. Optical densities at 600 nm as a function of time were recorded periodically up to 13 h for the control and the solution containing 5 nm cND particles. In the visible range (600 nm), the light is scattered by the bacteria as a whole. A typical growth curve is shown in Fig. 1(a). The antibacterial effect of lysozyme was also studied for bacteria in LB medium prepared with similar conditions. The inset in Fig. 1(a) shows the growth curve in the presence of lysozyme. There is an obvious growth delay of E. coli in the presence of 5 nm cNDs and lysozyme in the LB medium. Fig. 1(a) Growth curve as a function of time of E. coli, E. coli incubated with 5 nm carboxylated nanodiamond (cNDs) () and 5 nm cNDs () in Luria–Bertani (LB) medium. Inset shows growth curve of E. coli incubated with lysozyme () in LB medium. (b) The specific growth rates were calculated for E. coli and E. coli in the presence of 5 nm cND ().  Figure 1(b) displays the specific growth rate of E. coli in the presence of cND. The specific growth rate can be calculated using the equation , where is time.44 It can be seen that 5 cND particles have an impact on the bacterial growth pattern in the first 3 h. The growth rate gradually reached a stable state after 6 h. Initially, growth was slow for both experiments; it could be that E. coli was adapting to a new environment. It reached an exponential growth phase in 3 h and, finally, a stationary state. However, it can be seen from the figure that the inhibition of growth in the presence of cND is appreciable at the initial stage of bacterial growth in a highly nutritious medium. To gather more details about the interaction, UV-visible absorption spectra for the whole range of absorption, 250 to 400 nm, have been collected. The absorbance spectra for E. coli treated with cNDs in LB medium during 1, 2, and 4 h of growth are displayed in Fig. 2. Every spectrum has been corrected by subtracting the absorbance of 5 nm cND particles in this wavelength range. The inserts of Fig. 2 show the absorbance spectra of E. coli and E. coli treated with lysozyme under the identical conditions. We can observe that the absorption profile of E. coli after interaction with cNDs has changed drastically. Usually, the peak in the absorbance spectrum near the wavelength of 260 nm is due to DNA and membrane proteins inside the bacterial cells. In the visible range, the bacteria scatter light that can affect the curve or spectrum. It can be seen for E. coli that the absorbance peak at 260 nm has shifted after interaction with cND particles to for the initial incubation time of 1 h. The absorption peak has split into two peaks with peak positions at 285 and 300 nm after the interaction of E. coli with cND (E. coli + cND) particles for an incubation time of 4 h. The interaction of E. coli with lysozyme showed almost similar changes in absorbance. Thus, from the absorption spectra, it is suggested that there is a definite interaction at the bacterial cell membrane surface, which may destroy the integrity of the cell wall proteins. At the initial stage of interaction, before the cell division period (40 min) of E. coli, they might be efficiently killed by the cND particles and cell wall proteins may come out in the solution resulting in a shift in the absorption maxima formation as shown in the figure. The splitting of the two absorption maxima at 285 and 300 nm might have originated from a change in the bacterial cell wall components, i.e., proteins consist of tryptophan and tyrosine, which may denature after the interaction.45 From the figure, the absorbance of this new peak was also found to increase consistently with time of incubation. As the incubation time increases, the bacterial population also increases and corresponding interaction leads to an increase in the product formation after lysis, which has been observed from absorbance data for 4 h of incubation. The shift of the 260 nm and a steady increase in 300 nm absorbance with the time of incubation of E. coli with cNDs further signifies the cell wall structural integrity has been changed in the presence of cND particles and that may have caused cell death. Fig. 2UV-visible absorbance spectra of E. coli + 5 cND () with different time of incubation in LB medium. The spectra were corrected by subtraction of the absorbance from 5 cND particles in this range. Top insert shows UV-visible absorbance spectra of E. coli and bottom insert shows UV-visible absorbance spectra of E. coli with lysozyme. 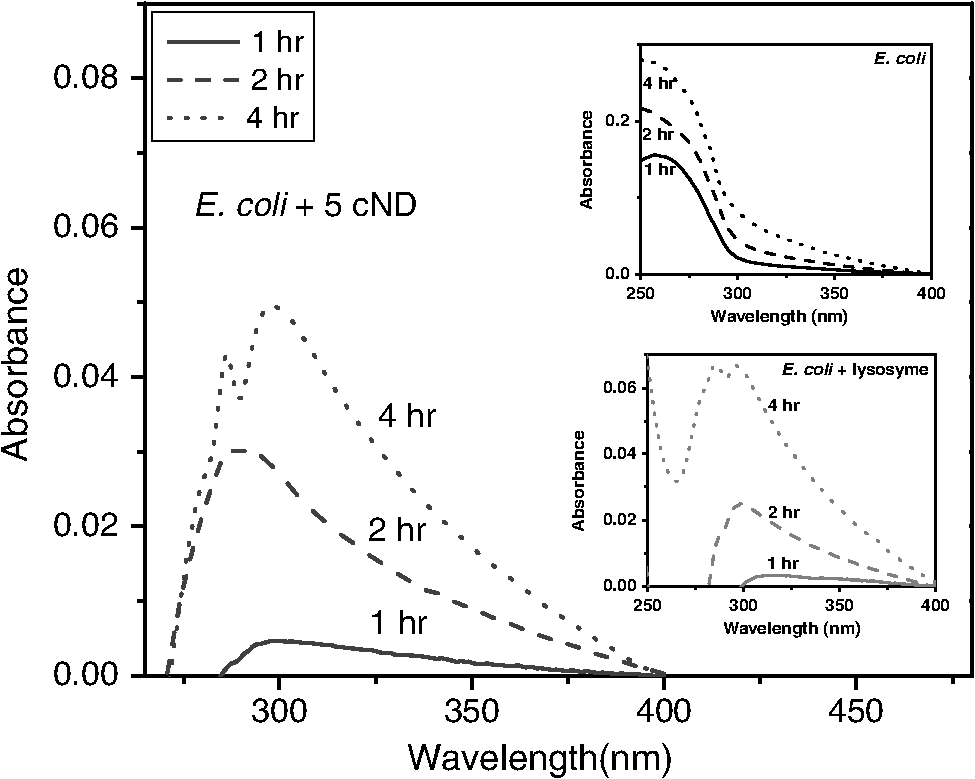 In order to monitor the number of E. coli still alive in LB medium, both E. coli and E. coli + cNDs suspension have been centrifuged and the LB medium was removed. The E. coli were resuspended in D. D. water and an absorbance at 260 nm was measured, shown in Table 1. E. coli + cND in an aqueous medium () and only E. coli still alive in the aqueous medium are compared. The concentration of bacteria () is much less (28%) for 4 h of treatment, which means that 72% have suffered lysis in the presence of cND particles. The for pure E. coli increased as the time increased. Thus, after extraction into water, the E. coli which was still alive, can contribute to the 260 nm absorbance. Table 1Optical absorbance data of E. coli in Luria–Bertani medium and transfer into double distilled (D. D.) water after and before treatment with 5 nm carboxylated nanodiamond (cND) particles for measurement time from 0 to 6 h.
Separately, a controlled growth experiment in an aqueous medium with bacteria and cND interaction was performed. E. coli can neither grow drastically with a less nutrient medium nor repair the damage occurring at the outer wall due to the cNDs’ interaction. The absorbance data () has been shown in Table 2. It can be seen from the table that almost 86% of the E. coli died within 4 h. Thus, the NDs’ effect becomes more in the less nutrient medium and the death rate has been found to be much higher in water. We can say at this point that interaction with NDs might have generated defects at the bacterial cell wall due to a change in the protein structure. It is known that E. coli cell has a lipopolysaccharide (LPS) protective layer that prevents them from osmotic pressure differences in the surrounding medium. Any damage will allow the water molecules to gradually move inside the cell, which may give rise to excessive osmotic pressure. The cells cannot withstand such conditions; they eventually explode, whereas without cND treatment, cells do not explode due to the presence of a strong cell wall with a protective LPS layer. Table 2The percentage decay characteristic of E. coli after the treatment of 5 nm cNDs (100 μg/ml) in D. D. water for 0 to 6 h of time span.
3.2.SEM MicroscopyFigure 3 shows typical SEM images of E. coli [Fig. 3(a)], E. coli after treatment with lysozyme [Fig. 3(b)], with 5 nm cNDs [Figs. 3(c) and 3(d)], and 100 nm cNDs [Figs. 3(e) and 3(f)]. SEM images show significant changes for most of the bacteria treated with 5 nm cND. From the images, it can be seen that there is a definite destruction of bacteria with the attached 5 nm cNDs after interaction with 5 nm cND particles and drying. The cell wall of the bacteria visually has broken partly by the interaction with 5 nm cND particles and the bacteria have lost their regular shape. However, 100 nm cNDs do not show a visible destruction of the bacterial cell wall. The SEM mages of E. coli after interaction with the lysozyme solution show that the cell wall of bacteria has been affected severely, the cell wall has been completely washed away, and the bacteria are turned into an amorphous biomass. 3.3.Raman Spectroscopic StudyRaman investigation of bacterial interaction with cNDs was carried out to get a more detailed view about the changes in the bacterial cell wall surface, particularly where cND is attached. In spite of the low Raman signal of bacteria (and particularly E. coli), Raman study of the bacteria allows estimation of the variations of molecular structure and functional states.46,47 On the other hand, confocal Raman spectroscopy with Raman mapping allows high sensitive image detection both in vitro and in vivo in the cellular level. Raman mapping shows the distribution of Raman signal intensity of a certain molecular structure through vibration in the selected wavenumber range. Raman signal from the bacteria together with cNDs at a particular position could be measured by mapping a selected area of the bacteria sample. Raman signal from bacteria is very weak, whereas cND has higher signals which are selective and can be distinguished from lower signals originating from bacteria. Figures 4(a) and 4(b) display a typical Raman mapping image of E. coli and cNDs by 488 nm laser excitation at a 6 mW laser power at the objective output. Figure 4(a) is an optical image of a single E. coli treated with cNDs, and Fig. 4(b) is the Raman mapping image in pseudocolors (characterizing the intensity of Raman signal) mapped in the square box area () in the 1000 to wavenumber range for various components within the sample. Figure 4(c) shows the Raman spectra obtained for cND and E. coli at the positions marked at points 1 and 2 in Fig. 4(b). Raman signal at 1290 to was locked for 5 nm cND (Ref. 48) and for E. coli, typical -CH Raman signals were locked for the 2820 to range. The intensities of the clearly visible peaks at (corresponding to lipids, ) and correspond to amide I of protein and the intensities of 1325, 1243.5, and correspond to amide III, nucleic acids, and nucleotides, respectively.38,39,49 It is clearly observed that the bright signals, which originate from the cND (point 1), signify that cNDs were adsorbed at the bacterial cell surface in this particular area. The less intense bacteria spectra have been observed from other parts of the bacterial cell membrane near point 2, where no cNDs have been found. The Raman mapping experiment of a single bacterium proves that cNDs adsorption at the bacterial cell surface has occurred. Fig. 4Interaction of E. coli with 5 nm cND () for 30 s in aqueous medium observed by Raman microscopy. (a) Optical image of a single E. coli interacted with 5 nm cND. (b) Raman mapping image mapped in the 1000 to wavenumber region of cND and E. coli using a 488 nm laser excitation and at 6 mW laser power at the () objective output. (c) Raman spectra from 5 nm cND attached at the bacterial cell membrane originates when mapped in the range from 1290 to corresponding to point 1 as marked in (b) and for E. coli-C-H Raman signal (2820 to ) corresponding to point 2 as marked in (b).  To compare the Raman spectral variations which might be caused by structural changes at the bacteria interaction with adsorbed cND particles (like the signal intensity and relative shifts in the peak positions), more rigorous Raman experiments have been performed. Raman spectra of a single E. coli and E. coli attached with 5 nm NDs () in a dry state on a silicon substrate were performed with higher spectral resolution at different points on the bacterial cell wall surface. Figure 5 demonstrates the distribution of intensity of the spectra in the 1200 to range along with Raman mapping image. The obtained Raman spectrum corresponds to the points marked as 1, 2, and 3 in the mapping image at different places of contact of the cNDs with E. coli. The spectrum of a single bacterium is used for comparison. The relative intensity of the peaks in the spectrum of the bacterium interacting with cNDs differs from the noninteracting bacteria. It is observed that there is a small shift of the amide I peak (of protein) from 1654 to , which specifies that changes occur in the structure of the cell wall components in the presence of cND particles. Fig. 5Raman spectra of a single E. coli (control) and E. coli treated with 5 nm cNDs () in dry state on silicon substrate that were measured at different points on the bacterial cell wall surface. The inset shows the Raman mapping image of the single E. coli treated with cNDs; the distribution of intensity of the spectra in the range from 1000 to were mapped. Raman spectra are shown corresponding to the points marked in the image and compared with the Raman spectra of E. coli (control) sample. All spectra were measured using 488 nm laser excitation tuning at 6.06 mW laser power at the objective output.  3.4.Electrotransformation of E. coliTo further verify the nature of interaction of the bacterial cell with ultrafine cND particles, electrotransformation of E. coli with fluorescent protein has been performed to make this E. coli highly fluorescent with a green color with a 488-nm excitation. The aim was to confirm if the bacterial cell membrane has been ruptured after treatment with cNDs in water. If the bacterial cell membrane is ruptured, then the GFP present in the E. coli will come out to the medium along with the DNA. When they are exposed to UV irradiation, theses protein molecules serve as markers with green fluorescence to signify the visual presence of DNA in the medium. We have compared the fluorescent protein containing E. coli, and E. coli treated with 5 nm cNDs and lysozyme. The sample specifications are (1) E. coli (control), E. coli + 5 nm cNDs with various concentrations of (2) , (3) , (4) , (5) E. coli + lysozyme (), and (6) E. coli (negative control, which had ultrasonic treatment). The samples were incubated at 37°C with continuous shaking for 4 h and were then centrifuged. The absorption spectra of the supernatant of the samples after interaction are shown in Fig. 6(a) and the corresponding fluorescence intensity under UV irradiation has been displayed in Fig. 6(b). The absorbance at 260 nm for E. coli and E. coli treated with cNDs having three different concentrations does not show any appreciable change. However, E. coli treated with lysozyme and the negative control (ultrasonic destruction of the bacterial membrane) sample show a very sharp increase in the absorbance at 260 nm as shown in the inset of Fig. 6(a). The green emission was visible only for samples 5 and 6, shown in Figs. 6(b-v) and 6(b-vi). This indicates that either interaction with lysozyme or the mechanical destruction of the cell wall by ultrasonic centrifugation allows the DNA and GFP to come out into the solution. The interaction of cNDs with E. coli in a water medium does not cause complete destruction of the bacterial cell wall. Fig. 6(a) The absorbance spectra and (b) the fluorescence emission images under UV irradiation of the supernatant of (b-i) E. coli, E. coli treated with 5 nm cNDs with the concentration of (b-ii) , (b-iii) , (b-iv) , E. coli treated with (b-v) of lysozyme for 4 h of interaction, and (b-vi) E. coli (negative control) ultrasonic destruction of the bacterial membrane. The insert in (a) shows the values of for all the samples. 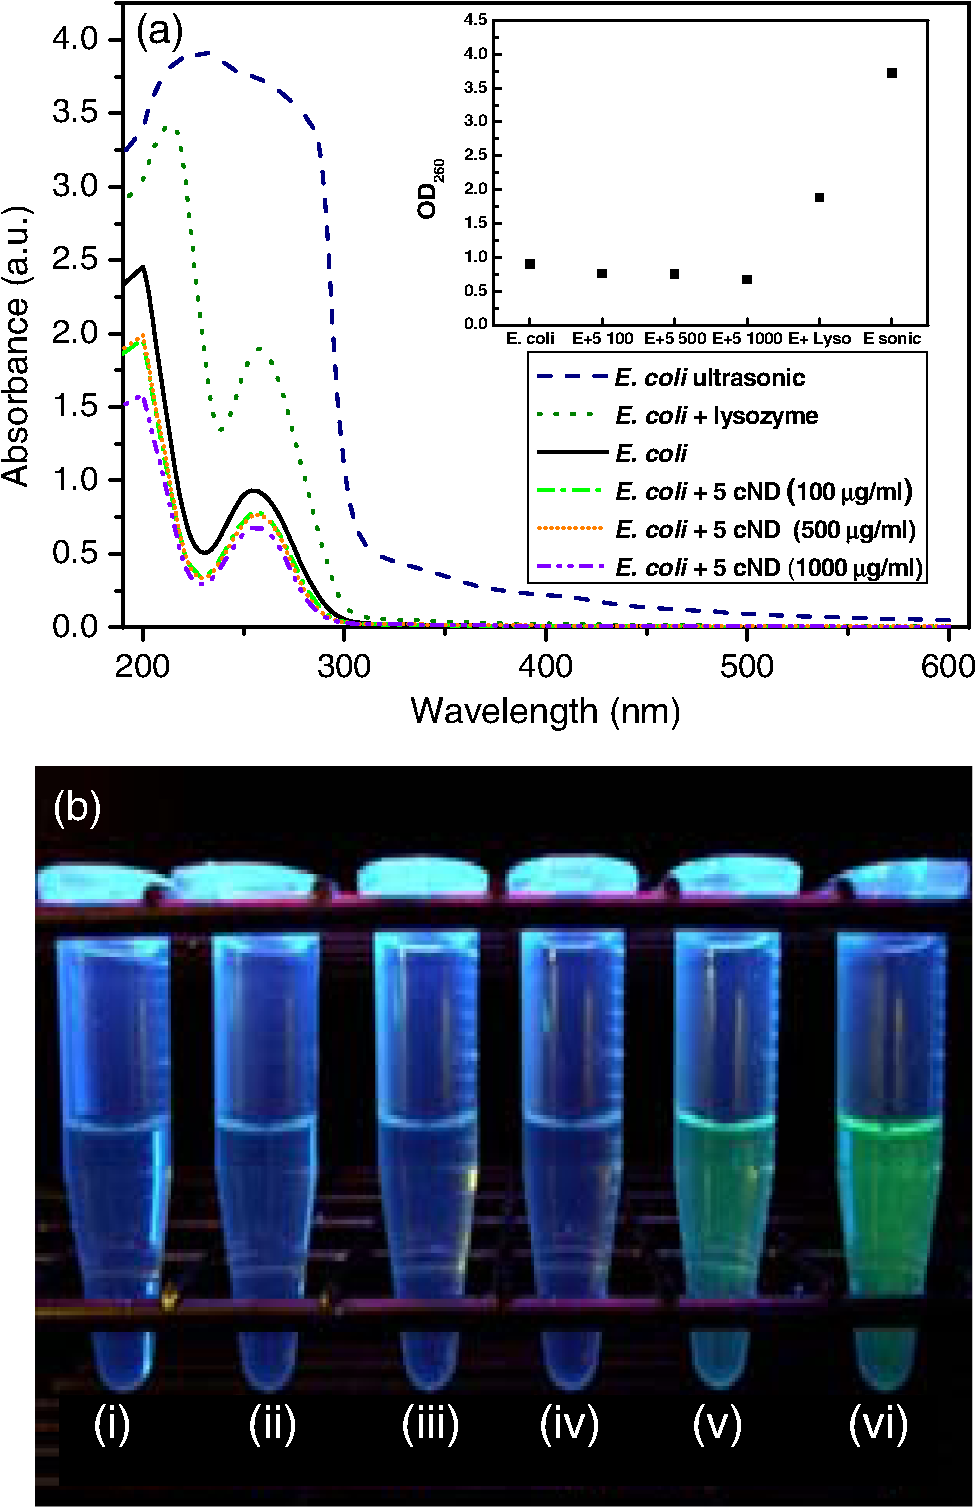 3.5.MechanismFrom the above results, it is clear that 5 nm cNDs interact with bacteria and affect the bacterial cell wall; however, 100 nm cND particles remain inactive [see SEM images in Figs. 3(e) and 3(f)]. In the work in Ref. 41, the surface chemistry of NDs is considered as the driving force of the ND antibacterial effect. Additionally, we can suppose that the smaller-sized NDs exhibit an antibacterial effect due to their surface structural properties and high surface-to-volume ratio, which makes them chemically more active than large NDs. It should also be mentioned that the small-size cNDs (5 nm), including approximately 6000 carbon atoms, reside at the surface, forming a graphitic shoot surrounding the nanoparticle surface. From Raman spectrum, the 5 nm cND has an obvious graphite signal, characterizing the presence of graphitic carbon, which in the smaller-size cND may be responsible for their antibacterial activity in this interaction as implied by the observation of the decreasing antibacterial activity of extrapurified NDs.41 Previously, the smaller-size ZnO nanoparticles have also been found to show better antibacterial activity50 compared to the larger ones. It was reported that the formation of active oxygen species, such as superoxides, at the nanoparticle bacteria interface may kill bacteria.51 The small size detonation NDs10 used in our studies have a chemically active surface with many organic functional groups, which can act as promising catalysts52 in the degradation of bacterial cell membrane proteins. Five nm cNDs may form defects at the bacterial cell wall, which are suitable for making a good surface contact. The leaking level of DNA/RNA and GFP, SEM morphology changes, and Raman spectroscopic results suggest that the protein structure on the bacterial cell wall have been changed after interaction with these ultrafine cND particles. The electroluminescent E. coli experiment indicates the formation of some defective cell wall structures without complete destruction in the interaction in a water medium. At the current status, we can only propose that the interaction is due to the highly active surface of ultrafine cNDs, which, due to their size and surface, partially damage the bacterial outer cell membrane leading to the death of E. coli. The antibacterial effect of ultrafine cNDs is completely different from that of the enzymatic reaction by lysozyme where the cell walls are separated from the cytoplasmic membrane and damages in the inner peptidoglycan layer49 can result in cell death. 4.ConclusionIn this work, the antibacterial effect of ultrafine cND particles have been investigated using UV-visible, SEM, and Raman spectroscopy. It is observed that carboxylated detonation NDs show an obvious antibacterial effect toward gram-negative bacteria E. coli. The maxima absorbance of E. coli in the presence of 5 nm cNDs have been shifted (from 260 to 285 nm) and a new peak is generated (at 300 nm), which indicates the change of the cell wall structure of the bacteria. 86% of E. coli have suffered lysis within 4 h in an aqueous medium. SEM data show that small-size cND particles cause destruction of E. coli cells after interaction. Raman spectrum confirms the change in the amino groups of the cell protein. In addition, the interaction of ultrafine cND particles with highly fluorescent E. coli indicated that the rupture mechanism of the E. coli cell wall is totally different from that of the enzymatic destruction by lysozyme. We conclude that the mechanism of the cNDs’ interaction with bacteria might be physical in nature, or due to a highly reactive surface, which might hit the bacterial outer membrane and cause defects in the cell membrane resulting in cell death. AcknowledgmentsThe authors would like to thank National Science Council of Taiwan, for financial support by a Grant No. NSC-102-2120-M-259-001. ReferencesD. Vollath, Nanomaterials: An Introduction to Synthesis Properties and Applications, Wiley-VCH, Weinheim
(2008). Google Scholar
G. Cao, Nanostructures and Nanomaterials: Synthesis, Properties and Applications, London, Imperial College Press
(2006). Google Scholar
J. HoneV. V. Deshpande,
“Coupling strongly, discretely,”
Science, 325
(5944), 1084
–1085
(2009). http://dx.doi.org/10.1126/science.1178574 SCIEAS 0036-8075 Google Scholar
B. Lassagneet al.,
“Coupling mechanics to charge transport in carbon nanotube mechanical resonators,”
Science, 325
(5944), 1107
–1110
(2009). http://dx.doi.org/10.1126/science.1174290 SCIEAS 0036-8075 Google Scholar
C. Zamora-Ledezmaet al.,
“Photoluminescent single wall carbon nanotube-silica composite gels,”
Carbon, 46
(9), 1253
–1255
(2008). http://dx.doi.org/10.1016/j.carbon.2008.04.020 CRBNAH 0008-6223 Google Scholar
S. Chenet al.,
“Amperometric third-generation hydrogen peroxide biosensor based on the immobilization of hemoglobin on multiwall carbon nanotubes and gold colloidal nanoparticles,”
Biosens. Bioelectron., 22
(7), 1268
–1274
(2007). http://dx.doi.org/10.1016/j.bios.2006.05.022 BBIOE4 0956-5663 Google Scholar
H. Liet al.,
“Synthesis and characterization of carbon fibrils formed by stacking graphite sheets of nanometer thickness,”
Carbon, 47
(1), 328
–330
(2009). http://dx.doi.org/10.1016/j.carbon.2008.09.053 CRBNAH 0008-6223 Google Scholar
S. Deguchiet al.,
“Stabilization of C60 nanoparticles by protein adsorption and its implications for toxicity studies,”
Chem. Res. Toxicol., 20
(6), 854
–858
(2007). http://dx.doi.org/10.1021/tx6003198 CRTOEC 0893-228X Google Scholar
J. Leeet al.,
“Application of fullerene-added nano-oil for lubrication enhancement in friction surfaces,”
Tribol. Int., 42
(3), 440
–447
(2009). http://dx.doi.org/10.1016/j.triboint.2008.08.003 TRBIBK 0301-679X Google Scholar
A. Krüger,
“New carbon materials: biological applications of functionalized nanodiamond materials,”
Chem. Eur. J., 14
(5), 1382
–1390
(2008). http://dx.doi.org/10.1002/(ISSN)1521-3765 CEUJED 0947-6539 Google Scholar
H. Huanget al.,
“Active nanodiamond hydrogels for chemotherapeutic delivery,”
Nano Lett., 7
(11), 3305
–3314
(2007). http://dx.doi.org/10.1021/nl071521o NALEFD 1530-6984 Google Scholar
Y. Yuanet al.,
“Biodistribution and fate of nanodiamonds in vivo,”
Diam. Relat. Mater., 18
(1), 95
–100
(2009). http://dx.doi.org/10.1016/j.diamond.2008.10.031 DRMTE3 0925-9635 Google Scholar
C. C. Fuet al.,
“Characterization and application of single fluorescent nanodiamond as cellular biomarkers,”
Proc. Natl. Acad. Sci. USA, 104
(3), 727
–732
(2007). http://dx.doi.org/10.1073/pnas.0605409104 1091-6490 Google Scholar
S. C. Henset al.,
“Nanodiamond bioconjugate probes and their collection by electrophoresis,”
Diam. Relat. Mater., 17
(11), 1858
–1866
(2008). http://dx.doi.org/10.1016/j.diamond.2008.03.020 DRMTE3 0925-9635 Google Scholar
A. S. Barnard,
“Diamond standard in diagnostics: nanodiamond biolabels make their mark,”
Analyst, 134
(9), 1751
–1764
(2009). http://dx.doi.org/10.1039/b908532g ANLYAG 0365-4885 Google Scholar
W. C. Pohet al.,
“Biosensing properties of diamond and carbon nanotubes,”
Langmuir, 20
(13), 5484
–5492
(2004). http://dx.doi.org/10.1021/la0490947 LANGD5 0743-7463 Google Scholar
A. Radomskiet al.,
“Nanoparticle-induced platelet aggregation and vascular thrombosis,”
Br. J. Pharmacol., 146
(6), 882
–893
(2005). http://dx.doi.org/10.1038/sj.bjp.0706386 BJPCBM 0007-1188 Google Scholar
A. P. Puzyret al.,
“Nanodiamonds with novel properties: a biological study,”
Diam. Relat. Mater., 16
(12), 2124
–2128
(2007). http://dx.doi.org/10.1016/j.diamond.2007.07.025 DRMTE3 0925-9635 Google Scholar
C.-Y. Chenget al.,
“Direct and in vitro observation of growth hormone receptor molecules in A549 human lung epithelial cells by nanodiamond labeling,”
Appl. Phys. Lett., 90
(16), 163903
(2007). http://dx.doi.org/10.1063/1.2727557 APPLAB 0003-6951 Google Scholar
E. Perevedentsevaet al.,
“The interaction of the protein lysozyme with bacteria E. coli observed using nanodiamond labeling,”
Nanotechnology, 18
(31), 315102
(2007). http://dx.doi.org/10.1088/0957-4484/18/31/315102 NNOTER 0957-4484 Google Scholar
K.-K. Liuet al.,
“Biocompatible and detectable carboxylated nanodiamond on human cell,”
Nanotechnology, 18
(32), 325102
(2007). http://dx.doi.org/10.1088/0957-4484/18/32/325102 NNOTER 0957-4484 Google Scholar
Y.-R. Changet al.,
“Mass production and dynamic imaging of fluorescent nanodiamonds,”
Nat. Nanotechnol., 3
(5), 284
–288
(2008). http://dx.doi.org/10.1038/nnano.2008.99 1748-3387 Google Scholar
V. VaijayanthimalaH.-C. Chang,
“Functionalized fluorescent nanodiamonds for biomedical applications,”
Nanomedicine, 4
(1), 47
–55
(2009). http://dx.doi.org/10.2217/17435889.4.1.47 1743-5889 Google Scholar
S. M. Hussainet al.,
“Toxicity evaluation for safe use of nanomaterials: recent achievements and technical challenges,”
Adv. Mater., 21
(16), 1549
–1559
(2009). http://dx.doi.org/10.1002/adma.v21:16 ADVMEW 0935-9648 Google Scholar
A. M. Schrandet al.,
“Differential biocompatibility of carbon nanotubes and nanodiamonds,”
Diam. Relat. Mater., 16
(12), 2118
–2123
(2007). http://dx.doi.org/10.1016/j.diamond.2007.07.020 DRMTE3 0925-9635 Google Scholar
M. E. Akermanet al.,
“Nanocrystal targeting in vivo,”
Proc. Natl. Acad. Sci. USA, 99
(20), 12617
–12621
(2002). http://dx.doi.org/10.1073/pnas.152463399 1091-6490 Google Scholar
L.-C. L. HuangH.-C. Chang,
“Adsorption and immobilization of cytochrome C on nanodiamonds,”
Langmuir, 20
(14), 5879
–5884
(2004). http://dx.doi.org/10.1021/la0495736 LANGD5 0743-7463 Google Scholar
A. M. Schrandet al.,
“Are diamond nanoparticles cytotoxic?,”
J. Phys. Chem. B, 111
(1), 2
–7
(2007). http://dx.doi.org/10.1021/jp066387v JPCBFK 1520-6106 Google Scholar
K. Bakowicz-MituraG. BartoszS. Mitura,
“Influence of diamond powder particles on human gene expression,”
Surf. Coat. Technol., 201
(13), 6131
–6135
(2007). http://dx.doi.org/10.1016/j.surfcoat.2006.08.142 SCTEEJ 0257-8972 Google Scholar
J.-I. Chaoet al.,
“Nanometer-sized diamond particle as a probe for bio labeling,”
Biophys. J., 93
(6), 2199
–2208
(2007). http://dx.doi.org/10.1529/biophysj.107.108134 BIOJAU 0006-3495 Google Scholar
X. L. Konget al.,
“High-affinity capture of proteins by diamond nanoparticles for mass spectrometric analysis,”
Anal. Chem., 77
(1), 259
–265
(2005). http://dx.doi.org/10.1021/ac048971a ANCHAM 0003-2700 Google Scholar
K. Ushizawaet al.,
“Covalent immobilization of DNA on diamond and its verification by diffuse reflectance infrared spectroscopy,”
Chem. Phys. Lett., 351
(1–2), 105
–108
(2002). http://dx.doi.org/10.1016/S0009-2614(01)01362-8 CHPLBC 0009-2614 Google Scholar
A. P. Puzyr’I. O. PozdniakovaV. S. Bondar,
“Design of a luminescent biochip with nanodiamonds and bacterial luciferase,”
Phys. Solid State, 46
(4), 761
–763
(2004). http://dx.doi.org/10.1134/1.1711469 PSOSED 1063-7834 Google Scholar
Y.-C. Linet al.,
“Nanodiamond for intracellular imaging in the microorganisms in vivo,”
J. Biophotonics, 5
(11–12), 838
–847
(2012). http://dx.doi.org/10.1002/jbio.201200088 JBOIBX 1864-063X Google Scholar
I. SondiB. Salopek-Sondi,
“Silver nanoparticles as antimicrobial agent: a case study in E. coli as a model for gram-negative bacteria,”
J. Colloid Interface Sci., 275
(1), 177
–182
(2004). http://dx.doi.org/10.1016/j.jcis.2004.02.012 JCISA5 0021-9797 Google Scholar
L. Zhanget al.,
“ZnO nanofluids—a potential antibacterial agent,”
Prog. Nat. Sci., 18
(8), 939
–944
(2008). http://dx.doi.org/10.1016/j.pnsc.2008.01.026 PNASEA 1002-0071 Google Scholar
C.-L. Chenget al.,
“The effects of the bacterial interaction with visible-light responsive titania photocatalyst on the bactericidal performance,”
J. Biomed. Sci., 16
(1), 7
(2009). http://dx.doi.org/10.1186/1423-0127-16-7 JBCIEA 1021-7770 Google Scholar
B. Mohantyet al.,
“Physical and anti-microbial characteristics of carbon nanoparticles prepared from lamp soot,”
Nanotechnology, 18
(44), 445102
(2007). http://dx.doi.org/10.1088/0957-4484/18/44/445102 NNOTER 0957-4484 Google Scholar
M. L. Morrisonet al.,
“Electrochemical and antimicrobial properties of diamond like carbon-metal composite films,”
Diam. Relat. Mater., 15
(1), 138
–146
(2006). http://dx.doi.org/10.1016/j.diamond.2005.08.031 DRMTE3 0925-9635 Google Scholar
K.-J. Shiehet al.,
“Antibacterial performance of photocatalyst thin film fabricated by defection effect in visible light,”
Nanomedicine, 2
(2), 121
–126
(2006). http://dx.doi.org/10.1016/j.nano.2006.04.001 1743-5889 Google Scholar
J. Wehlinget al.,
“Bactericidal activity of partially oxidized nanodiamonds,”
ASC Nano, 8
(6), 6475
–6483
(2014). http://dx.doi.org/10.1021/nn502230m 1936-0851 Google Scholar
J.-S. Tuet al.,
“Size-dependent surface CO stretching frequency investigations on nanodiamond particles,”
J. Chem. Phys., 125
(17), 174713
(2006). http://dx.doi.org/10.1063/1.2370880 JCPSA6 0021-9606 Google Scholar
G. SezonovD. Joseleau-PetitR. D’Aei,
“Escherichia coli physiology in Luria-Bertani broth,”
J. Bacteriol., 189
(23), 8746
–8749
(2007). http://dx.doi.org/10.1128/JB.01368-07 JOBAAY 0021-9193 Google Scholar
M. Berneyet al.,
“Specific growth rate determines the sensitivity of Escherichia coli to thermal, UVA, and solar disinfection,”
Appl. Environ. Microbiol., 72
(4), 2586
–2593
(2006). http://dx.doi.org/10.1128/AEM.72.4.2586-2593.2006 AEMIDF 0099-2240 Google Scholar
F.-X. Schmid,
“Biological macromolecules: UV-visible spectrophotometry,”
Encyclopedia of Life Sciences, 1
–4 Wiley, Chichester, Uinited Kingdom
(2001). Google Scholar
K. Maquelinet al.,
“Identification of medically relevant microorganisms by vibrational spectroscopy,”
J. Microbiol. Methods, 51
(3), 255
–271
(2002). http://dx.doi.org/10.1016/S0167-7012(02)00127-6 JMIMDQ 0167-7012 Google Scholar
T.-T. Liuet al.,
“A high speed detection platform based on surface-enhanced Raman scattering for monitoring antibiotic-induced chemical changes in bacteria cell wall,”
PLoS ONE, 4
(5), e5470
(2009). http://dx.doi.org/10.1371/journal.pone.0005470 1932-6203 Google Scholar
P.-H. ChungE. PerevedentsevaC.-L. Cheng,
“The particle size-dependent photoluminescence of nanodiamonds,”
Surf. Sci., 601
(18), 3866
–3870
(2007). http://dx.doi.org/10.1016/j.susc.2007.04.150 SUSCAS 0039-6028 Google Scholar
M. R. J. Salton,
“The lysis of micro-organisms by lysozyme and related enzymes,”
J. Gen. Microbiol., 18
(2), 481
–490
(1958). http://dx.doi.org/10.1099/00221287-18-2-481 JGMIAN 0022-1287 Google Scholar
L. Zhanget al.,
“Investigation into the antibacterial behaviour of suspensions of ZnO nanoparticles (ZnO nanofluids),”
J. Nanopart. Res., 9
(3), 479
–489
(2007). http://dx.doi.org/10.1007/s11051-006-9150-1 JNARFA 1388-0764 Google Scholar
P. K. Stoimenovet al.,
“Metal oxide nanoparticles as bactericidal agents,”
Langmuir, 18
(17), 6679
–6686
(2002). http://dx.doi.org/10.1021/la0202374 LANGD5 0743-7463 Google Scholar
V. S. Bondaret al.,
“Catalytic activity of nanodiamond particles in organic reactions,”
Dokl. Biochem. Biophys., 418
(1), 11
–13
(2008). http://dx.doi.org/10.1134/S1607672908010031 1607-6729 Google Scholar
BiographyAnindita Chatterjee received her PhD degree in nanochemistry (2008, Jadavpur University, Kolkata, India). She worked as a postdoctoral research fellow at the Physics Department, National Dong Hwa University, Taiwan, in 2009 to 2010, and the Department of Physical Chemistry, Academia Sinica, Taiwan, in 2010. Presently she is an assistant professor in K L University, India. Her research is on inorganic nanomaterials like cadmium chalcogenide, TiO2, metal oxides, nanodiamond nanoparticles, and their biological applications. Elena Perevedentseva received her PhD degree in physics from Moscow State University. She has been working at the National Dong Hwa University, Hualien, Taiwan, since 2004. Her research is focused on microscopic and spectroscopic study of nanoparticle interaction with biological objects. She also collaborates as a senior researcher with the P. N. Lebedev Physics Institute of Russian Academy of Sciences, Moscow, Russia, working in the field of optics and spectroscopy. Mona Jani is currently a postdoctoral fellow at Universidade Estadual de Campinas, Brazil. Previously, she was a postdoctoral fellow at National Dong Hwa University, Taiwan, from 2010 to 2013. She received her PhD degree in 2010 in physics from the University of Pune, India. She researched synthesis, functionalizations, surface modifications, and characterizations of functional oxides, and CMR manganites, and nanodiamond for nanobiomedicine. Her current research is focused on the possible superconductivity in surface modified nanodiamond. Chih-Yuan Cheng received his BSc degree in physics from the Chinese Culture University, Taiwan. He graduated from National Dong Hwa University with a master’s degree in physics in 2007. During graduate studies, his research was focused on nanodiamond-protein complexes and their interaction with bacterial and cells via spectroscopic means. He currently works as an engineer in Hsinchu Science and Industrial Park, Taiwan. Ying-Siou Ye completed her BSc and MSc degrees in physics from National Dong Hwa University in 2011 and 2013, respectively. She studied interaction of nanodiamond with blood components and with other biological objects during graduate school. She currently works in Neihu Technology Park, Taiwan. Pei-Hua Chung received her BSc and MSc degrees in physics from National Dong Hwa University and her PhD degree in biophotonics from King’s College London, United Kingdom, in 2012. She worked for 2 years as a research associate at the Faculty of Life Sciences in the University of Manchester, United Kingdom. She is currently working at National Dong Hwa University. Her research is focused on molecules/nanoparticles interaction with biological samples via fluorescence techniques. Chia-Liang Cheng is a specialist in Raman and infrared spectroscopy. He received his PhD degree from the Department of Physics, University of Oregon, United States (1993), and did postdoctoral research at the University of California, Berkeley, and at the Institute of Atomic and Molecular Sciences, Academia Sinica, Taiwan. Now, he is a professor of physics at the Physics Department, National Dong Hwa University, Taiwan. His interest is in carbon nanostructural materials, especially nanodiamond, and their biomedical applications. |


