|
|
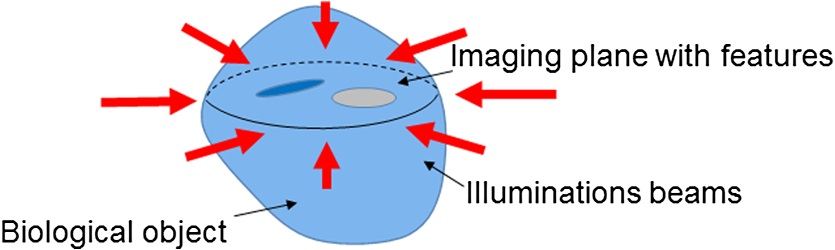
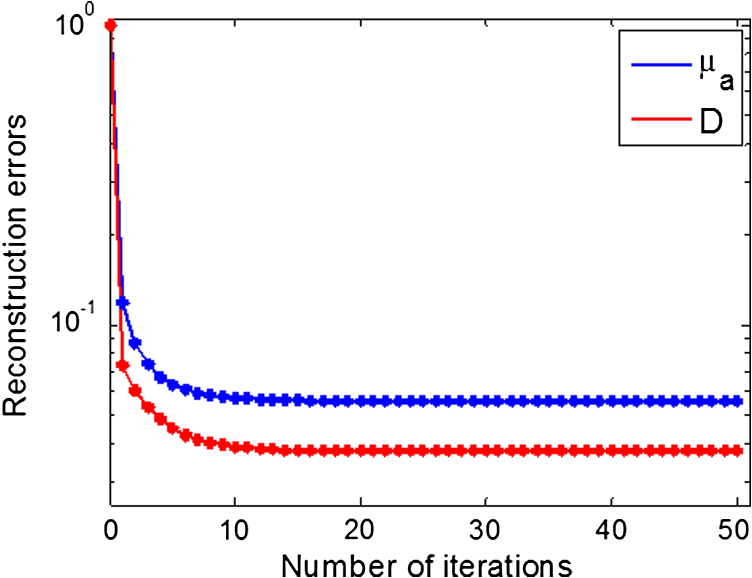
1.IntroductionPhotoacoustic (PA) imaging has been intensively studied recently because of its promise for high resolution and intrinsic optical contrast.1 Efforts have been directed to quantitative estimation of optical properties (absorption coefficient and scattering coefficient ), and the Grüneisen parameter distributions using photoacoustic tomography (PAT), which may significantly enhance clinical and biomedical applications of PA imaging. This is usually termed quantitative photoacoustic tomography (qPAT), which involves two steps. The first step is a well-studied acoustic inverse problem, which aims to reconstruct PA initial pressure distributions using recorded acoustic data generated by a wide field-pulsed laser.2–4 The second step is to estimate optical properties and . This is essentially a rather challenging optical inverse problem. Quite a number of approaches have been proposed for the second step of qPAT. Studies were first focused on estimation,5–7 and later extended to include scattering.8–10 Multiple-wavelength11,12 or optical sources13–16 were also proposed to mitigate the absorption-scattering nonuniqueness problem. Diffuse optical measurements were also used to estimate in PAT.17,18 A thorough review on qPAT is provided by Cox et al.19 The fixed-point iterative scheme for estimating optical absorption distribution was first proposed by Cox et al.6 With this method, absorption maps are estimated in each iteration and then used to update fluence distributions for the next iteration. With simulations based on a diffusion-based finite-element model, the authors demonstrated that the algorithm converges fast and the absorption distribution could be reconstructed accurately. Jetzfellner et al.20 examined the performance of this scheme with experimental data. With a tissue-mimicking phantom, PA imaging was conducted using circular illumination with a high intensity near-infrared-pulsed laser. The authors argued the iterative method is sensitive to background optical properties and diverges over iterations. Recently, Harrison et al.21 extended the aforementioned iterative method6 to a least-squares fixed-point iterative method for reconstructing absorption maps in multiple-illumination photoacoustic tomography (MIPAT). Instead of using single-optical source, a number of optical illuminations evenly distributed around the subject in the imaging plane are employed in MI-PAT (as is shown in Fig. 1). With the proposed method, convergence of the inversion is significantly improved when multiple illuminations are utilized. This approach does not require inversion of large Jacobian matrices, and it is efficient and stable. However, the aforementioned methods are restricted to the reconstruction of only absorption distributions. In the present paper, we intend to extend our previous work to recover both absorption and scattering perturbation distributions in a known turbid media, which holds a typical value of background scattering in soft tissue. We accomplish this task in an iterative manner. For each iteration, absorption maps are first estimated with the least-squares fixed-point iterative method by Harrison et al.21 The optical fluence distribution is then updated, whereupon the scattering coefficient perturbation distribution is estimated. This procedure is then repeated multiple times until an acceptable error is reached. 2.Method2.1.Light Propagation ModelqPAT is, in essence, inversion of a light transport model. We use the diffusion equation in this paper as the light propagation model. In PA imaging, a pulsed laser is used to excite transient acoustic generation, and the pulse duration is significantly longer than the average random-walk time of photons though the tissue. Therefore, a time-independent form of the equation is usually utilized. For a time-independent point source with strength in an infinite turbid homogeneous medium, the equation has the following form:22 where is the optical fluence and is the photon density source strength. is the absorption coefficient. is the so-called diffusion coefficient, which is defined as . in the above expression is the reduced scattering coefficient, which may be calculated by with the anisotropy . In diffusion theory, scattering is usually described with , or . In this study, we use . To validate the diffusion theory, is required, which is often satisfied in soft tissue at near-infrared wavelengths.2.2.Reconstruction of Absorption DistributionIn MIPAT, the transient initial pressure distribution due to source for a certain optical wavelength is2 With the least-squares fixed-point iterative method,21 absorption at location is estimated by where is the estimated absorption with the ’th iteration and is the updated fluence due to source with the previous absorption map in the ’th iteration. is the reconstructed initial pressure distribution due to source . is a regularization parameter to stabilize the computation.2.3.Reconstruction of the Diffusion Coefficient Perturbation DistributionThe relation between the measured data and is nonlinear, because the optical fluence at location is also a function of local optical properties. However, if we have an estimation of the absorption distribution , the problem is simplified as the contribution of absorption to is known. Equation (2) is rewritten as To linearize the problem, we further decompose the local optical fluence at position as , which is a sum of known homogeneous background fluence () due to known background absorption and scattering properties, and fluence perturbations due to absorption and scattering: and . Equation (4) now becomes In the above equation, the only unknown term is , the fluence perturbation due to scattering diffusion coefficient abnormalities. In this study, an extrapolated boundary condition is used (with zero inward flux).22 We assume that is linearly related to , which limits our study to the linear case such that , and , then we have the following relation based on the first-order Born approximation:14 Here, is Green’s function representing propagation from to . can be estimated from Eq. (5): The integral in Eq. (6) can be discretized as where is a volume element. () is the index of optical sources, whereas is the index of optical fluence locations, with . The elements are grouped together in this way because they could be rasterized into a single index .We write Eq. (7) in a matrix form as where is the Jacobian matrix (), or sensitivity matrix, and is the vector which contains the unknown diffusion coefficient perturbation map to estimate. This is a linearized inverse problem and can be solved with a number of techniques. We use the least-squares minimization with total variation regularization, in the above equation serves as the regularization parameter for inversion. To determine the value of , we use the classic -curve technique to balance the resulting errors in the first and second term.23We propose to repeat this procedure with multiple iterations to accomplish the imaging task until a preset tolerance is reached following the flowchart in Fig. 2. Before entering the iteration loop, we set the initial guess of the absorption as zero. In each iteration, we first update the fluence distribution with the estimated from the last iteration. Then, we reconstruct with the updated flunce distribution, whereupon a new version of optical fluence is generated, based on which absorption is again modified if a tolerance is not yet reached. The iterative reconstruction is repeated until a satisfactory result is reached. There are two types of iterations involved in this algorithm. To distinguish them, we call the repetition of consecutively reconstructing an iteration, and the repetitive steps for estimating the -iteration. 3.SimulationSimulation studies were conducted to examine the performance of the proposed scheme. All simulations were conducted on a region of interest composed of a two-dimensional (2-D) mesh grid system, whose dimension is set to be unless otherwise stated. To mitigate inversion crime, noise was added and the synthetic data were generated on a larger grid system () and down-sampled to with the cubic interpolation for inversion. 16 optical sources were positioned 3-mm backward from the object to validate the diffusion light propagation model. The background optical properties of the object were taken as the physiologically realistic values in biological soft tissue. Absorption and the reduced scattering coefficient are 0.1 and , respectively. We first tested our algorithm with regular overlapping features, as is shown in Fig. 3. Two rectangular features with absorption perturbations (10% on the left and 5% on the right) and diffusion coefficient anomalies (5% on the left and 10% on the right) were positioned in the center of the field-of-view. White noise with a normal distribution corresponding to an average signal-to-noise (SNR) of was added to “reconstructed” PAT images. Figure 3(a) shows the PAT images due to two optical sources located on the top and bottom of the phantom, respectively. For inversion, we use zero as an initial guess for both absorption map and diffusion coefficient distribution. In each iteration, the iteration was conducted for 20 times. Reconstructed results with iteration 1, 2, 10, and 50 are employed to show improvement of estimation as more iterations are involved, as is shown in Fig. 3(b). Fig. 3Reconstruction of optical property distributions with the proposed method using 16 optical sources. (a) Synthetic photoacoustic data (initial pressure distribution) due to two optical sources located on top and bottom of the phantom, respectively. (b) Simulation results with iteration #0 (initial guess), #1, #2, #10, and #50 are shown to demonstrate that reconstruction results are improved with more iterations. Initial values were chosen to be zero for both absorption and diffusion coefficient distributions.  To examine the capability of the method to recover arbitrary features rather than regular shapes, features with both discrete strips with sharp edges and smoothed features were tested, as is shown in Fig. 4. In Fig. 4(a), sharp strip features with 10% absorption and scattering perturbations were reconstructed. We also tested four smoothed absorption perturbations (0.1, 0.09, 0.07, and , respectively) and two diffusion coefficient anomalies (0.0083 and ) with different spatial locations in the background. Synthetic data were generated with an SNR of 30 dB and 20 iterations were used for inversion. Values of the regularization parameter were different for the example to honor the feature characteristics. Fig. 4Reconstruction of sharp (a) and smoothed features (b) with the proposed method after 20 iterations. In (a), anomalies of both absorption and diffusion coefficient was set at 10% of the background value. Perturbations of 10%, 9%, 7%, and 5% of the background absorption, 20% and 10% of the background diffusion coefficient at various locations were used in (b). SNR of synthetic data was 30 dB.  Cross-talk between reconstructed maps of the two parameters is a concern. Artifacts due to diffusion coefficient features may appear in the reconstructed absorption map. Despite the fact that the diffusion coefficient depends on both absorption and scattering: locally, the scattering coefficient dominates the apparent values. If is not correctly reconstructed, the resulting fluence estimation may “contaminate” the reconstructed absorption map. We tried estimating two nonoverlapping features to examine cross-talk between the two properties in the recovered results (Fig. 5) in cases of single and multipleilluminations. Interestingly, whereas no artifacts due to absorption appeared in the reconstructed , we did observe artifacts in the reconstructed absorption map where diffusion perturbations lie in both cases. However, the artifacts are alleviated within several iterations and were finally removed from the results when 16 optical sources were used. This might be because in each iteration, we update the absorption distribution, thus the dependence of on is significantly mitigated and is already negligible before reconstructing the scattering feature. On the other hand, while we estimate absorption maps, the contribution of scattering features brings about artifacts in the recovered . But with more iterations, the optical fluence is updated repeatedly and approaches its true value, therefore, artifacts are removed. It is not surprising that with a single source, a unique solution for estimation is not achieved. This is due to the nonuniqueness problem. Fig. 5Reconstruction with nonoverlapping features to demonstrate capabilities of the algorithm to alleviate cross-talk between absorption and diffusion coefficient. Reconstruction results when using 1 and 16 illuminations are shown. Artifacts appeared in the reconstructed absorption map where diffusion coefficient anomalies locate. But with more iterations involved, the artifacts were removed when multiple-sources were used. 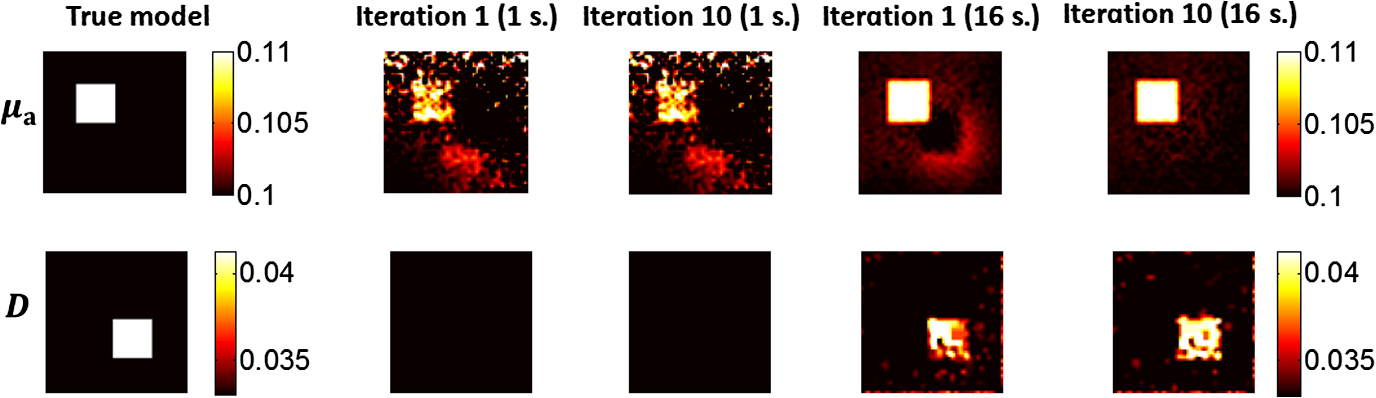 Figure 6 shows the reconstruction of a synthetic phantom with features that shares similarities with blood vessel vasculature using 16 sources. However, we would like to note that the primary purpose of this example is to challenge the inverse problem. The software phantom we used here may not be truly physiological, as certain wavelength bands optical absorption of blood may be too high to use a diffusion approximation. From left to right are the true model, reconstruction results with SNR of infinity (0 noise), and , respectively. We also show the cross-sectional profiles of the corresponding results in the center of the distributions in Fig. 7. With data that has an SNR of , absorption features are faithfully estimated. More artifacts appeared in the results computed with 20-dB data. Fig. 6Reconstruction of a synthetic phantom with features that shares similarities with blood vessel vasculature using 16 sources. The left column is the true model. Second to the last column are reconstruction results with average SNR of infinity (no noise), and . 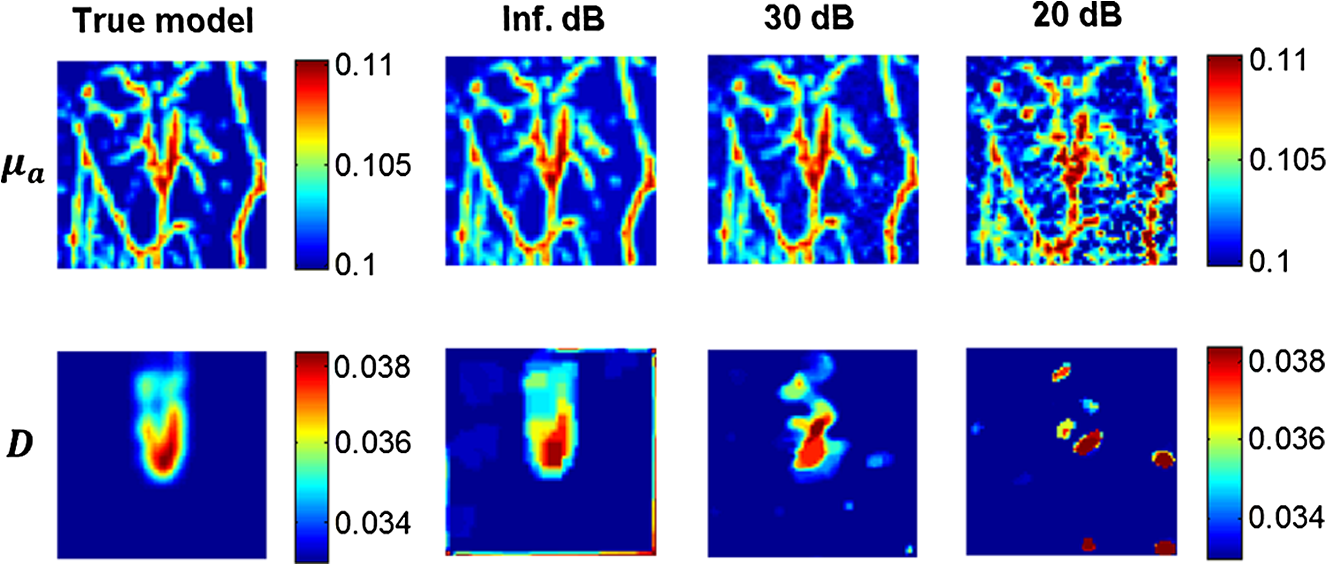 Fig. 7Cross-sectional profiles of the reconstruction results along the horizontal direction in the center of the true model in Fig. 6. All features of were faithfully reconstructed with the data. Artifacts appeared in the reconstruction with data that has an SNR of . Despite some artifacts, features were recovered with a SNR. Amplitude errors were unacceptable for data with SNR.  Figure 8 depicts the relation between reconstruction errors from the last example and the number of optical sources involved. Errors were calculated with the following equation: 20 where and are the intensity of the true model and the reconstructed maps with the ’th iteration. The algorithm converges in the first few iterations and remains stable even with a large number of iterations. The number of optical sources matters for reconstruction quality. With more illuminations utilized reconstruction errors for both decreased immediately. But benefits more and reconstruction errors drop more significantly. Considering that is usually better resolved than the scattering features in qPAT,24 this suggests that a multiple illumination pattern does yield a higher reconstruction quality by providing more information. We used 16 optical sources for studies in previous examples as it yields faithful results.Fast convergence was seen as a remarkable advantage of the least-squares fixed-point MIPAT approach.21 We plot the relative errors of reconstruction in Fig. 9 as an illustration of the overall convergence ability of the proposed scheme. Reconstruction errors decrease quickly and stabilize within the first 10 iterations. 4.Conclusion and DiscussionWe have proposed a consecutive reconstruction scheme to estimate optical absorption and diffusion coefficient perturbation distributions in a known turbid medium for MIPAT. With this approach, the absorption map is first estimated, whereupon the optical fluence is updated and then the diffusion coefficient distribution is reconstructed. The absorption distribution is recovered with a least-squares fixed-point iterative method. Numerical simulations demonstrated that both optical properties can be faithfully reconstructed with the presence of noise at an SNR level of . This method converges within only a number of iterations and is robust to cross-talk of overlapping and nonoverlapping features. Conventional iterative methods for qPAT suffer from computational complexity, instability, and poor convergence performance. The least-squares fixed-point iterative methods21 to recover absorption in our previous report does not require inversion of large scale Hessian or Jacobian matrices, therefore, it is computationally efficient and stable. The reconstruction can be done on a resolution scale equivalent to the fine resolution obtainable by backprojection or other model-based inversion approaches. Convergence is substantially improved. These advantages enable the faithfully estimated absorption to serve as a compulsory guide for each iteration in the current method. Updated fluence estimate based on the reconstructed absorption map assisted accurate estimation of the scattering features. We did not study convergence of the algorithm with a much greater scattering background as described in Ref. 20 as we restrict our study to the scope of realistic biological soft tissue. Although various approaches have been proposed for quantitative reconstructions of optical distributions, most previous approaches were not sufficiently tolerant to realistic noise levels. Prior to experimental work, we argue it is essential to develop imaging strategies and algorithms for sufficient noise-robustness. In this manuscript, we demonstrate the ability to reconstruct both absorption and scattering distributions with realistic noise levels. Our study has limitations. The result in this paper is based on the approximate 2-D light propagation model in the diffuse regime. Although many studies used the diffuse approximation for qPAT, the radiative transfer equation 24 provides a better estimation. It is worth trying to extend our current study to more accurate theoretical models. Similar to most of the literature on this topic, we also assume ideal reconstruction of the PA images from measured acoustic data. Although one option to avoid this is to use the ultrasonic channel data as proposed by our previous report,16 one can also follow the framework by Saratoon et al.25 to include acoustic reconstruction to study its influence on the final reconstruction results. Reconstruction of the scattering distributions still requires matrix inversion, as do all other diffuse optical tomographic (DOT) methods thus far. The matrix condition number is comparable with previous DOT/PAT approaches and the reconstruction can be done on a courser scale to accommodate regularization (data not shown). Resolution of scattering distributions may need to be courser than for estimated absorption distributions, which can be reconstructed with a resolution as fine as the transducers and algorithms will permit. We utilized this method as a preliminary example. We partially committed the “inverse crime” in this paper, which refers to the act to generate as well as to invert synthetic data with the same theoretical model or discretization. Since we use the same theoretical model for both the forward and inverse problems, we (1) generated synthetic data on a larger grid system (with an odd-number of grid) and then down-sampled the dataset with a smaller system (even number of grid points) for inversion; (2) added white noise with a normal distribution to all experimental data to mitigate this issue. Extension of our simulation work to experiments is planned as future work. As a preliminary work, recently we have reported a reflection-mode PA technique that can be used for optical sensing.26 Our method requires inversion of the Jacobian matrix for estimation of the diffuse coefficient. Demand for computation resources increase significantly with Jacobian-matrix-based methods, including both memory and operation count,25 therefore computation expense is a concern for the present framework. For example, despite the quick convergence of our method within only a few iterations, the computation time taken for each iteration with an grid system is with MATLAB 2010b (Mathworks Inc.) on a 64-bit 2.5-GHz Intel i5 PC system. The main contribution of this paper is the demonstration of the potential to recover not only absorption but also scattering distributions with MIPAT, and to provide an algorithm with promising stability in moderately challenging noise. The study is meant to motivate experimental realization, which, however, is yet to be determined and optimized. Future work should aim to develop experimental embodiments of MIPAT and may require calibrating detected signals to known absorbed energy distributions, accounting for three-dimensional rather than 2-D light and sound propagations, acoustic attenuation, and transducer spatio-temporal impulse responses, among other factors. If future experimental embodiments are successful, our approach could provide reconstruction of both absorption and scattering distributions in living subjects. Although DOT can provide such information, it does so at course resolution scales with poor depth-to-resolution ratios. MIPAT has the potential to quantitatively reconstruct absorption distributions with ultrasonic spatial resolution. The recovery of scattering information requires matrix inversions similar to DOT and spatial resolution may be ultimately limited by SNR and the requirement of using regularization. The present study may potentially lead to improved functional imaging, ability to visualize cancers and aid in tumor margin assessment (which often have enlarged cell nuclei and hence higher scattering coefficients). The improved quantitation could also lead to more confident mutliwavelength demixing for oxygen saturation estimation, and estimation of contrast agents or genetically encoded reporter distributions. AcknowledgmentsWe gratefully acknowledge funding from NSERC (355544-2008 (3753)40-2009, STPGP 396444, RGPIN 355544), Terry-Fox Foundation and the Canadian Cancer Society (TFF 019237, TFF 019240, CCS 2011-700718, CCS 702032), the Alberta Cancer Research Institute (ACB 23728), Prostate Cancer Canada (PCC MVBRDG D2013-40), Alberta Innovates Health Solutions (AIHS) CRIO Team Grants, the Cardiovascular Medical Research and Education Fund, the Canada Foundation for Innovation, Leaders Opportunity Fund (18472), Alberta Advanced Education and Technology, Small Equipment Grants Program (URSI09007SEG), Microsystems Technology Research Initiative (MSTRI RES0003166), NanoBridge, University of Alberta Startup Funds, and NSERC, Alberta Ingenuity/Alberta Innovates scholarships for graduate students. ReferencesM. XuL. V. Wang,
“Photoacoustic imaging in biomedicine,”
Rev. Sci. Instrum., 77
(4), 041101
(2006). http://dx.doi.org/10.1063/1.2195024 RSINAK 0034-6748 Google Scholar
X. Wanget al.,
“Photoacoustic tomography of biological tissues with high cross-section resolution: reconstruction and experiment,”
Med. Phys., 29
(12), 2799
(2002). http://dx.doi.org/10.1118/1.1521720 MPHYA6 0094-2405 Google Scholar
M. XuL. Wang,
“Universal back-projection algorithm for photoacoustic computed tomography,”
Phys. Rev. E, 71
(1), 016706
(2005). http://dx.doi.org/10.1103/PhysRevE.71.016706 PLEEE8 1063-651X Google Scholar
K. Wanget al.,
“Investigation of iterative image reconstruction in three-dimensional optoacoustic tomography,”
Phys. Med. Biol., 57
(17), 5399
–5423
(2012). http://dx.doi.org/10.1088/0031-9155/57/17/5399 PHMBA7 0031-9155 Google Scholar
Z. GuoS. HuL. V. Wang,
“Calibration-free absolute quantification of optical absorption coefficients using acoustic spectra in 3D photoacoustic microscopy of biological tissue,”
Opt. Lett., 35
(12), 2067
–2069
(2010). http://dx.doi.org/10.1364/OL.35.002067 OPLEDP 0146-9592 Google Scholar
B. T. Coxet al.,
“Two-dimensional quantitative photoacoustic image reconstruction of absorption distribution in scattering media by use of a simple iterative method,”
Appl. Opt., 45
(8), 1866
–1875
(2006). http://dx.doi.org/10.1364/AO.45.001866 Google Scholar
J. RipollV. Ntziachristos,
“Quantitative point source photoacoustic inversion formulas for scattering and absorbing media,”
Phys. Rev. E, 71
(3), 031912
(2005). http://dx.doi.org/10.1103/PhysRevE.71.031912 PLEEE8 1063-651X Google Scholar
Z. YuanH. Jiang,
“Quantitative photoacoustic tomography,”
Philos. Trans. A. Math. Phys. Eng. Sci., 367
(1900), 3043
–3054
(2009). http://dx.doi.org/10.1098/rsta.2009.0083 PTRMAD 1364-503X Google Scholar
G. BalG. Uhlmann,
“Inverse diffusion theory of photoacoustics,”
Inverse Probl., 26
(8), 085010
(2010). http://dx.doi.org/10.1088/0266-5611/26/8/085010 INPEEY 0266-5611 Google Scholar
H. GaoS. OsherH. Zhao,
“Quantitative photoacoustic tomography,”
in Mathematical Modeling in Biomedical Imaging: II. Optical, Ultrasound and Opto-Acoustic Tomographies,
131
–158
(2012). Google Scholar
B. T. CoxS. R. ArridgeP. C. Beard,
“Estimating chromophore distributions from multiwavelength photoacoustic images,”
J. Opt. Soc. Am. A. Opt. Image Sci. Vis., 26
(2), 443
–455
(2009). http://dx.doi.org/10.1364/JOSAA.26.000443 JOAOD6 0740-3232 Google Scholar
G. BalK. Ren,
“On multi-spectral quantitative photoacoustic tomography in diffusive regime,”
Inverse Probl., 28
(2), 025010
(2012). http://dx.doi.org/10.1088/0266-5611/28/2/025010 INPEEY 0266-5611 Google Scholar
R. J. Zemp,
“Quantitative photoacoustic tomography with multiple optical sources,”
Appl. Opt., 49
(18), 3566
–3572
(2010). http://dx.doi.org/10.1364/AO.49.003566 APOPAI 0003-6935 Google Scholar
P. ShaoB. CoxR. J. Zemp,
“Estimating optical absorption, scattering, and Grueneisen distributions with multiple-illumination photoacoustic tomography,”
Appl. Opt., 50
(19), 3145
–3154
(2011). http://dx.doi.org/10.1364/AO.50.003145 APOPAI 0003-6935 Google Scholar
G. BalK. Ren,
“Multi-source quantitative photoacoustic tomography in a diffusive regime,”
Inverse Probl., 27
(7), 075003
(2011). http://dx.doi.org/10.1088/0266-5611/27/7/075003 INPEEY 0266-5611 Google Scholar
P. ShaoT. HarrisonR. J. Zemp,
“Iterative algorithm for multiple illumination photoacoustic tomography (MIPAT) using ultrasound channel data,”
Biomed. Opt. Express, 3
(12), 3240
–3249
(2012). http://dx.doi.org/10.1364/BOE.3.003240 BOEICL 2156-7085 Google Scholar
C. Xuet al.,
“Investigation of a diffuse optical measurements-assisted quantitative photoacoustic tomographic method in reflection geometry,”
J. Biomed. Opt., 17
(6), 061213
(2012). http://dx.doi.org/10.1117/1.JBO.17.6.061213 JBOPFO 1083-3668 Google Scholar
L. Yinet al.,
“Tomographic imaging of absolute optical absorption coefficient in turbid media using combined photoacoustic and diffusing light measurements,”
Opt. Lett., 32
(17), 2556
(2007). http://dx.doi.org/10.1364/OL.32.002556 OPLEDP 0146-9592 Google Scholar
B. Coxet al.,
“Quantitative spectroscopic photoacoustic imaging: a review,”
J. Biomed. Opt., 17
(6), 061202
(2012). http://dx.doi.org/10.1117/1.JBO.17.6.061202 JBOPFO 1083-3668 Google Scholar
T. Jetzfellneret al.,
“Performance of iterative optoacoustic tomography with experimental data,”
Appl. Phys. Lett., 95
(1), 013703
(2009). http://dx.doi.org/10.1063/1.3167280 APPLAB 0003-6951 Google Scholar
T. HarrisonP. ShaoR. J. Zemp,
“A least-squares fixed-point iterative algorithm for multiple illumination photoacoustic tomography,”
Biomed. Opt. Express, 4
(10), 2224
–2230
(2013). http://dx.doi.org/10.1364/BOE.4.002224 BOEICL 2156-7085 Google Scholar
L. V. WangH. Wu, Biomedical Optics, Principles and Imaging, Wiley-Interscience, Hoboken, New Jersey
(2007). Google Scholar
P. C. Hansen,
“The L-curve and its use in the numerical treatment of inverse problems,”
in Computational Inverse Problems in Electrocardiology,
119
–142
(2001). Google Scholar
B. T. CoxT. TarvainenS. Arridge,
“Multiple illumination quantitative photoacoustic tomography using transport and diffusion models,”
in Contemporary Mathematics: Tomography and Inverse Transport Theory,
1
–12
(2011). Google Scholar
T. Saratoonet al.,
“A gradient-based method for quantitative photoacoustic tomography using the radiative transfer equation,”
Inverse Probl., 29
(7), 075006
(2013). http://dx.doi.org/10.1088/0266-5611/29/7/075006 INPEEY 0266-5611 Google Scholar
J. C. RanasinghesagaraY. JiangR. J. Zemp,
“Reflection-mode multiple-illumination photoacoustic sensing to estimate optical properties,”
Photoacoustics, 2
(1), 33
–38
(2014). http://dx.doi.org/10.1016/j.pacs.2013.11.004 2213-5979 Google Scholar
BiographyPeng Shao received his PhD in biomedical engineering from the University of Alberta in 2014. Currently he is a postdoctoral research fellow at Harvard Medical School. His research interests include biomedical imaging, image processing, and physiological measurements. Tyler J. Harrison obtained his PhD in electrical and computer engineering in 2014 from the University of Alberta, where he worked on photoacoustic and ultrasound imaging systems and reconstruction techniques. He is currently a postdoctoral fellow at the same institution, working with an industrial partner on developing novel CMUT technologies for medical and automotive applications. Roger J. Zemp is an associate professor of electrical and computer engineering and biomedical engineering at the University of Alberta. He earned his PhD in biomedical engineering at the University of California, Davis, in 2004. His research interests include biomedical optics and biomedical ultrasound. He has authored over 58 journal publications and 117 conference papers or abstracts. |