
|
|
1.IntroductionSkin scarring arises from a wide range of traumatic injuries and can lead to significant physical discomfort, such as pain, itching and reduced mobility,1,2 and psychological problems3 for patients. The severity of these issues, and consequently the degree of treatment required,4 is related to the type and severity of the scar. Normotrophic scars are the least severe, and heal to an appearance very similar to normal skin. Hypertrophic and keloid scars result from a pathological healing response to injury and are likely to present issues for the patient. Evaluation of scar pathology and response to treatment requires longitudinal assessment of scars during their formation and progression. Current clinical assessment techniques, such as the Vancouver Scar Scale, typically involve a medical clinician performing a manual visual-tactile assessment of the scar, and include factors such as scar pigmentation, vascularity, height, and pliability.5 Such assessments are inherently subjective and prone to a high degree of inter-observer variability,5,6 which limits their utility. Excess collagen is a major constituent of scar tissue. The quantity and arrangement of the collagen impacts scar appearance, size, and pliability.7 Normal skin contains abundant collagen in the dermis, organized in a “basket-weave”-like structure of partially parallel collagen fibers.8,9 Normotrophic scars have a slightly increased parallel orientation of the collagen fibers compared to normal skin.9 In hypertrophic scarring, there is an overproduction of collagen, causing the scars to be raised above the normal skin. The collagen fibers are generally thicker, denser,10 and arranged with a marked increase in parallel orientation.9 In keloid scarring, the excessive synthesis of collagen extends beyond the site of the initial wound. As in hypertrophic scarring, the collagen fibers in keloids exhibit a much higher degree of parallel organization than in normal skin.9 Collagen in skin forms fibrils comprising a distinctive triple helix of collagen molecules, and bundles of these fibrils form fibers. The quantity and arrangement of the collagen fibrils affects several optical properties of scar tissue, including its scattering coefficient11 and birefringence. Because of their high aspect ratio, collagen fibrils are birefringent, and the high degree of organization into networks of collagen fibers gives rise to measurable birefringence.12 The degree of birefringence is indicative of the organization of the collagen fibers, potentially providing an indicator of scar structure. Polarization-sensitive optical coherence tomography (PS-OCT)13,14 is a promising technique for in vivo imaging of scar birefringence. PS-OCT is an extension of OCT in which the polarization state, as well as the reflectance of light backscattered from the tissue, is determined. Thus, PS-OCT is sensitive to the phase retardation induced between two orthogonally polarized components of light propagating in the tissue. Birefringent tissue causes a change in the phase retardation with depth, which can be quantified from PS-OCT scans. The birefringence of normal human skin determined by PS-OCT has been shown to vary with body location.15 Previous work on assessing the birefringence of burn-injured skin, using PS-OCT measurements acquired 4 and 6 days post-injury, has shown that skin acutely exhibits lower birefringence because of denaturation of the collagen upon injury.16 This contrast mechanism has also been explored for the determination of the burn depth in animal models of burn injuries.17 As the tissue heals after such injuries, scars are formed in which the collagen is restored or over-produced18 and reorganized, leading to potentially restored or increased birefringence compared to normal skin. We propose that quantification of scar birefringence using PS-OCT has the potential to provide novel insight into collagen organization, and hence scar structure. There are several confounding factors in performing such in vivo measurements; predominantly, the presence of blood vessels. On the one hand, the vascular network is indicative of scar severity and its characterization provides a means of scar assessment.19 On the other hand, the high optical scattering from the moving blood cells causes artifacts in PS-OCT estimates of scar birefringence. This is particularly pronounced in pathological scarring, where there is generally a proliferation of blood vessels, giving the scar a red appearance. These blood vessels are interspersed in the collagen matrix and strong scattering from the flowing blood cells corrupts the polarization measurements of the static tissue beneath the vessels, thereby confounding the quantification of birefringence. While averaging may reduce the impact of small blood vessels, many pathological scars are permeated by larger blood vessels,19 requiring more sophisticated techniques to mitigate their impact on the measured birefringence. In this study, we investigate the assessment of human scars using the magnitude of birefringence determined by three-dimensional (3-D) PS-OCT. To enable accurate quantification of the birefringence, we first identify the blood vessels using a speckle decorrelation method,19 and mask them from the PS-OCT scans. We then automatically quantify the rate of change of phase retardation with depth in the remaining vascular-free data, and use this to generate an en face parametric image of birefringence. We demonstrate our assessment method on 13 clinically assessed scars compared against the contralateral or adjacent normal skin of the same patients in vivo. 2.Materials and Methods2.1.Polarization-Sensitive Optical Coherence Tomography ScanningPS-OCT scanning on scar patients was performed in vivo using a portable, fiber-based, swept-source PS-OCT system (PSOCT-1300, Thorlabs, Newton, New Jersey) with a central wavelength of 1325 nm and a spectral bandwidth of 100 nm. The system illuminates the sample using a single incident polarization state, and detects the phase retardation, induced by the sample, between two orthogonal, linearly polarized components of the backscattered light. The system has a measured axial and transverse resolution (full-width at half-maximum irradiance) of, respectively, (in air) and . The scan lens in the sample arm has a working distance of 25 mm that enables a custom imaging interface to be placed between the imaging probe and the skin to account for the effects of motion and refractive index mismatch.20,21 The imaging interface comprises a probe spacer and a ring plate, which rigidly affixes the imaging probe to the skin, and provides an improved probe-to-skin coupling over our group’s earlier design.20,21 The imaging probe with its probe spacer was mounted onto an articulating arm, as shown in Fig. 1(a). The ring plate in Fig. 1(a) was first firmly attached to the skin using double-sided adhesive tape. The ring plate was fitted into the groove in the spacer, as shown in Figs. 1(a) and 1(b), and attached to the spacer with locking screws. Figure 1(c) shows a sketch of the imaging probe-skin interface corresponding to the region in Fig. 1(b) delineated by a dashed blue rectangle. A thin metal plate ( with a central round hole of 3-mm diameter) was aligned with the center of the ring plate and also attached to the skin, acting as a fiducial marker to correct for residual bulk motion, as previously described.20 Ultrasound gel was used as the index-matching medium to reduce imaging artifacts and to improve coupling of light into and out of the tissue.21 Fig. 1PS-OCT imaging interface for coupling the imaging probe and the skin. (a) and (b) Photographs of the imaging interface before and after coupling the imaging probe and the skin. (c) A magnified sketch of the probe spacer and ring plate, corresponding to the region in (b) delineated by the dashed blue rectangle.  The clinical scanning protocol was approved by the Human Research Ethics Committee of Royal Perth Hospital (Perth, Western Australia) and The University of Western Australia. 13 scar patients (aged 18 to 80 years; 7 hypertrophic burn scars, 1 hypertrophic surgical scar, and 5 normotrophic burn scars) undergoing follow-up examinations were recruited for this study, with written consent obtained from all patients. For each patient, a region from the scar and a corresponding region of either contralateral or adjacent normal skin were selected for PS-OCT scanning; the adjacent region was chosen if the contralateral region was also scarred. The selected regions were first trimmed of hair with an electric shaver to minimize shadowing artifacts. Each PS-OCT scan was then acquired, with a field of view (FOV) of () in the lateral () directions, and a depth () scan in air of (). Dense sampling was utilized along the slow scanning () axis to minimize the decorrelation between adjacent B-scans of the static tissue. Prior to each scan, the polarization state of the light incident on the sample was manually adjusted by adjusting the polarization controllers in the system, following a standard procedure defined by the manufacturer,22 to maximize the dynamic range of the PS-OCT phase-retardation signal. This is achieved when the polarization is circular or linear at 45 deg to the tissue optic axis. We have assumed that the optic axis within the small FOV is approximately constant. Note that the optic axis is parallel to the collagen fibers.12 In the case of pathological scarring, it has previously been noted that the collagen fibers tend to be largely parallel. For normal skin, the collagen fibers have been shown to generally be orientated along the Langer’s lines (topological lines of tension or cleavage) within the skin.23 2.2.Vascular MaskingOur PS-OCT system illuminates the sample using a single incident polarization state, and records the two orthogonal, linearly polarized components of the complex interferometric signal.14,24,25 The measured signal from every voxel in the data volume can be represented as a real-valued Stokes vector, . The structural OCT signal, contained in the total irradiance component, , was used for the purposes of vascular masking. The vasculature in the imaging volume was first identified by applying a speckle decorrelation method26 to the total irradiance, as previously described.19 In brief, this method calculates the normalized cross-correlation of the total irradiance between each pair of adjacent B-scans to generate a correlation volume. The low correlation (i.e., high decorrelation) regions were identified as blood vessels, since the blood flow causes rapid changes in the OCT speckle and, thus, high decorrelation between B-scans in those regions. A two-dimensional en face maximum intensity projection (MIP) of vasculature was then generated by projecting the highest decorrelation at each lateral location. The projection was computed from the skin surface (automatically identified using a Canny edge detector) to a depth of . A binary vascular mask was formed by thresholding the vasculature MIP image and was used to remove lateral locations containing blood vessels from the calculation of birefringence. We have previously used a similar approach to improve the calculation of the optical attenuation coefficient in burn scars.11 2.3.Birefringence ImagingThe birefringence in the remaining (vascular-free) tissue regions was calculated using an automated algorithm, extending our earlier work,27,28 and is illustrated in Fig. 2(a). PS-OCT detects a fully polarized signal; hence, the polarization state of the complex, interferometric OCT signal is fully described by the normalized, reduced Stokes vector (hereafter, “Stokes vector”), , where , , and are obtained by dividing , , and , respectively, by . To reduce noise, the Stokes vectors were spatially averaged in the plane through convolution with a Gaussian kernel of width equal to twice the resolution of the PS-OCT system. Changes in polarization resulting from the PS-OCT system itself were considered to be lossless (i.e., no polarization-dependent attenuation) and constant during imaging, allowing us to estimate the birefringence of the skin from the rate of change of the phase retardation of the Stokes vectors with depth into the skin.27,29 The original phase retardation with depth, , in radians, between the smoothed reference Stokes vectors at the skin surface, , and at a depth into the skin, , is given by where is the 3-D vector dot product, is the Euclidean norm, and the subscript denotes the discretization of the PS-OCT signal in the dimension.Fig. 2(a) Flow diagram of the birefringence imaging algorithm described in the text. (b) Fitting example 1: the original phase retardation, , is shown in blue, along with the wrapped linear fit to the unwrapped phase retardation, , shown in red, with a MAPD of 27%. (c) Fitting example 2: the original phase retardation, (blue), and the best fit using the two-component, piecewise-linear model (red) with the first component () showing a high value of 0.94 and the second component () showing a low value of 0.37. 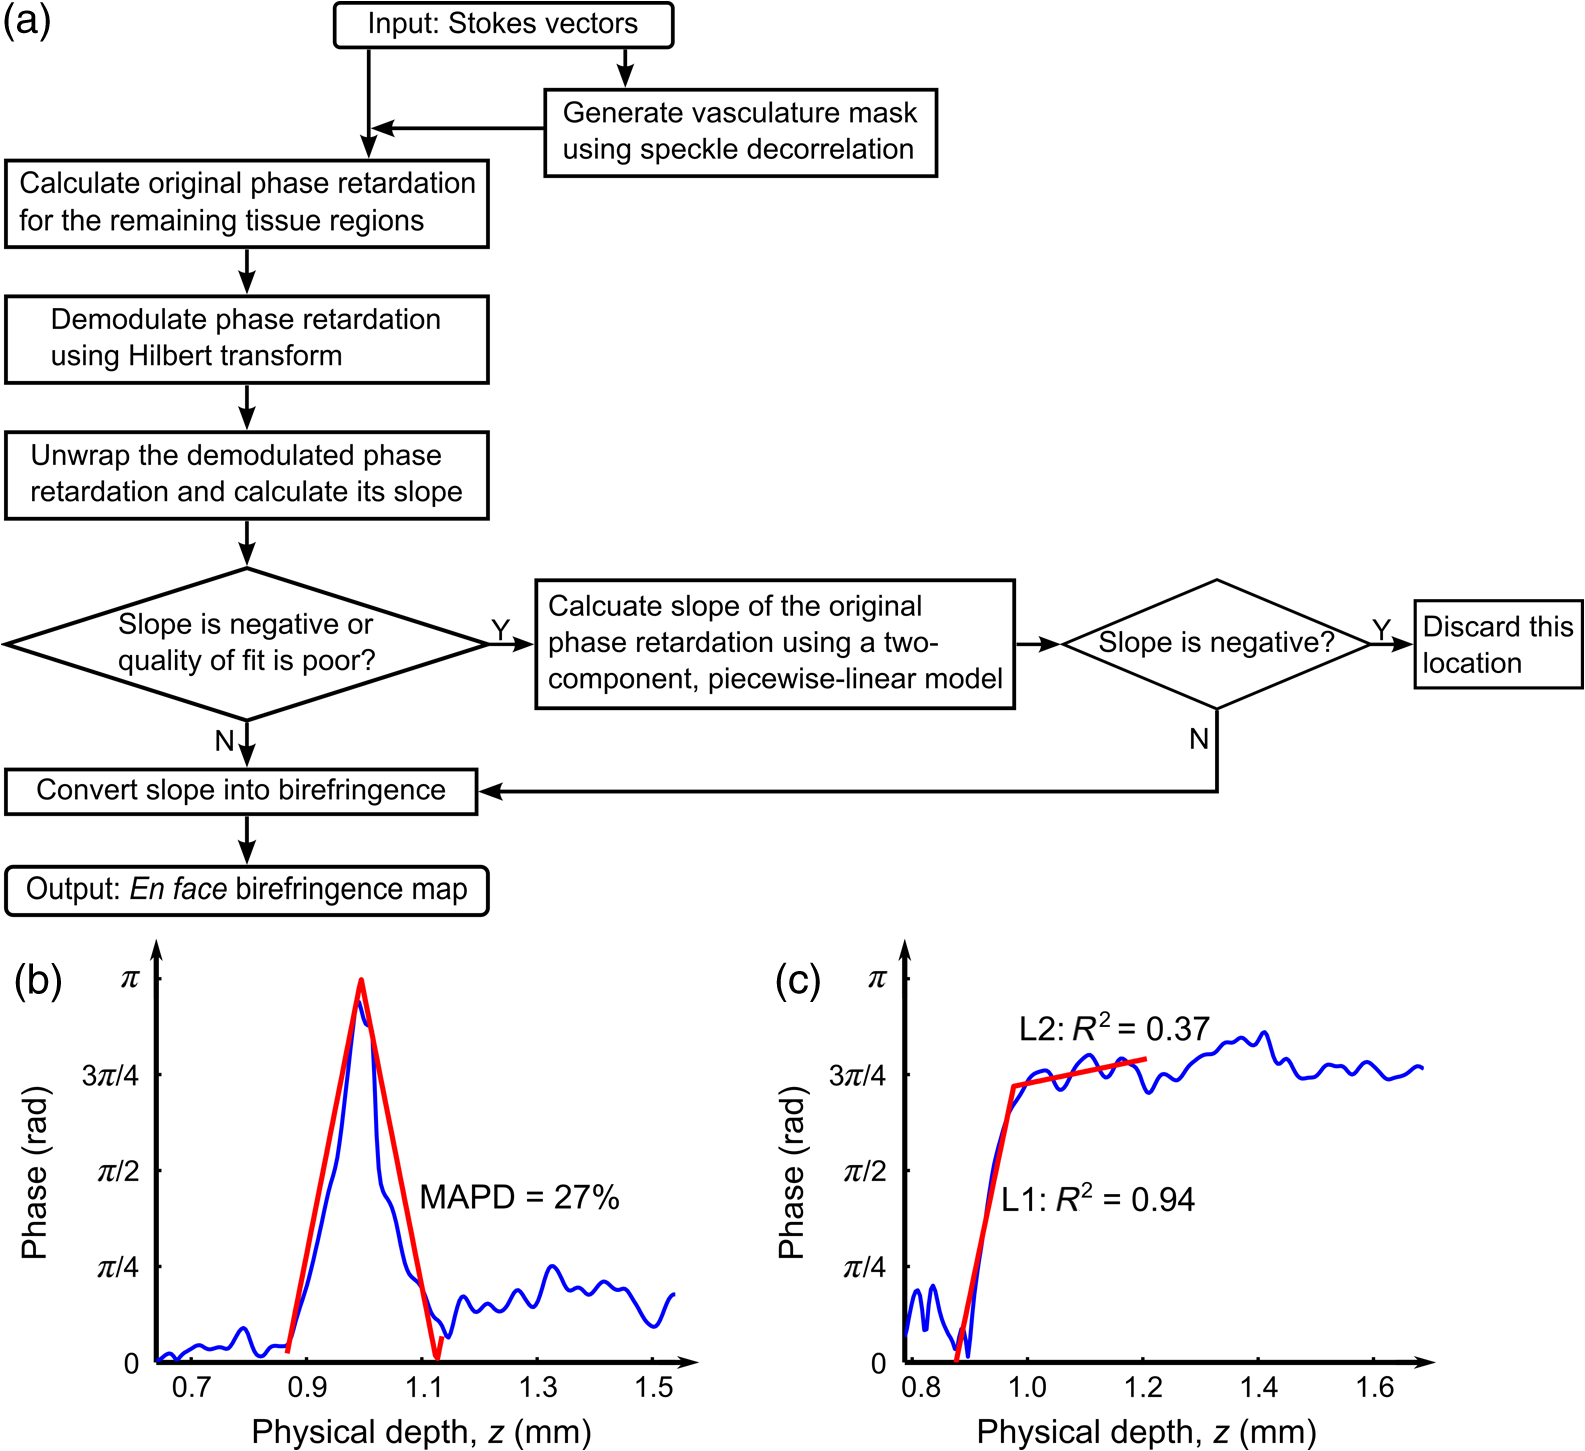 The Hilbert transform, , was used to demodulate to minimize errors resulting from the effects of possible misalignment of the incident polarization, any tissue diattenuation, and possible changes in the orientation of the optic axis with depth into the tissue. This resulted in the wrapped phase, The wrapped phase was unwrapped by considering the difference between successive values, . Phase unwrapping was performed by first identifying the values of for which exceeds a threshold, then interpolating at these locations. The unwrapped phase retardation is then . Weighted least-squares linear regression was used to fit a line, , with constant slope, , to the unwrapped phase retardation over a depth range of ( for one scan due to the limited depth range of its banding pattern) in the dermis (where, for each dataset, a single depth below the tissue surface was chosen as denoting the start of the dermis based on the start of the increasing phase retardation, typically in the range 40–). The weights were the effective OCT signal-to-noise ratio after spatial averaging associated with each phase measurement. To evaluate the goodness of fit of the calculated linear fit to the recorded data, was first wrapped, such that , and the mean absolute percentage deviation (MAPD) of the wrapped fit, , to the original phase retardation, , was calculated as a measure of the fitting error. One such fitting example is shown in Fig. 2(b), where the wrapped fit, (red) has a MAPD value of 27% from the original phase retardation (blue).The calculated line was considered to be a poor fit, and thus rejected, when the MAPD exceeded an empirically chosen threshold (80%), or when the calculated slope of the linear fit was negative. This typically occurred in regions of low birefringence, or in regions showing just the ascending part of a band of phase retardation, possibly caused by axial tissue heterogeneity, or limited imaging depth. In such circumstances, the removal of amplitude modulations using the Hilbert transform failed. We found the amplitude modulations to be minimal here, and recalculated the birefringence without the Hilbert transform. Instead, the original phase retardation, , was modeled using a continuous, two-component, piecewise-linear model. The phase retardation was modeled as linearly increasing over an automatically computed range, and then linearly decreasing over an adjoining range when phase wrapping occurs. The model is specified by: , the slope of the first component; , the offset of the first component; , the -index where the first component ends and the second component begins; and , the slope of the second component. The offset of the second component was constrained to the value of the first component at so that the combined model was continuous. The slope of each linear component, and the point at which the model transitioned from the first to the second linear component were automatically calculated so as to minimize the weighted least-squares difference of the model to the phase retardation, . The fitting example shown in Fig. 2(c), shows the optimized fit (red) to the original phase retardation (blue) with an value of 0.94 for the first component (). The derivative of the first linear function, , was used as the estimate of the rate of phase retardation for the skin. If this value was also negative, then this location was discarded as being unable to provide a reasonable estimate of birefringence. The birefringence, , was then calculated from the rate of change of the fitted phase retardation, , which was equal to either (using the Hilbert transform) or (using the two-component, piecewise-linear model) based on the above criteria, as where RI is the refractive index of tissue, which, in this study, is assumed to be 1.4330 and is the central wavelength of the PS-OCT light source. In Sec. 3, we graphically represent the birefringence as an en face parametric image, where the pixel value at each lateral location in the image is defined by the measured birefringence. The masked vascular areas are represented as black and the areas where the rate of phase retardation could not reliably be computed as white. The normalized distribution of the birefringence was also quantified and compared between the scar and the contralateral or adjacent normal skin tissue.3.ResultsIn this section, we present representative examples of birefringence imaging from two hypertrophic scars and one normotrophic scar. The measured scar birefringence from all patients is then aggregated by scar type, and the results highlight a correspondence between scar type and measured birefringence. 3.1.Birefringence Imaging Across a Scar-Normal Skin BoundaryThe birefringence in the vicinity of the boundary of a 3-year-old hypertrophic scar on the outer right upper arm of a 32-year-old male Caucasian patient is shown in Fig. 3. Figure 3(a) is a photograph of the hypertrophic scar, which appears raised and slightly redder than the surrounding normal skin. The scanning region is at the center of the area delineated in blue, which marks the outline of the metal fiducial marker. The scar boundary lies within the scanning region and is indicated by the dashed line (black). A representative cross-sectional (B-scan) phase retardation image across the scar boundary [in the position and orientation given by the arrow in Fig. 3(a)] is shown in Fig. 3(b). The contrast in birefringence between the scar and the normal skin region is qualitatively visualized in Fig. 3(b), in which the banding pattern is clearer and denser in the case of the scar tissue (right). Fig. 3Birefringence and vascular imaging across a hypertrophic scar boundary. (a) Photograph of the scar with the portion of the scar boundary included in the PS-OCT scan indicated by the dashed line. (b) A cross-sectional phase retardation image across the scar boundary from the position and orientation shown by the arrow in (a). (c) En face birefringence map without masking the blood vessels, which are shown by the vasculature MIP in (d). The two long arrows in (c) label the position of (b). Several representative vasculature-induced low-birefringence artifacts in the birefringence map are highlighted by the short black arrows in (c) and correlated with the presence of vasculature (white arrows) in (d). The dashed lines in (c) and (d) identify the same scar boundary as shown by the short dashed line in (a). Scale bars: 0.5 mm. 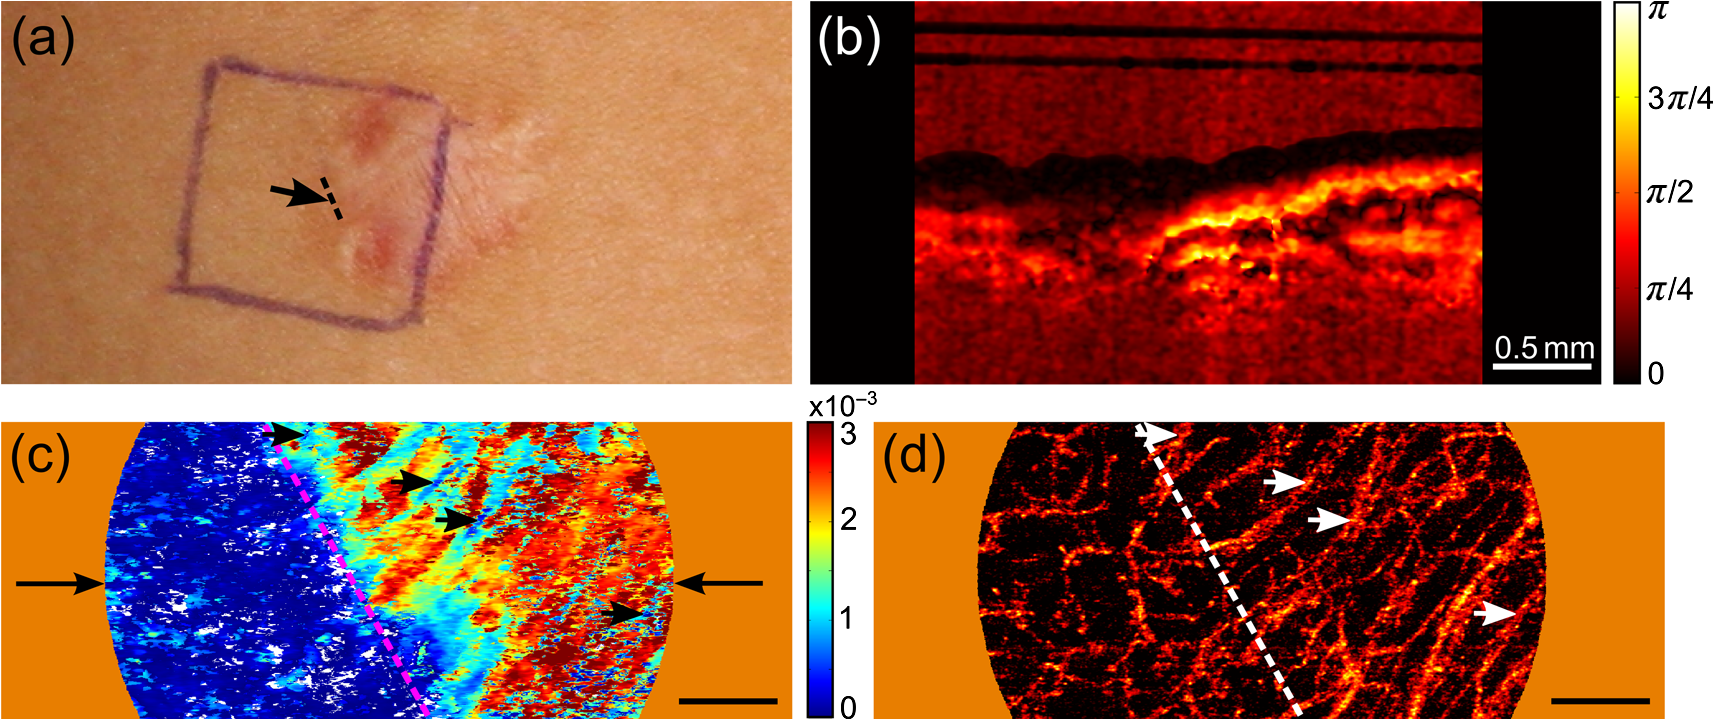 An en face birefringence image calculated without vascular masking is shown in Fig. 3(c). The scar boundary is marked by the purple dashed line. Long arrows mark the location of the phase-retardation B-scan [Fig. 3(b)]. The normal skin at this scanning location mainly shows low birefringence (dark blue) with some local variation. In contrast, the scar region is characterized by much higher birefringence (cyan, yellow, and red) possibly due to the overgrowth of more organized collagen in the visibly raised hypertrophic scar tissue. The scar region, to the right of the whited dashed line marking the scar boundary in Fig. 3(d), also reveals a more prolific network of blood vessels than in the normal skin, in agreement with the results found in a previous study.19 Short arrows in Fig. 3(d) mark several representative blood vessels, which appear as low-birefringence artifacts (short black arrows) in the birefringence map [Fig. 3(c)]. Although phase retardation was smoothed through averaging the Stokes vectors with a Gaussian kernel prior to the birefringence calculation, the confounding effect of blood vessels is still apparent in these regions. The vascular masking method, which identifies and removes these artifacts from the birefringence image, was thus applied in all subsequent analyses to enable more accurate quantification of scar birefringence. 3.2.Birefringence Imaging of a Hypertrophic ScarFigure 4 shows the birefringence images from a 1-year-old hypertrophic scar on a 59-year-old female patient, which was caused by a fire burn injury. A region of the scar on the outer left forearm, located at the center of the left-hand side blue outline in Fig. 4(a), and the adjacent normal skin (located more proximally, on the right of the photo) were selected for PS-OCT scanning. Compared to the normal skin vasculature MIP in Fig. 4(b), the scar region shows a prolific collection of large blood vessels with a complex pattern, visualized in Fig. 4(c). This feature in the underlying scar tissue is not easily discernible through scar assessment by clinical observation, as the scanned scar and normal skin regions are similar in color. Birefringence images of both normal skin [Fig. 4(d)] and scar [Fig. 4(e)] are shown, with areas of vasculature masked in black. It is evident that the scar region is characterized by higher birefringence (red) than the normal skin (cyan). The normalized distributions of birefringence in the vasculature-masked regions are shown in Fig. 4(f) (histogram bin size: ) where the median (lower quartile, upper quartile) value in the scar region is , compared to in the normal skin. The scar birefringence distribution (red) demonstrates a clear contrast from that of normal skin (green) with its median value being more than twice that of normal skin. Fig. 4Birefringence and vascular imaging of a hypertrophic scar and adjacent normal skin. (a) Photograph. (b) and (c) Vasculature MIPs of the normal skin and scar, respectively. (d) and (e) En face birefringence maps of the normal skin and scar, respectively. (f) Histogram of birefringence for the normal skin (green) and scar (red). Scale bars: 0.5 mm.  3.3.Birefringence Imaging of a Normotrophic ScarThe birefringence images from a 1-year-old normotrophic scar on the left side of the back of a 28-year-old male Caucasian patient are shown in Fig. 5. Figures 5(a) and 5(b) are photographs of, respectively, the contralateral normal skin and scar, with the scanning FOV centered within each blue square outline. The scar in Fig. 5(b) was caused by scalding (boiling water and hot coals) and shows a similar appearance to the normal skin in Fig. 5(a), although there is slight hypopigmentation. The vasculature MIPs shown in Figs. 5(c) and 5(d) indicate a similar pattern of blood vessels. The birefringence maps in Figs. 5(e) and 5(f) of, respectively, the normal skin and scar tissue, are comparable, although the normal skin has some local areas of high birefringence (yellow and red). Quantification of the birefringence in Fig. 5(g) also shows a similar distribution (histogram bin size: ) of values for both scar (red) and normal skin (green). The median (lower quartile, upper quartile) scar birefringence is , which is comparable to the value of in the normal skin, suggesting the amount of collagen and its organization in the scar approach that of the normal skin tissue. These results are consistent with the very similar appearance of the scar and normal skin apparent in Fig. 5. Fig. 5Birefringence and vascular imaging of a normotrophic scar and contralateral normal skin. (a) and (b) Photographs of the contralateral normal skin and scar, respectively. (c) and (d) Vasculature MIPs of the normal skin and scar, respectively. (e) and (f) En face birefringence maps of the normal skin and scar, respectively. (g) Histogram of birefringence for the normal skin (green) and scar (red). Scale bars: 0.5 mm.  3.4.Birefringence of Scars by Type from All PatientsThe results of birefringence measurements on all 13 patients included in this study are shown in Fig. 6 as the ratio of the thresholded birefringence of the scar to the median birefringence of contralateral or adjacent normal skin (). The birefringence of each scanned scar and normal skin region is thresholded at , which is the estimated minimum reliable birefringence detected by our algorithm. The birefringence of the scar is then normalized to the median birefringence of the corresponding normal skin for each patient. The median, lower, and upper quartiles of the normalized scar birefringence are shown by, respectively, the markers (triangles and circles) and bars. The of the median birefringence ratio for each scar type (normotrophic and hypertrophic) is also shown in Fig. 6. The hypertrophic scars () show the highest birefringence, times that of contralateral or adjacent normal skin tissue (); whereas, the normotrophic scars () have a much lower birefringence, times that of normal skin (). The median birefringence ratio of hypertrophic scars to normal skin was found to be statistically different from the median birefringence ratio of normotrophic scars to normal skin (Student’s test, ). Fig. 6Ratio of thresholded birefringence for normotrophic and hypertrophic scars to the median birefringence of normal skin from 13 scars. Error bars indicate the upper and lower quartiles. The written values represent the of the median birefringence ratio for the normotrophic and hypertrophic scars, respectively. The surgical scar is highlighted by the green circle.  4.DiscussionThe results presented in this study demonstrate the feasibility of using PS-OCT, incorporating the automatic masking of the blood vessels, to quantify scar birefringence in vivo and confirm the correlation of birefringence with scar type. Having calculated the median birefringence ratio within each hypertrophic scar relative to normal skin, we find that the mean of this value across all patients is much higher than that of normotrophic scars to normal skin, and the difference was shown to be statistically significant. The increased birefringence observed in hypertrophic scars is most likely due to an increase in the density and parallel organization of collagen over normal skin, as has previously been reported.9,10 Normotrophic scars do not suffer from the overproduction of collagen, but do exhibit collagen fibers with a slightly more ordered organization than normal skin.9 Thus, their birefringence is expected to be slightly higher than that of normal skin, but lower than that of hypertrophic scars, which agrees with the quantified birefringence ratios summarized in Fig. 6. We note that the extracellular matrix in the dermis also contains elastin, which is an additional source of birefringence.31 However, as elastin is much less abundant than collagen in the human dermis,32 we expect its influence to be negligible in this study. In regions rich with collagen, quantification of birefringence may be complicated by the presence of tissue heterogeneity within the depth-fitting window, which can give rise to artifacts. Both normal skin and scars have complex structures with several sources of heterogeneity. We have found the vasculature to be a significant source of artifacts in the quantification of collagen birefringence, particularly in burn scars where neovascularization is prolific. This artifact is largely accounted for by vascular masking. However, some residual, nonvascular artifacts remain, as seen by the artificially low birefringence of a thin vertical streak in the middle lower section of Fig. 5(f). This artifact is caused by shadowing by a short hair still present after trimming. Further postprocessing may be able to remove such artifacts. Another prominent source of artifacts for in vivo PS-OCT scanning is motion, including small involuntary motions due to respiration and heartbeat. Besides image distortion, motion causes artificially high speckle decorrelation even in the static tissue regions,33 and corrupts the blood vessel identification. We found that mechanically coupling the scanning probe and the skin using our imaging interface significantly reduces this effect.34 We observed that smaller geometrical transformations, determined by the use of the fiducial marker, were required to align the 3-D PS-OCT volume compared to a previous version of the imaging interface.19 A fiber-based PS-OCT system enables ready access of the OCT imaging probe to different parts of the body. However, there are a number of sources of potential systematic error. If the optic axis of the tissue is not perpendicular to the light beam, then the tissue birefringence is underestimated. Large misalignment of the incident polarization state of the light beam also impacts the measured birefringence. Additionally, the fiber-based system is potentially affected by the polarization changes induced by the optical fibers, which may confound the measurement of the change of polarization due to sample birefringence. Our algorithm assumes the polarization changes due to the optical fibers in the system are lossless and constant during imaging, and uses the relative angles between the reference Stokes vector at the skin surface and the Stokes vectors with depth into the skin as an estimate of phase retardation in order to eliminate the confounding effect of polarization changes caused by the optical fibers. To satisfy this assumption, we gently attached the optical fiber in the sample arm to the articulating arm to avoid bending or movement of the fiber during scanning. With our scanning protocol and birefringence imaging algorithm, the calculated median birefringence of normal skin ranges from to for various body locations, which is in agreement with previously published values (equivalent to ) measured at wavelength.15 Such large variations in birefringence are consistent with the known variation in the quantity and organization of collagen at different body locations.15 Therefore, it is important to compare the birefringence of the scar with its contralateral or adjacent normal skin as the baseline in order to minimize the influence of this variation. 5.ConclusionsIn this paper, we investigated en face birefringence imaging of human scars, which we expect to be indicative of scar collagen structure. We presented a parametric imaging method, aided by the automatic masking of the confounding blood vessels, for accurate quantification of the scar birefringence. The resulting birefringence from 13 patients, normalized to contralateral or nearby normal skin, showed the highest values for hypertrophic scars and values slightly higher than normal skin for normotrophic scars. The characteristic birefringence of scar tissue highlighted in this study can potentially be used as the basis for an objective scale for scar assessment. When combined with vascular assessment,19 the longitudinal monitoring of scars via PS-OCT may provide a viable new clinically applicable means to assess treatments of burns and other wounds. AcknowledgmentsThe authors thank Martin Villiger at the Wellman Center for Photomedicine, Harvard Medical School and Massachusetts General Hospital, for discussions on PS-OCT, and Sharon Rowe at the Telstra Burns Reconstruction and Rehabilitation Unit, Royal Perth Hospital, for her help in patient management. The authors also thank Dirk Lorenser, Bryden C. Quirk and Brendan F. Kennedy for assistance in designing the OCT imaging interface, and Andreas Redmer for his help as we developed the imaging protocols. We also thank all patients for participating in this study. P. Gong is supported by a joint scholarship from The University of Western Australia and the China Scholarship Council. L. Chin was supported by a Robert and Maude Gledden postgraduate research scholarship from The University of Western Australia. S. Es’haghian is supported by the Scholarship for International Research Fees from The University of Western Australia. Y. M. Liew is supported by Ministry of Higher Education of Malaysia (UM.C/HIR/MOHE/ENG/50) and University of Malaya Research Grant (RP028-14HTM). R. A. McLaughlin was supported by a fellowship from Cancer Council WA, Australia. ReferencesA. BayatD. A. McGroutherM. W. J. Ferguson,
“Skin scarring,”
Brit. Med. J., 326
(7380), 88
–92
(2003). http://dx.doi.org/10.1136/bmj.326.7380.88 BMJOAE 0007-1447 Google Scholar
N. E. E. Van Loeyet al.,
“Itching following burns: epidemiology and predictors,”
Brit. J. Dermatol., 158
(1), 95
–100
(2008). BJDEAZ 1365-2133 Google Scholar
N. E. E. Van LoeyM. J. M. Van Son,
“Psychopathology and psychological problems in patients with burn scars: epidemiology and management,”
Am. J. Clin. Dermatol., 4
(4), 245
–272
(2003). http://dx.doi.org/10.2165/00128071-200304040-00004 1175-0561 Google Scholar
T. A. Mustoeet al.,
“International clinical recommendations on scar management,”
Plast. Reconstr. Surg., 110
(2), 560
–571
(2002). http://dx.doi.org/10.1097/00006534-200208000-00031 PRSUAS 0032-1052 Google Scholar
Z. Tyacket al.,
“A systematic review of the quality of burn scar rating scales for clinical and research use,”
Burns, 38
(1), 6
–18
(2012). http://dx.doi.org/10.1016/j.burns.2011.09.021 BURND8 0305-4179 Google Scholar
P. S. Powerset al.,
“Scar assessment: current problems and future solutions,”
J. Burn Care Rehabil., 20
(1), 54
–60
(1999). http://dx.doi.org/10.1097/00004630-199901001-00011 1559-047X Google Scholar
D. T. Corret al.,
“Biomechanical behavior of scar tissue and uninjured skin in a porcine model,”
Wound Repair Regen., 17
(2), 250
–259
(2009). http://dx.doi.org/10.1111/wrr.2009.17.issue-2 WREREU 1067-1927 Google Scholar
H. A. Linareset al.,
“The histiotypic organization of the hypertrophic scar in humans,”
J. Invest. Dermatol., 59
(4), 323
–331
(1972). http://dx.doi.org/10.1111/jid.1972.59.issue-4 JIDEAE 0022-202X Google Scholar
P. D. H. M. Verhaegenet al.,
“Differences in collagen architecture between keloid, hypertrophic scar, normotrophic scar, and normal skin: an objective histopathological analysis,”
Wound Repair Regen., 17
(5), 649
–656
(2009). http://dx.doi.org/10.1111/wrr.2009.17.issue-5 WREREU 1067-1927 Google Scholar
P. D. Verhaegenet al.,
“Adaptation of the dermal collagen structure of human skin and scar tissue in response to stretch: an experimental study,”
Wound Repair Regen., 20
(5), 658
–666
(2012). http://dx.doi.org/10.1111/wrr.2012.20.issue-5 WREREU 1067-1927 Google Scholar
P. Gonget al.,
“Assessment of human burn scars with optical coherence tomography by imaging the attenuation coefficient of tissue after vascular masking,”
J. Biomed. Opt., 19
(2), 021111
(2014). http://dx.doi.org/10.1117/1.JBO.19.2.021111 JBOPFO 1083-3668 Google Scholar
M. WolmanF. H. Kasten,
“Polarized light microscopy in the study of the molecular structure of collagen and reticulin,”
Histochemistry, 85
(1), 41
–49
(1986). http://dx.doi.org/10.1007/BF00508652 HCMYAL 0301-5564 Google Scholar
J. F. de Boeret al.,
“Two-dimensional birefringence imaging in biological tissue by polarization-sensitive optical coherence tomography,”
Opt. Lett., 22
(12), 934
–936
(1997). http://dx.doi.org/10.1364/OL.22.000934 OPLEDP 0146-9592 Google Scholar
J. F. de BoerT. E. Milner,
“Review of polarization sensitive optical coherence tomography and Stokes vector determination,”
J. Biomed. Opt., 7
(3), 359
–371
(2002). http://dx.doi.org/10.1117/1.1483879 JBOPFO 1083-3668 Google Scholar
M. C. Pierceet al.,
“Birefringence measurements in human skin using polarization-sensitive optical coherence tomography,”
J. Biomed. Opt., 9
(2), 287
–291
(2004). http://dx.doi.org/10.1117/1.1645797 JBOPFO 1083-3668 Google Scholar
K. H. Kimet al.,
“In vivo imaging of human burn injuries with polarization-sensitive optical coherence tomography,”
J. Biomed. Opt., 17
(6), 066012
(2012). http://dx.doi.org/10.1117/1.JBO.17.6.066012 JBOPFO 1083-3668 Google Scholar
S. M. Srinivaset al.,
“Determination of burn depth by polarization-sensitive optical coherence tomography,”
J. Biomed. Opt., 9
(1), 207
–212
(2004). http://dx.doi.org/10.1117/1.1629680 JBOPFO 1083-3668 Google Scholar
D. T. NguyenD. P. OrgillG. F. Murphy,
“The pathophysiologic basis for wound healing and cutaneous regeneration,”
Biomaterials for Treating Skin Loss, 25
–57 Woodhead Publishing Limited, Cambridge, England
(2009). Google Scholar
Y. M. Liewet al.,
“In vivo assessment of human burn scars through automated quantification of vascularity using optical coherence tomography,”
J. Biomed. Opt., 18
(6), 061213
(2013). http://dx.doi.org/10.1117/1.JBO.18.6.061213 JBOPFO 1083-3668 Google Scholar
Y. M. Liewet al.,
“Motion correction of in vivo three-dimensional optical coherence tomography of human skin using a fiducial marker,”
Biomed. Opt. Express, 3
(8), 1774
–1786
(2012). http://dx.doi.org/10.1364/BOE.3.001774 BOEICL 2156-7085 Google Scholar
Y. M. Liewet al.,
“Reduction of image artifacts in three-dimensional optical coherence tomography of skin in vivo,”
J. Biomed. Opt., 16
(11), 116018
(2011). http://dx.doi.org/10.1117/1.3652710 JBOPFO 1083-3668 Google Scholar
Thorlabs, “PSOCT-1300: Polarization Sensitive Swept Source OCT System: User Guide,”
(2014) http://www.thorlabs.hk/thorcat/18100/PSOCT-1300-Manual.pdf November ). 2014). Google Scholar
H. T. Cox,
“The cleavage lines of the skin,”
Brit. J. Surg., 29
(114), 234
–240
(1941). http://dx.doi.org/10.1002/(ISSN)1365-2168 BJSUAM 0007-1323 Google Scholar
S. G. AdieT. R. HillmanD. D. Sampson,
“Detection of multiple scattering in optical coherence tomography using the spatial distribution of Stokes vectors,”
Opt. Express, 15
(26), 18033
–18049
(2007). http://dx.doi.org/10.1364/OE.15.018033 OPEXFF 1094-4087 Google Scholar
N. GhoshI. A. Vitkin,
“Tissue polarimetry: concepts, challenges, applications, and outlook,”
J. Biomed. Opt., 16
(11), 110801
(2011). http://dx.doi.org/10.1117/1.3652896 JBOPFO 1083-3668 Google Scholar
J. EnfieldE. JonathanM. Leahy,
“In vivo imaging of the microcirculation of the volar forearm using correlation mapping optical coherence tomography (cmOCT),”
Biomed. Opt. Express, 2
(5), 1184
–1193
(2011). http://dx.doi.org/10.1364/BOE.2.001184 BOEICL 2156-7085 Google Scholar
L. Chinet al.,
“En face parametric imaging of tissue birefringence using polarization-sensitive optical coherence tomography,”
J. Biomed. Opt., 18
(6), 066005
(2013). http://dx.doi.org/10.1117/1.JBO.18.6.066005 JBOPFO 1083-3668 Google Scholar
X. Yanget al.,
“Quantitative assessment of muscle damage in the mdx mouse model of Duchenne muscular dystrophy using polarization-sensitive optical coherence tomography,”
J. Appl. Physiol., 115
(9), 1393
–1401
(2013). http://dx.doi.org/10.1152/japplphysiol.00265.2013 JAPYAA 0021-8987 Google Scholar
M. C. Pierceet al.,
“Simultaneous intensity, birefringence, and flow measurements with high-speed fiber-based optical coherence tomography,”
Opt. Lett., 27
(17), 1534
–1536
(2002). http://dx.doi.org/10.1364/OL.27.001534 OPLEDP 0146-9592 Google Scholar
T. Gambichleret al.,
“In vivo data of epidermal thickness evaluated by optical coherence tomography: effects of age, gender, skin type, and anatomic site,”
J. Dermatol. Sci., 44
(3), 145
–152
(2006). http://dx.doi.org/10.1016/j.jdermsci.2006.09.008 JDSCEI 0923-1811 Google Scholar
J. Fischer,
“Ultrastructure of elastic fibers as shown by polarization optics after the topo-optical permanganate-bisulfite-toluidine blue (PBT) reaction,”
Acta Histochem., 65
(1), 87
–98
(1979). http://dx.doi.org/10.1016/S0065-1281(79)80037-9 AHISA9 0065-1281 Google Scholar
L. T. SmithK. A. HolbrookP. H. Byers,
“Structure of the dermal matrix during development and in the adult,”
J. Invest. Dermatol., 79 93s
–104s
(1982). http://dx.doi.org/10.1111/jid.1982.79.issue-s1 JIDEAE 0022-202X Google Scholar
C. Blatteret al.,
“In situ structural and microangiographic assessment of human skin lesions with high-speed OCT,”
Biomed. Opt. Express, 3
(10), 2636
–2646
(2012). http://dx.doi.org/10.1364/BOE.3.002636 BOEICL 2156-7085 Google Scholar
K. Königet al.,
“Clinical optical coherence tomography combined with multiphoton tomography of patients with skin diseases,”
J. Biophotonics, 2
(6–7), 389
–397
(2009). http://dx.doi.org/10.1002/jbio.v2:6/7 JBOIBX 1864-063X Google Scholar
BiographyPeijun Gong is a PhD student in the Optical+Biomedical Engineering Laboratory within the School of Electrical, Electronic and Computer Engineering at The University of Western Australia. He received his BS degree in electronic science and technology from Shandong University in 2009. His current research interests include the application of optical coherence tomography to disease assessment, with a focus on assessing tissue birefringence and optical attenuation. Lixin Chin is a PhD student in the Optical+Biomedical Engineering Laboratory within the School of Electrical, Electronic and Computer Engineering at The University of Western Australia. He is working in the areas of polarization-sensitive optical coherence tomography, compression optical coherence elastography, and their applications toward preclinical and clinical assessment of pathology. Shaghayegh Es’haghian is a PhD student in the Optical+Biomedical Engineering Laboratory within the School of Electrical, Electronic and Computer Engineering at The University of Western Australia. She works on in vivo skin assessment techniques using optical coherence tomography and elastography. She graduated with her MS degree in biomedical engineering (bio-electrics) from the University of Tehran in Iran. Working on spatial pattern analysis of brain activity in functional magnetic resonance imaging data, she passed a 6-month research program in 2010 at the University of Rostock in Germany. Yih Miin Liew is a senior lecturer at the Department of Biomedical Engineering, University of Malaya, Malaysia. She completed her PhD in the Optical+Biomedical Engineering Laboratory at The University of Western Australia. Her PhD work was on the clinical application of optical coherence tomography (OCT) for quantitative assessment of burn scars on patients. Apart from quantitative assessment of scarring, her current research includes focuses on the application of magnetic resonance imaging, intravascular OCT, and echocardiography for clinical diagnosis and treatment of cardiac diseases. Fiona M. Wood is a plastic and reconstructive surgeon specializing in the field of burn care, trauma, and scar reconstruction. She is the director of the WA Burns Service of Western Australia and the Burn Injury Research Unit UWA. She has built a unique capacity to facilitate direct research collaborations between researchers and practitioners across basic science, clinical care, and clinical outcomes. She has been the recipient of the 2003 Australian Medical Association "Contribution to Medicine" Award and the Medal of the Order of Australia. She received the honor of being named Australian of the Year in 2005. David D. Sampson heads the Optical+Biomedical Engineering Laboratory in the School of Electrical, Electronic and Computer Engineering at The University of Western Australia and is director of the Centre for Microscopy, Characterisation and Analysis, which is The University of Western Australia’s micro-imaging core facility, and a node of the Australian Microscopy and Microanalysis Research Facility and the (Australian) National Imaging Facility. He is a fellow of SPIE and OSA, and senior member of the IEEE. His personal research interests are in optics and photonics applied to medicine and biology. Robert A. McLaughlin is an associate professor at The University of Western Australia. After 3 years as a postdoctoral researcher at The University of Oxford, he spent 5 years in the medical imaging industry, developing several products to commercial release. He returned to The University of Western Australia in 2007, where he now leads research into the development of miniaturized fiber-optic probes for cancer imaging, and quantitative techniques for assessment of skin using optical coherence tomography. |


