
|
|
1.IntroductionEmbryonic development is a thoroughly dynamic process, in which a combination of proliferation and programmed death, morphogenetic choreography and individual migrations, genetic programs, and environmental influences intersect to grow a single cell into a living organism. Attempts to understand the interactions of these processes have driven advances in imaging and registration techniques to acquire multiplexed data from a single experiment and to additionally integrate data from multiple experiments in silico.1,2 However, despite recent advances in in toto microscopy, labeling techniques, and image registration, the integration of dynamic gene expression patterns with their resulting morphogenetic programs remains to be demonstrated in a vertebrate model. Toward this goal, we have developed a method for combined lineage mapping and gene expression profiling in zebrafish embryos using ultrashort pulse microscopy (UPM, a combined two-photon fluorescence (2PF)-optical coherence microscopy (OCM) platform using 10 fs pulses) and image registration. The major benefit provided by our approach is the ability to compare genetic lineage maps and domains of active gene expression within a live morphological context. Patterning during embryonic brain development may be a particularly suitable system to address with combined lineage mapping and fate profiling analysis. During segmentation, the divisions of the early brain are marked by the unique expression of genes overlapping at presumptive boundaries that are subsequently refined to abutting domains of gene expression. At the same time, the early brain begins to develop its complex morphological architecture. Thus, at sites where compartment boundaries are positioned, cells must modulate their gene expression profiles and/or their behavior to choose between compartments while also executing a complex morphogenetic program. Consider the extensively studied midbrain-hindbrain boundary (MHB), a conserved secondary organizer responsible for patterning the vertebrate midbrain-hindbrain domain (MHD).3,4 In zebrafish, within the MHD, the midbrain and the anterior hindbrain give rise to the optic tectum and the cerebellum, respectively, each arising from the dramatic growth and reshaping of neuroepithelial tissue and the brain ventricular system on either side of a constricted ring of cells called the isthmus. While the identity of key genes constituting this organizer has been elucidated with gain and loss of function experiments in vivo,5,6 the precise relationships of these genes or their potential role in morphogenesis of the surrounding region have not yet been understood. The homeobox transcription factors otx2 and gbx1, expressed in the anterior and posterior neural plate, respectively, position the MHB during gastrulation.3 At the boundary, otx2 and gbx1 domains initially overlap, but this overlap is subsequently resolved into abutting domains by an unknown mechanism. Shortly after, several genes are activated in the MHD including wnt1 and fgf8a, genes encoding secreted signaling molecules in the presumptive midbrain and hindbrain of the neural plate epithelium, respectively. Like otx2 and gbx1, wnt1 and fgf8a also initially overlap at the MHB.4 By segmentation, within the evolving morphology of the MHD, wnt1 expression has receded to the MHB, becoming confined to a small ring of cells around the neural tube at the posterior limit of the midbrain and a stripe of cells positioned along the dorsal midbrain. fgf8a expression becomes confined to a ring of cells in the anterior hindbrain. As with the otx2/gbx1 overlap, the mechanism responsible for refining the wnt1/fgf8a overlap has not been understood, partly because the predominant technique for studying changes in these gene expression patterns, in situ hybridization (ISH), requires fixation. Thus, with ISH, it cannot be determined if the boundaries are resolved due to (1) cells sorting into brain compartments based on small pre-existing differences in their gene expression profiles, or (2) cells remaining in their original positions but modulating their gene expression profiles, or (3) some combination. Fluorescent protein (FP) reporters, on the other hand, can be used to genetically label and track cell lineages dynamically. Protein reporters are not as reliable as ISH to assess changes in gene expression because of the mismatch between the dynamics of endogenous mRNA transcripts and their reporter protein counterparts. Thus, using such a lineage mapping technique, it would also be difficult to determine how the MHB boundary is resolved. By combining these techniques, however, we can track the spatiotemporal distribution of a genetic lineage up to a point where we desire to examine which subset of the lineage is still actively expressing a gene of interest. In the case of wnt1, if the boundary is resolved by changes in gene expression, we would expect to see reporter fluorescence perduring in cells in the hindbrain that no longer stain positive by ISH for the wnt1 transcript. Alternatively, if the boundary is resolved by cell sorting, then we would expect the movement of fluorescently labeled cells from the hindbrain into the midbrian and thus neither fluorescence nor positive staining by ISH for wnt1 in the anterior hindbrain. To combine lineage mapping and gene expression data, we must image ISH with three-dimensional (3-D) resolution. The enzymatically deposited dark purple NBT/BCIP chromagen remains one of the most robust and widely used visualization methods for ISH in developmental biology laboratories, though typically it is visualized with limited resolution. However, confocal reflectance microscopy has been used to image NBT/BCIP staining in 3-D,7 and a previously unknown red fluorescence of the stain that can be used for high-resolution imaging has also been characterized.8 As OCM, like confocal reflectance microscopy, relies on detecting backscattered light from biological samples,9 we have investigated its potential in combination with 2PF as another useful technique to image NBT/BCIP with 3-D resolution in our approach. Since lineage reporters will be imaged live, but gene expression domains can only be imaged after fixation, integration of these data will require image registration even when they are acquired from the same embryo. Much work has been done to develop registration techniques for various medical imaging modalities10–13 that have been extended to microscopy images14–18 including 3-D images of model organism embryos.19 Specifically, elastic registration techniques20 have been of interest for merging gene expression datasets acquired from different samples to generate virtual models and atlases21–33 and will be useful in our present case to merge datasets obtained from the same sample (lineage map and gene expression domain) under different conditions (live and postfixation).34 The ideal registration tool for this application should be familiar to the biology community, should be open-source, perform registration on 3-D image stacks, and require minimal computational time. One such tool is found in the image processing software package FIJI, an extended version of ImageJ, with a system for review and submission of custom plugins.35 The plugin “Name Landmarks and Register” allows users to easily mark correspondences in two datasets, registers one onto another, and applies an elastic registration algorithm based on thin-plate splines, radial basis functions that model a thin metal sheet.36 To interpolate deformations, chosen landmarks are constrained to perfect correspondence and, away from these landmarks, the transformation minimizes the bending energy of a metal sheet. This approach has the advantage of requiring relatively few landmarks, resulting in tractable computation times. It has been widely applied to register neuroanatomy,30,37,38 and thus should be suitable for registering gene expression data onto live lineage tracing data in the early zebrafish brain. UPM enables our integrated approach to combine lineage mapping and gene expression profiling during brain patterning and morphogenesis by utilizing the broad two-photon power spectrum and short coherence length of 10-fs pulses.39 The broad power spectrum of these pulses, in comparison to conventional wavelength tunable pulses, provides the efficient excitation of cellular autofluorescence (AF) for visualizing brain morphology in both live and ISH processed embryos, allowing for landmarks to be easily identified in both datasets as well as the opportunity to simultaneously multiplex the excitation of multiple FP reporters. The short coherence gate of 10-fs pulses provides high resolution for OCM and thus for imaging gene expression patterns. Due to the high peak power of 10-fs pulses, care should be taken to minimize any potential phototoxic effects (due to photochemical formation of reactive oxygen species or induction of DNA strand breaks, or photothermal heating, for example) in a particular biological system;40 however, it has been shown that for a given two-photon signal, shorter pulse durations result in less photobleaching and phototoxicity.41,42 2.Materials and Methods2.1.Generation and Maintenance of Transgenic Zebrafish Lines, In Situ Hybridization, Mock In Situ Hybridization, and ImmunohistochemistryFish care and maintenance were performed according to standard protocols.43 The stable transgenic line Tg[wnt1:enhanced green fluorescent protein (eGFP)] has been described elsewhere (Lilie et al., in revision). Briefly, a transgene construct was generated with an upstream 110 bp, major evolutionarily conserved44 wnt1 enhancer region driving eGFP expression, and injected into wild-type embryos at the one-cell stage. Parent lines were crossed and the expression patterns of identified founders were compared to endogenous wnt1 expression at bud stage, mid-somitogenesis, and 24-h postfertilization (hpf). The reporter construct recapitulates the spatiotemporal expression of wnt1 within the MHD. ISH was performed as previously described6 using NBT/BCIP (Roche, Indianapolis, Indiana). To minimize morphological distortions, embryos were never dehydrated in methanol for storage. To compare eGFP protein distribution before and after fixation and ISH, embryos were imaged live with our UPM system at 24 hpf and immediately placed in 4% paraformaldehyde at 4°C and left overnight. Embryos were washed in phosphate buffered saline with tween (PTW) for 5 min and, to protect the antigenicity of the eGFP protein against heat denaturation,45 incubated in 150-mM Tris-HCl at pH 9.0 for 5 min and heated to 70°C for 15 min. Embryos were washed again in PTW for 5 min, and mock ISH was performed exactly as a standard ISH but no probe was used. For subsequent immunodetection of eGFP, embryos were blocked in 1% bovine serum albumin (BSA) in PTW for 1 h at room temperature and incubated with rabbit anti-GFP primary antibody (A-11122, Invitrogen, Life Technologies Corporation, Grand Island, New York) overnight at 4°C. Embryos were then washed in PTW for 20 min, blocked again in 1% BSA in PTW for 1 h at room temperature, and incubated with Alexa Fluor 488 goat anti-rabbit secondary antibody (A-11008, Invitrogen) overnight at 4°C. After washing again for 20 min in PTW, embryos were washed for 5 min in phosphate buffered saline (PBS) and reimaged with our UPM system. 2.2.Time-Lapse Two-Photon Fluorescence ImagingFor time-lapse imaging, Tg(wnt1:eGFP) embryos were intercrossed and maintained at 25°C with 0.003% (w/v) phenylthiourea (ptu) to prevent melanization until the 10 somite stage (ss), when they were dechorionated and mounted in a dorsal orientation in 1.2% low melt agarose in a 2 to 3 mm deep well constructed from 1.2% standard agarose using a p200 tip (to allow room for tail growth). During imaging, embryos were maintained at 27°C using a temperature controller (Cole Parmer, Vernon Hills, Illinois) in a feedback loop with a heating pad placed underneath the embryo (Omega, Stamford, Connecticut) and thermocouple (Omega) placed in the embryo medium which contained tricaine and 0.003% (w/v) ptu. Z-stacks were acquired every 30 min at a step size of with a pixel dwell time of using a objective with 1.0 NA (Carl Zeiss, Thornwood, New York) and 40 mW of power (measurement does not account for the agarose embedding the embryos, though rough estimation by placing an agarose layer on a coverslip in front of the power detector suggests an average of 30 mW on the sample). The UPM system has been described elsewhere.46 Briefly, sub-10-fs pulses from a passively mode-locked Ti:Sapphire oscillator (800-nm center wavelength and 133 nm full-width-at-half-maximum) were precompensated with dispersion compensating mirrors (GSM 270, Femtolasers) and coupled by a galvanometer driven scanner (Cambridge Technology, Cambridge, Massachusetts) into an upright microscope (Axioskop2 MAT, Carl Ziess). The beam was directed by a 635-nm short-pass dichroic mirror (Chroma, Bellows Falls, Vermont) through the imaging objective to the sample. AF and eGFP signals were collected through the imaging objective, separated using a 490-nm long-pass dichroic mirror, further discriminated with bandpass filters ( for AF and for eGFP) (Chroma), and detected with photo multiplier tubes (Hammamatsu, Bridgewater, New Jersey). Data acquisition was controlled with custom LabVIEW software (National Instruments, Austin, Texas). 2.3.Two-Photon Fluorescence-Optical Coherence Microscopy ImagingFor 2PF-OCM imaging after ISH, embryos were mounted in agarose the same as for time-lapse imaging except for samples cleared with glycerol, for which a coverslip was placed over the well containing the embryo and coupled to the water immersion objective with PBS. In the 2PF-OCM setup, a 5% beamsplitter introduced in the path of the beam of the UPM system described above created a Michelson interferometer in which the sample and reference beams were recombined, coupled into a single-mode fiber, and sent to a home-built spectrometer that has been previously described47,48 for Fourier domain detection. Z-stacks were acquired with a step size of using a , 0.8 NA objective (Carl Zeiss), and OCM images generated by integrating the fast Fourier transform of the spectral interferogram acquired for each pixel as images were simultaneously rendered en face with 2PF collection. Precompensation of the sub-10-fs pulses was adjusted to account for the beam splitter and objective. 2.4.Image Processing and Coregistration of DatasetsImage stacks () were scaled in FIJI to account for different samplings along the in-plane dimensions versus the axial dimension, so that each voxel was equivalent to . Stacks obtained of the MHD region of developing embryos were rotated in FIJI to an optimal orientation in which the entire dorsoventral axis of the MHB constriction was aligned parallel to the -axis. This standard orientation ensured that the measurements taken from the same embryo over time, or from the same embryo imaged under different conditions, were repeatable. Multichannel and multimodal 3-D renderings were created in V3D, known now as Vaa3D.49,50 The OCM images contained contrast from both the embryonic tissue and the NBT/BCIP stain. To produce images exclusively of gene expression domains marked by the deposition of NBT/BCIP stain from combined 2PF-OCM, we took advantage of the quenching of embryonic tissue AF by the NBT/BCIP precipitate. First, we measured the average value of the signal from the tissue in regions where no NBT/BCIP was expected in both the 2PF and OCM images. We normalized the intensity of tissue in the 2PF image to the intensity of the tissue in the OCM image and subtracted it from the OCM image in order to subtract the contribution from the embryonic tissue and to isolate the NBT/BCIP signal. Since the AF was quenched in regions where NBT/BCIP was deposited, values subtracted from the OCM image were much lower in these regions, additionally enhancing the contrast. Processed post-ISH image stacks of NBT/BCIP-marked gene expression were registered to image stacks of eGFP-marked lineage using the mutual morphological information in each stack from tissue AF with the “Name and Register” plugin in FIJI.35 Global accuracy of registration was evaluated by manually segmenting the neuroepithelium in each transverse section of the 3-D data along the anteroposterior axis, converting these to a black and white binary image, and calculating an overlap coefficient defined as the ratio of the sum of the intersection of the transformed image and the live template image divided by the sum of the live template image. Local accuracy was determined by comparing the alignment of the peaks of eGFP from anti-GFP immunostained embryos after mock ISH registered to live Tg(wnt1:eGFP) embryos along the dorsoventral axis. 3.Results and DiscussionWe combined lineage mapping and gene expression profiling using UPM and image registration to study the formation of the MHB constriction with the approach shown in Fig. 1. We hypothesized that the distinct midbrain and hindbrain compartments are created by the changes in gene expression within lineages at the MHB, as this boundary was previously reported to be lineage restricted by the 5 ss.51 To test this hypothesis, we quantified the dynamics of wnt1 enhancer-driven eGFP signal in the MHD during the segmentation period and registered the end point with subsequent ISH for wnt1 mRNA. We also used 2PF to quantify the effects of fixation and ISH on MHD morphology and the accuracy of registration. We found that this approach provided a good approximation of the 3-D distribution of a particular genetic lineage compared with the subset of the lineage still actively expressing the gene of interest, within the context of live brain morphology and that the subset of the wnt1 lineage found initially in the hindbrain behaved differently depending on its dorsoventral position in the neural tube to sharpen the MHB. Fig. 1Combined lineage mapping and expression profiling. Using combined 2PF-OCM utilizing ultrashort pulses, complementary datasets of the spatial distribution of a genetic fluorescent protein (FP) reporter used as a lineage tracer and regions of active gene expression (mRNA stain) were collected from the same embryo live and after fixation, respectively. Subsequent registration of the data using morphological landmarks from the neuroepithelium autofluorescence (AF) enabled direct comparison of the active and historical gene expression profiles of a particular cell lineage in a live morphological context.  3.1.Midbrain-Hindbrain Domain Morphogenesis and Mapping the wnt1 Lineage with Time-Lapse Two-Photon FluorescenceWe utilized the broad power spectra of 10-fs pulses, compared with those used in conventional 2PF,52 to image the MHD of embryos from mid-somitogenesis to early pharyngula stages in order to capture the dynamics of neuroepithelium morphogenesis and the wnt1 lineage. As a control to measure whether this imaging regimen affected normal development, transgenic and wild-type embryos were imaged under the same conditions and allowed to develop until the swim bladder had inflated at 5 days postfertilization (). No apparent damage was observed, apart from mild edema from extended exposure to tricaine and restricted growth of the tail from embedding in agarose similar to what has been previously reported.53 For combined 2PF-OCM, embryos were immediately fixed after time-lapse imaging. We set the initial time point, at the 10 to 12 ss, when the MHB is morphologically visible, but the neural keel is closed along the anterior-posterior axis [Fig. 2(a), ], and acquired z-stacks with a step size of approximately every half an hour. Figure 2(a) shows three views of this progression, a dorsal section through the center of the neural keel at the MHB, a sagittal section lateral to the midline, and a transverse section at the MHB constriction. The hindbrain ventricle opens first, initiating at the roof plate and extending ventrally, while the neural keel of the midbrain and MHB remains closed [Fig. 2(a), ]. Subsequently, the midbrain vesicle opens while the neural keel/tube remains shut at the MHB constriction [Fig. 2(a), ] until it opens at , and the constriction becomes more pronounced, giving rise to the primordia of the tectum and cerebellum in the midbrain and hindbrain, respectively [Fig. 2(a), ]. This sequence of events is in correspondence with what has been previously reported54 and further demonstrates the viability of embryos imaged with 2PF using sub-10-fs pulses over long periods of time. We also observed the retraction of fine cellular processes during ventricle formation, marked by an arrow in Fig. 2(a) () in both midbrain and hindbrain formations, as has been previously shown.55 Fig. 2wnt1 lineage mapping during morphogenesis using time-lapse 2PF indicates different mechanisms for boundary refinement depending on dorsoventral position in the neuroepithelium. (a) Dorsal, sagittal, and transverse sections of the wnt1 lineage in the developing midbrain-hindbrain domain (MHD) over time. As the midbrain-hindbrain boundary (MHB) forms dividing the midbrain (mb) and hindbrain (hb) primordia, the hindbrain ventricle (hbv) opens first, followed by the midbrain ventricle (mbv) that is subsequently connected by the opening of the isthmus region (asterisk). Cellular processes retract during ventricle formation (arrowhead). By , regions that will develop into the optic tectum and cerebellum are morphologically distinct. Bars indicate that the wnt1 lineage within the neuroepithelium is stationary in the A/P direction. A portion of the wnt1 lineage in the midbrain undergoes epithelial-to-mesenchyme transition at (not shown). . Quantification of reporter fluorescence intensity changes from dorsal (b) and ventral (c) regions of the MHD over time shows steady increase of reporter intensity just anterior to the MHB (0 to ) within the midbrain as well as more anteriorly near the epiphysis (dorsal plot, to ). Intensity within the midbrain and hindbrain slowly (dorsal, asterisk) or sharply (ventral) decreases. 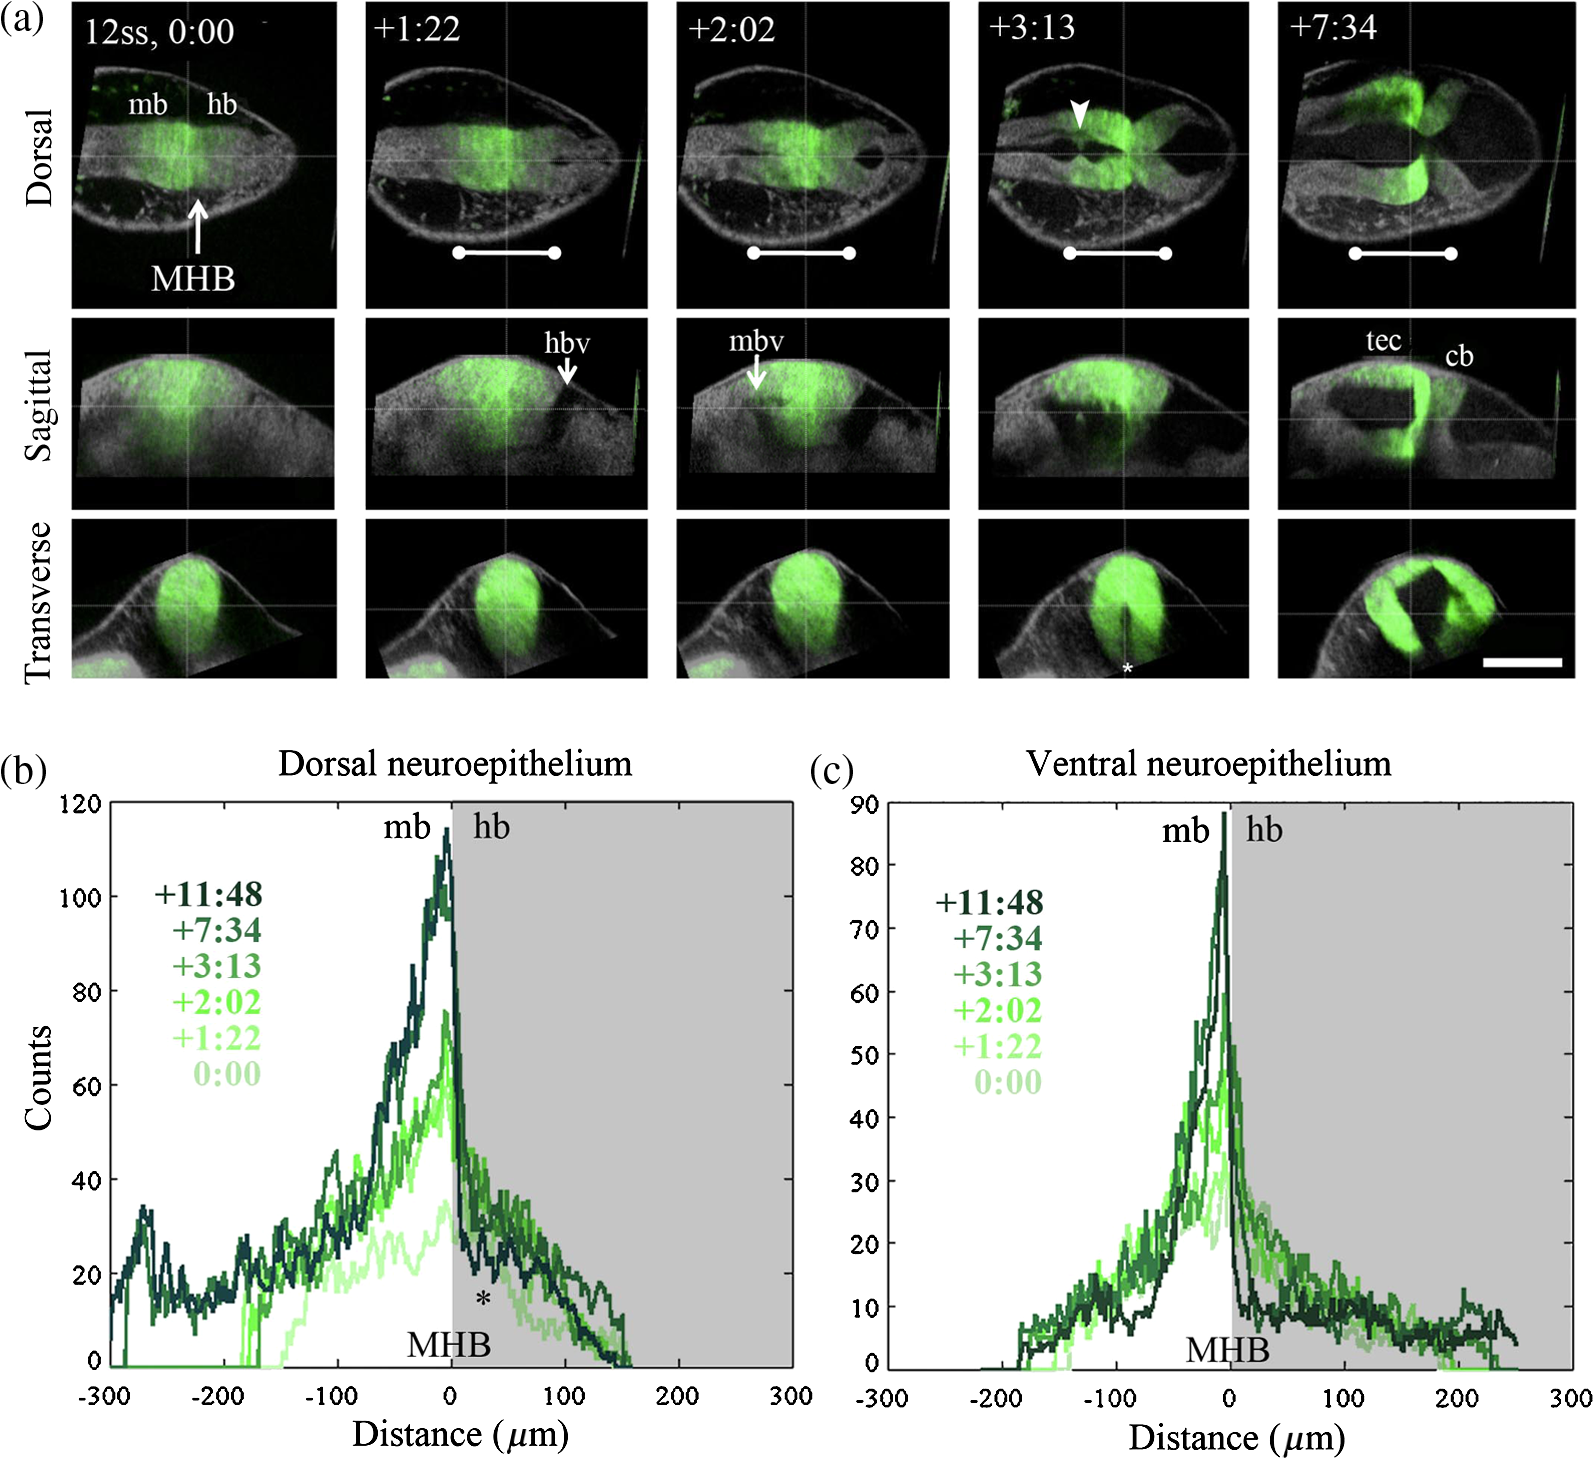 Within this evolving architecture of the embryonic brain, the wnt1 lineage is marked by the expression of a reporter eGFP molecule under the control of a wnt1 enhancer, such that once the wnt1 gene is activated in a cell, that cell and its progeny will remain fluorescent for the lifetime of the eGFP proteins that were generated, even if wnt1 expression ceases. Thus, all cells in the embryo that have expressed wnt1 under the control of this enhancer are marked by eGFP for ,56,57 and we simultaneously followed this lineage throughout somitogenesis. We quantified fluorescence intensity profiles of the wnt1 lineage from the neuroepithelial tissue in dorsal and ventral regions of the embryo using the freehand line tool, allowing us to profile the same tissue over time despite dramatically changing morphology. At , the wnt1 lineage extends into the anterior hindbrain as shown by the position of the bars in Fig. 2(a) and quantitatively in Figs. 2(b) and 2(c). As development progresses, cells in the midbrain just anterior to the sharpening physical constriction build up increasing amounts of eGFP protein regardless of dorsoventral position in the neural tube [ to , Figs. 2(b) and 2(c)]. In the dorsal midbrain neuroepithelium, the lineage proliferates at a higher rate than in nearby tissues,54 possibly contributing the bowing of the developing tectal lobes, as the overall length of this domain increases [Fig. 2(b)] despite its confinement to the same space along the anterior–posterior axis [bars, Fig. 2(a)]. In the anterior of the dorsal midbrain neuroepithelium, reporter intensity increases at the presumptive epiphysis [ to , Fig. 2(b)], a sensory region involved in circadian rhythms. In the dorsal hindbrain neuroepithelium, reporter intensity fluctuates and appears to decrease slightly by 24 hpf [asterisk, 0 to , Fig. 2(b)]. We measured similar dynamics in the ventral midbrain neuroepithelium, however, in the ventral hindbrain neuroepithelium, the reporter fluorescence drops sharply over time [0 to , Fig. 2(c)]. Measurable changes in intensity of reporter fluorescence can be due to the combined behavior of several independent factors. Continuing transcription would contribute to an increase in fluorescence intensity, as can be seen in the wnt1 lineage just anterior to the MHB and in the presumptive epiphysis. In these tissues, we can conclude that wnt1 remains actively expressed if the activity of the native and reporter mRNA transcripts is similar. Unchanging or decreasing reporter intensity is more difficult to interpret. FP degradation, FP photobleaching, or FP redistribution during cell proliferation all would cause a decrease in intensity. Since the rates of these different options are difficult to measure independently, we cannot make definitive conclusions about which cells in the lineage are still actively expressing the gene of interest if the intensity is unchanging or decreasing. With respect to MHB refinement, our results suggest that in the dorsal neuroepithelium, the MHB is refined as a small group of cells continue or increase their rate of transcription of wnt1 while cells away from the boundary reach a steady-state or stop transcription by the end of somitogenesis. In the ventral neuroepithelium, the sharp decline of eGFP signal could indicate cells sorting to sharpen the boundary, as the wnt1 lineage is no longer physically present in the anterior hindbrain to generate the eGFP signal. The ability to see the regions where wnt1 remains actively expressed by imaging wnt1 mRNA distribution would help to distinguish among these possibilities. 3.2.Quantification of Morphological Distortion due to In Situ HybridizationAlthough ISH is a common technique, there has been little work done to quantify how the protocol affects embryo morphology. Fixation is already known to shrink biological tissues,58–61 but how fixation and further processing with ISH may affect tissue morphology, specifically of the early embryonic brain, has not been examined. To quantify the distortions we would need to correct in order to register mRNA transcript data acquired post-ISH to fluorescent reporter protein data acquired from live embryos, we imaged 24 hpf embryos with 2PF at different points in the processing. AF from the neuroepithelium was collected (1) live, (2) postfixation, (3) after ISH, and (4) after optical clearing with glycerol. Qualitative analysis of the images, shown in Fig. 3(a), reveals a dramatic and additive change in brain morphology. Fig. 3Processing for in situ hybridization (ISH) introduces significant morphometric distortions, including longitudinal and radial shrinkages of the tubular neuroepithelium, diminishing of the constriction angle, and ventricle collapse. (a) Dorsal, sagittal, and transverse sections of AF signal from the same embryo imaged with 2PF live, after fixation in 4% paraformaldehyde, after performing mock ISH, and after equilibration in 100% glycerol show striking distortion of early brain morphology at 24 hpf. . (b) Four morphometric parameters were measured from the same individual embryo to quantify significant () contributions of each processing step toward longitudinal and radial tissue shrinkages (A/P distance and midbrain tissue area), disruption of the constriction (MHB angle), and ventricle collapse (midbrain ventricle area). These distortions will need to be corrected to combine the spatial distributions of the live reporter and mRNA for direct comparison.  We selected four parameters to characterize brain morphology deformation within the MHD. A/P distance is the distance from the widest point of the midbrain to the widest point of the hindbrain [Fig. 3(b)] and provides a measure of changes in the anteroposterior aspect of the embryo, which we refer to as longitudinal changes. The MHB angle characterizes the changes in the structure of the constriction, and, as this value changes with depth, it is always measured in the dorsal plane of the sulcus limitans, identified in the transverse section where the midbrain is widest. The midbrain tissue parameter is the cross-sectional area of the tissue in a transverse section at the widest point of the midbrain and is a measure of distortions of the neural tube radially. Finally, the midbrain ventricle parameter is the cross-sectional area of the ventricle in the same transverse section and provides a measure of ventricle collapse. How these parameters change would then inform potential registration strategies. We found that for each of these four parameters, measured using FIJI, each step in the processing produced a significant change, with effects cumulating in 31% average longitudinal shrinkage, 77% increase in the MHB angle, 53% shrinkage in the radial direction, and 79% ventricle collapse. Notable is the significant increase in MHB angle, changing the conformation of the morphologically complex constriction after ISH when compared with live embryos. With this information, we decided to concentrate more registration landmarks near the MHB to compensate for these drastic distortions. We also noted that even though the MHB angle increased, which possibly has the effect of increasing the A/P distance, the overall distance we measured decreased. We considered this might lead us to underestimate the shrinkage in the A/P direction, making it difficult to assess if the embryo shrinks uniformly. For this reason, we did not attempt to scale embryos prior to image registration. In the future, it may be useful to use fiduciary markers, such as GFP-H2B and/or DAPI stained nuclei, to characterize strain fields within the tissue, as has been done in human brains62 and avian embryos,63 to quantify local tissue-dependent differences in the deformations induced by ISH. 3.3.Imaging Domains of Gene Expression with Two-Photon Fluorescence-Optical Coherence MicroscopyTo utilize the robustness of NBT/BCIP staining for analyzing gene expression domains in 3-D, we imaged embryos after performing ISH to detect wnt1 mRNA using combined 2PF-OCM. Using both modalities provides the advantage of simultaneously imaging tissue morphology with gene expression domains. Subsequent image registration may also be simpler with both datasets acquired on the same UPM platform. Figure 4(a) shows the results of imaging wnt1 gene expression domains in zebrafish embryos fixed at 24 hpf that were not optically cleared after ISH. The two-photon excited AF signal is quenched in regions of the embryo where a strong contrast in the OCM image shows the presence of NBT/BCIP (yellow outline) compared with areas where wnt1 is not expected to be expressed, unstained tissue (blue outline). The neuroepithelium, which in the zebrafish embryo at this stage of development is quite transparent, is also visible with OCM. In the resulting overlay, red to yellow indicates the tissue unstained and unquenched by NBT/BCIP, while green regions are where NBT/BCIP is present. Fig. 4Imaging gene expression in the MHD with 2PF-OCM using ultrashort pulses is not enhanced with glycerol optical clearing treatment. (a) Dorsal section from a 24 hpf embryonic brain after ISH to detect wnt1 shows quenched AF and increased backscattering detected by OCM in regions where the NBT/BCIP precipitate is deposited (yellow outlined region). Unstained neuroepithelial tissue generates positive AF and OCM signals (blue outlined region). Combining these images results in brain tissue appearing red to yellow and the precipitate marked regions actively expressing wnt1 to appear green in the midbrain anterior to the MHB constriction. . (b) Signals from embryos treated with or without glycerol after ISH were quantitatively compared. Tissue AF, , significantly increased with glycerol treatment, and to a lesser extent, the intensity ratio from unstained tissue relative to areas of quenching from the precipitate, also increased . Glycerol treatment increased OCM signal from unstained tissue and areas where the precipitate was deposited similarly, resulting in no significant difference in the intensity ratio . When both quenched 2PF and positive OCM signals are combined, , NBT/BCIP can be detected from embryos not treated with glycerol just as well as those that have been cleared, so that the morphological distortions can be minimized.  OCM has been used to image retinal regeneration in adult zebrafish64 and to evaluate the effects of ethanol on embryonic brain development in larval zebrafish.65,66 These tissues are turbid compared with the 24 hpf embryo, and we could only find one report of OCM imaging on 24 hpf zebrafish67 in which the signal seemed comparable with our data, relatively weak, presumably due to the transparency of the embryo. In these cases, OCM provides only structural information about tissue morphology. There have been efforts to use OCM for imaging with molecular contrast such as detecting backscattered light from gold nanoparticles conjugate to antibodies for immunodetection68,69 and using spectral domain detection to look for absorption signatures of specific molecules such as hemoglobin.70 We have added molecular contrast to OCM by imaging NBT/BCIP enzymatically deposited in embryos following immunodetection of gene expression domains with transcript-specific antisense RNA probes containing a digoxegenin epitope. By omitting the clearing step that requires equilibration in glycerol, morphological distortions of the early brain from ISH processing could be drastically reduced. A/P shrinkage, MHB angle relaxation, radial shrinkage, and ventricle collapse could be reduced 14%, 30%, 38%, and 29% respectively, significantly minimizing demands on image registration. Yet optical clearing agents such as glycerol are known to reduce tissue attenuation and improve contrast in OCM on a variety of biological specimens,71–73 including mouse embryos,74 and we considered whether clearing could preferentially improve the signal from the NBT/BCIP precipitate over the neuroepithelium tissue. To determine if there was indeed any benefit to clearing the tissue toward enhancing the NBT/BCIP signal and to decide if that benefit was worth correcting for the additional distortions to the embryo, we performed ISH for wnt1 transcripts on embryos and compared the signals from the ones that were subsequently cleared to those that were not (). Figure 4(b) shows a comparison of the relative potential for NBT/BCIP specific contrast in embryos that were equilibrated in 100% glycerol after ISH and those that were stored in PBS. In agreement with previous reports, tissue AF measured from unstained neuroepithelial tissue in the region outlined in blue, , increased significantly with glycerol treatment.75,76 OCM signal in stained and unstained regions of the embryo both increased significantly (not shown) but not preferentially for unstained tissue as the ratio of the signal from stained versus unstained tissue, , did not change significantly. Clearing did cause a small but significant increase in the ratio of AF in unstained versus stained tissue, , due to decreased signal in the region of the precipitate, possibly because of increased quenching of the signal by NBT/BCIP. When the two modes of contrast were combined (), there was no significant improvement in the cleared embryos. 3.4.Morphological Landmark Registration of Different Datasets from the Same EmbryoAfter quantifying the effects of ISH on tissue morphogenesis and determining that there was no benefit to optically clearing the embryos, we defined landmarks in the late somitogenesis zebrafish MHD for 3-D image registration. Constantly changing morphology made the selection of reliable landmarks nontrivial and since thin-plate spline registration can be computationally costly, it was desirable to minimize the number of landmarks. In studies on the rhesus hippocampus, 10 landmarks were a sufficient number for accurate registration,77 while in prostate samples, 22 landmarks provided sufficient accuracy.78 In Fig. 5, we present a set of 24 landmarks for registration of the zebrafish MHD. Fig. 5Qualitative performance of morphological landmark registration of different datasets from the embryonic zebrafish brain at 24 to 28 hpf. (a) To find the same landmarks in different datasets, points were selected from AF data in the anterior region of the MHD from the widest transverse section of the midbrain, ta, from the narrowest section of the constriction, tm, and posteriorly from the widest section of the hindbrain, tp. (b) From each section, 6 to 11 landmarks can be identified from the distinct morphology introduced by the ventricles and the dorsolateral hinge points of the neural tube and the lobes of the expanding tectum. (c) Overlay of registered transverse sections of live (magenta) and post-ISH (green) datasets, where the distorted morphology is restored onto the live morphology. .  Figure 5(a) shows an X-slice rendering of the 24 hpf MHD imaged live with 2PF. Three transverse planes were readily identifiable during the morphogenesis of the MHD from mid to late somitogenesis within the same embryo imaged over time and from the same embryo imaged under different conditions, ta, for transverse anterior; tm, for transverse middle; and tp, for transverse posterior. ta was the same plane used for quantifying embryo distortions due to ISH, the transverse plane in the midbrain where the neural tube is widest. tm was the narrowest point of the constriction, and tp was the transverse plane in the hindbrain where the neural tube is widest. These transverse sections, shown in Fig. 5(b), provided several obvious choices of morphological landmarks, which we chose to concentrate close to the boundary where deformations between datasets to be registered were predicted to be greatest. We applied thin-plate spline registration in FIJI to register the neuroepithelium of embryos imaged post-ISH to those imaged live, using the AF signal to obtain this mutual information. Figure 5(c) shows an overlay of the live (magenta) and registered post-ISH (green) morphologies and suggests qualitatively that the registration is reasonably accurate. We then sought to quantitatively determine registration accuracy at different scales relevant to the goals of our registration. Analysis of registration accuracy depends highly on the application.79–81 We first evaluated the accuracy of registration of the data at the scale of the tissue to characterize the global accuracy. Figure 6(a) shows the effect of registration on the parameters previously used to characterize the deformations in the MHD due to ISH. In all cases, parameter values matching those for live embryos were recovered with registration. Target registration error82 is a common method to quantify registration accuracy, but it is not suitable for this thin-plate spline implementation since it constrained our landmarks of interest to correspond exactly which would result in zero error unless alternative targets were measured. As we already implemented our most reliably identifiable landmarks (targets) for registration, it seemed more appropriate to use an overlap coefficient, o.c., based on the Dice Similarity Index83–85 that quantifies overlap between objects. Our results, ranging between 0.77 and 0.99 with an average of 0.89, fell within what is clinically considered useful for medical image registration.78,86 Fig. 6Quantitative analysis of the global accuracy of morphological landmark registration. (a) The significant tissue shrinkage and morphological distortions () to brain morphology measured from AF and introduced by ISH can be restored to values matching live morphology using landmark registration. (b) The overlap coefficient, o.c., of binary transverse sections of manually segmented coregistered datasets was calculated to quantify the accuracy of the registration algorithm at the global or tissue level. Accuracy is comparable in both the constraining planes where the landmarks are selected and planes in between.  To address registration accuracy at the level of the gene expression domain, we imaged Tg(wnt1:eGFP) embryos live with 2PF at 24 hpf, subsequently processed them with a mock ISH protocol, immunostained for eGFP, and then reimaged and registered them. Immunostaining for eGFP using fluorescein isothiocyanate for secondary detection was required since the hybridization step in ISH required heating to 76°C which denatured the eGFP protein. With these data, shown in Fig. 7, we compared the lineage boundary of the highest eGFP intensity at the MHB in the template and registered images. Using the same plotting tool that we implemented to trace the dynamics of the eGFP-marked wnt1 lineage, we plotted the live eGFP distribution and post-ISH -GFP distribution from different dorsal planes along the dorsoventral axis. The boundaries coincided within 3.2 to , equivalent to 1 to 5 pixels, with the best performance near the sulcus limitans that corresponds with many of our landmarks. These results suggested that we can register the MHB in 3-D with an accuracy within one to three cells, given the density and orientation of the cells within the neuroepithelium at this stage of development. Fig. 7Qualitative and quantitative analyses of the local accuracy of morphological landmark registration. (a) Dorsal sections at varying depths from coregistered overlay of live eGFP reporter distribution (green) and -eGFP immunostaining postmock-ISH (pink). Outlined yellow lines correspond to normalized intensity plots depicted in (b), which show that the MHB boundary, marked by peak eGFP intensity, can be accurately aligned within one to two cell diameters. .  While our first application of thin-plate spline registration was reasonably accurate, improvements and further quantification of registration accuracy should be considered. If it can be determined that the ISH caused the MHD tissue to shrink uniformly, then scaling the embryos prior to registration could potentially improve accuracy. Also, an affine registration could be implemented prior to nonrigid registration to potentially increase performance, and landmark selection could be automated to remove user error. Optimization of the registration approach should account for accuracy at the cellular scale. For example, morphological landmarks could be used for registration and individual cell positions, marked by H2B-GFP for example, used to calculate target registration error. 3.5.Registration of the wnt1 Lineage and the Subpopulation of the wnt1 Lineage Still Actively Expressing wnt1 in a Live Morphological ContextHaving shown that the our registration approach using morphological landmarks from 2PF AF will allow us to compare the distribution of the eGFP-marked wnt1 lineage in Tg(wnt1:eGFP) embryos with the distribution of egfp mRNA, we sought to determine which cells within the MHD were still actively expressing wnt1 in order to shed light on how the MHB boundary is sharpened. Figure 8(a) shows the results of registration of these data. Optical sections in the dorsal neuroepithelium of AF, eGFP, and NBT/BCIP show the morphology, wnt1 lineage, and wnt1 expressing cells, respectively. Maximum intensity projection of the data registered in 3-D shows eGFP lineage tracer perdurance away from the boundary (green), while NBT/BCIP was exclusive to a group of boundary cells anterior to the constriction within the wnt1 lineage (yellow). Punctate NBT/BCIP signal in the dorsal hindbrain may correspond to a small number of cells known to express wnt1 as part of the initiation of a program of migration and differentiation to tegmental nuclei.87 Fig. 8Visualization and quantification of the subset of the wnt1 lineage actively transcribing wnt1 mRNA in a live morphological context. (a) Dorsal sections of the AF, live eGFP reporter, and coregistered NBT/BCIP signal from combined 2PF-OCM showing live morphology, wnt1 lineage, and actively wnt1 expressing cells, respectively, in the MHD region at 24 hpf. A maximum-intensity projection of the 3-D pseudocolored overlay shows that the active gene expression is restricted to a subpopulation of the initially specified wnt1 lineage in the posterior midbrain, just anterior to the MHB constriction, and isolated cells in the anterior hindbrain. . (b) Intensity profiles of the live reporter fluorescence and NBT/BCIP signal from dorsal sections in the neuroepithelium show that dorsally there is still a significant presence of wnt1 lineage that has stopped expressing wnt1 as evidenced by the eGFP signal in the absence of NBT/BCIP. Ventrally, the anterior hindbrain does not have significant eGFP or NBT/BCIP signal, indicating that the wnt1 lineage previously present has moved physically from the location, perhaps migrating into the midbrain or sorting to the dorsal region of the anterior hindbrain.  As with dynamic lineage tracing, we quantified the distribution of eGFP and NBT/BCIP across the MHB in the dorsal and ventral regions of the neural tube, respectively, as shown in Fig. 8(b). Now it is possible to ascertain whether or not the wnt1 lineage in the dorsal hindbrain has stopped expressing wnt1, which it appears the majority of the cells in that lineage have done. These results show that while wnt1 was initially expressed across the presumptive MHB, cells in that region received signals telling them to stay in place and turn wnt1 off, resulting in a sharp boundary of gene expression at the dorsal MHB constriction. In contrast, in the ventral neuroepithelium, we know from dynamic lineage tracing that the wnt1 lineage is initially present in the ventral hindbrain but by the end of segmentation, no perduring eGFP is found there. The lack of eGFP in this region once occupied by part of the wnt1 lineage suggests that those cells have physically moved to a new location, potentially by sorting either anteriorly across the MHB into the midbrain, or also possibly dorsally into the dorsal hindbrain, leading to the refinement of the ventral MHB. As the dorsal and ventral environments of the neuroepithelium are known to differ in terms of gene expression and subsequent fates, it is not surprising that the mechanism for refining the MHB should differ along the dorsoventral axis. What is remarkable is that two different mechanisms may exist to segment the midbrain and hindbrain along the anteroposterior axis, highlighting the importance of this evolutionarily conserved boundary. Our approach will also be useful for evaluating aberrant neural patterning. For example, the major feature of the fgf8a mutant phenotype, acerebellar, is lack of a cerebellum. In these mutants, several MHB genes, including wnt1, pax2a, and engr2, are activated properly but their expression at the MHB is not maintained after mid-somitogenesis.88 The subsequent fate of these lineages has not been well characterized, but since expression is properly activated, the perdurance of a reporter gene could be used to track these populations and combined with ISH to reveal morphogenetic and molecular alterations of their developmental programs due to the lack of fgf8a activity. In such cases, combined 2PF-OCM could provide important insights into the roles and regulatory relationships of MHB genes. 4.ConclusionWe have demonstrated the potential of combining two common techniques used to study embryonic development, lineage tracing and ISH, for uncovering mechanisms of neural patterning with UPM. To date, ISH data have been rarely linked to lineage maps, and only by immunodetection of the lineage marker after ISH.87 Our results have shown, however, that the fixation and subsequent processing by ISH significantly distort brain morphology from its in vivo shape. By imaging the lineage map in vivo and registering a subsequently acquired 3-D gene expression domain onto the in vivo map with landmark correspondences, however, we have shown that these distributions can be visualized within the true morphology of the developing brain, which will be useful to uncover the roles of MHB genes in brain morphogenesis. In this report, we have demonstrated this potential by characterizing previously unreported dorsoventral differences in the mechanism of the sharpening of the wnt1 gene expression domain during MHB morphogenesis. Several important, unique aspects of our approach enable such analysis. First, this analysis was enabled by the preservation of eGFP perdurance throughout 2PF time-lapse imaging. Lack of photobleaching was apparent by comparison of the broad distribution of eGFP fluorescence and contrastingly narrow distribution of egfp mRNA transcripts from registration of the last time-lapse frame, that accurately reflected the historical and the instantaneous expression of wnt1, respectively, within the MHD. We also demonstrated embryo viability under these imaging conditions, showing that the development of the MHD region progresses as expected in embryos that further develop normally to larval stages. Finally, we showed that sub-10-fs pulses excite the AF signal well enough to clearly see the morphology of embryonic tissues, providing important context for analysis of cell lineage and molecular fate. Of particular importance was its usefulness both in vivo and post-ISH for visualizing and marking morphological landmark correspondences. Multimodal image registration also provides a way to integrate various morphometric and molecular data collected from different embryos and to build up systematic models of developmental processes.89–91 Here, we demonstrated the beginnings toward a dynamic zebrafish atlas of early brain patterning that incorporates both gene expression and lineage information. With the development of UPM to dynamically image several FP reporters at once,39 our lineage mapping experiments have the potential, with the requisite multicolor transgenic lines, to simultaneously monitor the spatiotemporal distribution of multiple lineages and to map the unique pathways of gene expression leading to specification of different cell types. Subsequent ISH and image registration would reveal unique gene expression signatures within those lineages that could simultaneously be correlated with morphogenesis within a complex 3-D brain architecture. Such an approach will be useful for integrating the analysis of neural patterning at the morphological, cellular, and molecular levels. AcknowledgmentsWe would like to acknowledge C. Lilie for creation of the stable transgenic line and A. Whitener, J. Fleming, and L. Beaster-Jones for providing the egfp probe. This work was funded by the American Cancer Society and the National Science Foundation. ReferencesS. G. MegasonS. E. Fraser,
“Imaging in systems biology,”
Cell, 130
(5), 784
–795
(2007). http://dx.doi.org/10.1016/j.cell.2007.08.031 CELLB5 0092-8674 Google Scholar
H. Peng,
“Bioimage informatics: a new area of engineering biology,”
Bioinformatics, 24
(17), 1827
–1836
(2008). http://dx.doi.org/10.1093/bioinformatics/btn346 BOINFP 1367-4803 Google Scholar
W. WurstL. Bally-Cuif,
“Neural plate patterning: Upstream and downstream of the isthmic organizer,”
Nat. Rev. Neurosci., 2
(2), 99
–108
(2001). http://dx.doi.org/10.1038/35053516 NRNAAN 1471-0048 Google Scholar
M. RhinnM. Brand,
“The midbrain-hindbrain boundary organizer,”
Curr. Opin. Neurobiol., 11
(1), 34
–42
(2001). http://dx.doi.org/10.1016/S0959-4388(00)00171-9 COPUEN 0959-4388 Google Scholar
M. Brandet al.,
“Mutations in zebrafish genes affecting the formation of the boundary between midbrain and hindbrain,”
Development, 123 179
–190
(1996). 68KCAI 0950-1991 Google Scholar
G. R. Buckleset al.,
“Combinatorial Wnt control of zebrafish midbrain-hindbrain boundary formation,”
Mech. Dev., 121
(5), 437
–447
(2004). http://dx.doi.org/10.1016/j.mod.2004.03.026 MEDVE6 0925-4773 Google Scholar
G. JekelyD. Arendt,
“Cellular resolution expression profiling using confocal detection of NBT/BCIP precipitate by reflection microscopy,”
Biotechniques, 42
(6), 751
–755
(2007). http://dx.doi.org/10.2144/000112462 BTNQDO 0736-6205 Google Scholar
L. A. Trinhet al.,
“Fluorescent in situ hybridization employing the conventional NBT/BCIP chromogenic stain,”
Biotechniques, 42
(6), 756
–759
(2007). http://dx.doi.org/10.2144/000112476 BTNQDO 0736-6205 Google Scholar
J. M. Schmitt,
“Optical coherence tomography (OCT): a review,”
IEEE J. Sel. Top. Quantum Electron., 5
(4), 1205
–1215
(1999). http://dx.doi.org/10.1109/2944.796348 IJSQEN 1077-260X Google Scholar
B. Glockeret al.,
“Deformable medical image registration: setting the state of the art with discrete methods,”
Annual Review of Biomedical Engineering, 219
–244 Annual Reviews, Palo Alto, California
(2011). Google Scholar
S. Leibfarthet al.,
“A strategy for multimodal deformable image registration to integrate PET/MR into radiotherapy treatment planning,”
Acta Oncol., 52
(7), 1353
–1359
(2013). http://dx.doi.org/10.3109/0284186X.2013.813964 ACTOEL 0284-186X Google Scholar
P. C. Pearlmanet al.,
“Mono- and multimodal registration of optical breast images,”
J. Biomed. Opt., 17
(8), 10
(2012). http://dx.doi.org/10.1117/1.JBO.17.8.080901 JBOPFO 1083-3668 Google Scholar
V. TavakoliA. A. Amini,
“A survey of shaped-based registration and segmentation techniques for cardiac images,”
Comput. Vision Image Understanding, 117
(9), 966
–989
(2013). http://dx.doi.org/10.1016/j.cviu.2012.11.017 CVIUF4 1077-3142 Google Scholar
M. A. AudetteF. P. FerrieT. M. Peters,
“An algorithmic overview of surface registration techniques for medical imaging,”
Med. Image Anal., 4
(3), 201
–217
(2000). http://dx.doi.org/10.1016/S1361-8415(00)00014-1 MIAECY 1361-8415 Google Scholar
G. Lippoliset al.,
“Automatic registration of multi-modal microscopy images for integrative analysis of prostate tissue sections,”
BMC Cancer, 13 11
(2013). http://dx.doi.org/10.1186/1471-2407-13-408 BCMACL 1471-2407 Google Scholar
J. MichalekM. CapekL. Kubinova,
“Nonrigid registration of CLSM images of physical sections with discontinuous deformations,”
Microsc. Microanal., 17
(6), 923
–936
(2011). http://dx.doi.org/10.1017/S1431927611011937 MIMIF7 1431-9276 Google Scholar
K. Mosaligantiet al.,
“Registration and 3D visualization of large microscopy images,”
Proc. SPIE, 6144 61442V
(2006). http://dx.doi.org/10.1117/12.653505 PSISDG 0277-786X Google Scholar
M. Stilleet al.,
“3D reconstruction of 2D fluorescence histology images and registration with in vivo MR images: Application in a rodent stroke model,”
J. Neurosci. Methods, 219
(1), 27
–40
(2013). http://dx.doi.org/10.1016/j.jneumeth.2013.06.003 JNMEDT 0165-0270 Google Scholar
C. O. S. SorzanoP. ThevenazM. Unser,
“Elastic registration of biological images using vector-spline regularization,”
IEEE Trans. Biomed. Eng., 52
(4), 652
–663
(2005). http://dx.doi.org/10.1109/TBME.2005.844030 IEBEAX 0018-9294 Google Scholar
M. Holden,
“A review of geometric transformations for nonrigid body registration,”
IEEE Trans. Med. Imaging, 27
(1), 111
–128
(2008). http://dx.doi.org/10.1109/TMI.2007.904691 ITMID4 0278-0062 Google Scholar
J. Carsonet al.,
“Automated pipeline for atlas-based annotation of gene expression patterns: application to postnatal day 7 mouse brain,”
Methods, 50
(2), 85
–95
(2010). http://dx.doi.org/10.1016/j.ymeth.2009.08.005 MTHDE9 1046-2023 Google Scholar
J. H. Christiansenet al.,
“EMAGE: a spatial database of gene expression patterns during mouse embryo development,”
Nucleic Acids Res., 34 D637
–D641
(2006). http://dx.doi.org/10.1093/nar/gkj006 NARHAD 0305-1048 Google Scholar
T. Y. Linet al.,
“Gene expression data to mouse atlas registration using a nonlinear elasticity smoother and landmark points constraints,”
J. Sci. Comput., 50
(3), 586
–609
(2012). http://dx.doi.org/10.1007/s10915-011-9563-6 JSCOEB 0885-7474 Google Scholar
A. ViselC. ThallerG. Eichele,
“GenePaint.org: an atlas of gene expression patterns in the mouse embryo,”
Nucleic Acids Res., 32 D552
–D556
(2004). http://dx.doi.org/10.1093/nar/gkh029 NARHAD 0305-1048 Google Scholar
C. C. Fowlkeset al.,
“A quantitative spatiotemporal atlas of gene expression in the Drosophila blastoderm,”
Cell, 133
(2), 364
–374
(2008). http://dx.doi.org/10.1016/j.cell.2008.01.053 CELLB5 0092-8674 Google Scholar
D. W. Knowleset al.,
“Mapping organism expression levels at cellular resolution in developing Drosophila,”
Proc. SPIE, 4621 57
–64
(2002). http://dx.doi.org/10.1117/12.467832 PSISDG 0277-786X Google Scholar
F. LongJ. ZhouH. Peng,
“Visualization and analysis of 3D microscopic images,”
PLoS Comput. Biol., 8
(6), e1002519
(2012). http://dx.doi.org/10.1371/journal.pcbi.1002519 1553-734X Google Scholar
O. Tassyet al.,
“The ANISEED database: digital representation, formalization, and elucidation of a chordate developmental program,”
Genome Res., 20
(10), 1459
–1468
(2010). http://dx.doi.org/10.1101/gr.108175.110 GEREFS 1088-9051 Google Scholar
C. Castro-Gonzalezet al.,
“A digital framework to build, visualize and analyze a gene expression atlas with cellular resolution in zebrafish early embryogenesis,”
Plos Comput. Biol., 10
(6), 13
(2014). http://dx.doi.org/10.1371/journal.pcbi.1003670 1553-734X Google Scholar
O. Ronnebergeret al.,
“ViBE-Z: a framework for 3D virtual colocalization analysis in zebrafish larval brains,”
Nat. Methods, 9
(7), 735
–U316
(2012). http://dx.doi.org/10.1038/nmeth.2076 1548-7091 Google Scholar
J. F. P. Ullmannet al.,
“A three-dimensional digital atlas of the zebrafish brain,”
Neuroimage, 51
(1), 76
–82
(2010). http://dx.doi.org/10.1016/j.neuroimage.2010.01.086 NEIMEF 1053-8119 Google Scholar
T. Annilaet al.,
“ZebIAT, an image analysis tool for registering zebrafish embryos and quantifying cancer metastasis,”
BMC Bioinf., 14 9
(2013). http://dx.doi.org/10.1186/1471-2105-14-S10-S5 BBMIC4 1471-2105 Google Scholar
J. Kerwinet al.,
“The HUDSEN Atlas: a three-dimensional (3D) spatial framework for studying gene expression in the developing human brain,”
J. Anat., 217
(4), 289
–299
(2010). http://dx.doi.org/10.1111/j.1469-7580.2010.01290.x JOANAY 0021-8782 Google Scholar
R. Galleaet al.,
“Three-dimensional Fuzzy kernel regression framework for registration of medical volume data,”
Pattern Recognit., 46
(11), 3000
–3016
(2013). http://dx.doi.org/10.1016/j.patcog.2013.03.025 PTNRA8 0031-3203 Google Scholar
J. Schindelinet al.,
“Fiji: an open-source platform for biological-image analysis,”
Nat. Methods, 9
(7), 676
–682
(2012). http://dx.doi.org/10.1038/nmeth.2019 1548-7091 Google Scholar
F. L. Bookstein,
“Principal warps—thin-plate splines and the decomposition of deformations,”
IEEE Trans. Pattern Anal. Mach. Intell., 11
(6), 567
–585
(1989). http://dx.doi.org/10.1109/34.24792 ITPIDJ 0162-8828 Google Scholar
H. C. Penget al.,
“BrainAligner: 3D registration atlases of Drosophila brains,”
Nat. Methods, 8
(6), 493
–U486
(2011). http://dx.doi.org/10.1038/nmeth.1602 1548-7091 Google Scholar
J. X. LiuY. S. ChenL. F. Chen,
“Fast and accurate registration techniques for affine and nonrigid alignment of MR brain images,”
Ann. Biomed. Eng., 38
(1), 138
–157
(2010). http://dx.doi.org/10.1007/s10439-009-9840-9 ABMECF 0090-6964 Google Scholar
H. C. Gibbset al.,
“Imaging embryonic development with ultrashort pulse microscopy,”
Opt. Eng., 53
(5), 051506
(2014). http://dx.doi.org/10.1117/1.OE.53.5.051506 OPEGAR 0091-3286 Google Scholar
K. Koniget al.,
“Pulse-length dependence of cellular response to intense near-infrared laser pulses in multiphoton microscopes,”
Opt. Lett., 24
(2), 113
–115
(1999). http://dx.doi.org/10.1364/OL.24.000113 OPLEDP 0146-9592 Google Scholar
P. Xiet al.,
“Greater signal, increased depth, and less photobleaching in two-photon microscopy with 10 fs pulses,”
Opt. Commun., 281
(7), 1841
–1849
(2008). http://dx.doi.org/10.1016/j.optcom.2007.09.066 OPCOB8 0030-4018 Google Scholar
I. Saytashevet al.,
“Pulse duration and energy dependence of photodamage and lethality induced by femtosecond near infrared laser pulses in Drosophila melanogaster,”
J. Photochem. Photobiol. B Biol., 115 42
–50
(2012). http://dx.doi.org/10.1016/j.jphotobiol.2012.06.009 JPPBEG 1011-1344 Google Scholar
M. Westerfield, The Zebrafish Book. A Guide for the Laboratory Use of Zebrafish (Danio rerio), 4th ed.University of Oregon Press, Eugene, Oregon
(2000). Google Scholar
D. H. Rowitchet al.,
“Identification of an evolutionarily conserved 110 base-pair cis-acting regulatory sequence that governs Wnt-1expression in the murine neural plate,”
Development, 125
(14), 2735
–2746
(1998). 68KCAI 0950-1991 Google Scholar
D. NoueJ. Wittbrodt,
“One for all-a highly efficient and versatile method for fluorescent immunostaining in fish embryos,”
PLoS One, 6
(5), e19713
(2011). http://dx.doi.org/10.1371/journal.pone.0019713 1932-6203 Google Scholar
A. M. LarsonA. T. Yeh,
“Ex vivo characterization of sub-10-fs pulses,”
Opt. Lett., 31
(11), 1681
–1683
(2006). http://dx.doi.org/10.1364/OL.31.001681 OPLEDP 0146-9592 Google Scholar
Q. WuB. E. ApplegateA. T. Yeh,
“Cornea microstructure and mechanical responses measured with nonlinear optical and optical coherence microscopy using sub-10-fs pulses,”
Biomed. Opt. Express, 2
(5), 1135
–1146
(2011). http://dx.doi.org/10.1364/BOE.2.001135 BOEICL 2156-7085 Google Scholar
Y. Q. Baiet al.,
“Dynamic multicomponent engineered tissue reorganization and matrix deposition measured with an integrated nonlinear optical microscopy-optical coherence microscopy system,”
J. Biomed. Opt., 19
(3), 036014
(2014). http://dx.doi.org/10.1117/1.JBO.19.3.036014 JBOPFO 1083-3668 Google Scholar
H. Penget al.,
“V3D enables real-time 3D visualization and quantitative analysis of large-scale biological image data sets,”
Nat. Biotechnol., 28
(4), 348
–U375
(2010). http://dx.doi.org/10.1038/nbt.1612 NABIF9 1087-0156 Google Scholar
H. C. Penget al.,
“Extensible visualization and analysis for multidimensional images using Vaa3D,”
Nat. Protoc., 9
(1), 193
–208
(2014). http://dx.doi.org/10.1038/nprot.2014.011 NPARDW 1754-2189 Google Scholar
T. LangenbergM. Brand,
“Lineage restriction maintains a stable organizer cell population at the zebrafish midbrain-hindbrain boundary,”
Development, 132
(14), 3209
–3216
(2005). http://dx.doi.org/10.1242/dev.01862 68KCAI 0950-1991 Google Scholar
A. T. Yehet al.,
“Advances in nonlinear optical microscopy for visualizing dynamic tissue properties in culture,”
Tissue Eng. Part B, 14
(1), 119
–131
(2008). http://dx.doi.org/10.1089/teb.2007.0284 1937-3368 Google Scholar
A. Kaufmannet al.,
“Multilayer mounting enables long-term imaging of zebrafish development in a light sheet microscope,”
Development, 139
(17), 3242
–3247
(2012). http://dx.doi.org/10.1242/dev.082586 68KCAI 0950-1991 Google Scholar
L. A. LoweryH. Sive,
“Initial formation of zebrafish brain ventricles occurs independently of circulation and requires the nagie oko and snakehead/atp1a1a.1 gene products,”
Development, 132
(9), 2057
–2067
(2005). http://dx.doi.org/10.1242/dev.01791 68KCAI 0950-1991 Google Scholar
L. A. LoweryH. Sive,
“The genetic mechanisms underlying brain ventricle morphogenesis in zebrafish,”
Dev. Biol., 283
(2), 589
–589
(2005). DEBIAO 0012-1606 Google Scholar
S. Y. Medvedevet al.,
“Quantitative analysis of gene expression in preimplantation mouse embryos using green fluorescent protein reporter,”
Biol. Reprod., 67
(1), 282
–286
(2002). http://dx.doi.org/10.1095/biolreprod67.1.282 BIREBV 0006-3363 Google Scholar
P. CorishC. Tyler-Smith,
“Attenuation of green fluorescent protein half-life in mammalian cells,”
Protein Eng., 12
(12), 1035
–1040
(1999). http://dx.doi.org/10.1093/protein/12.12.1035 PRENE9 0269-2139 Google Scholar
C. Blasdaleet al.,
“Effect of tissue shrinkage on histological tumour-free margin after excision of basal cell carcinoma,”
Br. J. Dermatol., 162
(3), 607
–610
(2010). http://dx.doi.org/10.1111/bjd.2010.162.issue-3 BJDEAZ 1365-2133 Google Scholar
E. A. FrimpongM. L. Henebry,
“Short-term effects of formalin and ethanol fixation and preservation techniques on weight and size of fish eggs,”
Trans. Am. Fish. Soc., 141
(6), 1472
–1479
(2012). http://dx.doi.org/10.1080/00028487.2012.694832 TAFSAI 0002-8487 Google Scholar
A. GeldmacherK. Wieland,
“Implications of mechanical deformation and formaldehyde preservation for the identification of stage-specific characteristics of Baltic cod eggs,”
J. Appl. Ichthyol., 15
(2), 75
–79
(1999). http://dx.doi.org/10.1046/j.1439-0426.1999.00093.x JAICEF 0175-8659 Google Scholar
M. Y. Loqmanet al.,
“A cell shrinkage artefact in growth plate chondrocytes with common fixative solutions: importance of fixative osmolarity for maintaining morphology,”
Eur. Cells Mater., 19 214
–227
(2010). ECMUBB 1473-2262 Google Scholar
G. Schulzet al.,
“Three-dimensional strain fields in human brain resulting from formalin fixation,”
J. Neurosci. Methods, 202
(1), 17
–27
(2011). http://dx.doi.org/10.1016/j.jneumeth.2011.08.031 JNMEDT 0165-0270 Google Scholar
E. A. Zamiret al.,
“A digital image-based method for computational tissue fate mapping during early avian morphogenesis,”
Ann. Biomed. Eng., 33
(6), 854
–65
(2005). http://dx.doi.org/10.1007/s10439-005-3037-7 ABMECF 0090-6964 Google Scholar
T. J. Baileyet al.,
“Spectral-domain optical coherence tomography as a noninvasive method to assess damaged and regenerating adult zebrafish retinas,”
Invest. Ophthalmol. Visual Sci., 53
(6), 3126
–3138
(2012). http://dx.doi.org/10.1167/iovs.11-8895 IOVSDA 0146-0404 Google Scholar
K. D. Raoet al.,
“Real-time in vivo imaging of adult zebrafish brain using optical coherence tomography,”
J. Biophotonics, 2
(5), 288
–291
(2009). http://dx.doi.org/10.1002/jbio.v2:5 JBOIBX 1864-063X Google Scholar
K. D. Raoet al.,
“Noninvasive imaging of ethanol-induced developmental defects in zebrafish embryos using optical coherence tomography,”
Birth Defects Res. Part B, 95
(1), 7
–11
(2012). http://dx.doi.org/10.1002/bdrb.20332 Google Scholar
L. Kagemannet al.,
“Repeated, noninvasive, high resolution spectral domain optical coherence tomography imaging of zebrafish embryos,”
Mol. Vision, 14
(253–255), 2157
–2170
(2008). MVEPFB 1090-0535 Google Scholar
K. B. MehtaN. G. Chen,
“Plasmonic chiral contrast agents for optical coherence tomography: numerical study,”
Opt. Express, 19
(16), 14903
–14912
(2011). http://dx.doi.org/10.1364/OE.19.014903 OPEXFF 1094-4087 Google Scholar
P. F. Zhanget al.,
“Imaging single chiral nanoparticles in turbid media using circular-polarization optical coherence microscopy,”
Sci. Rep., 4 4979
(2014). SRCEC3 2045-2322 Google Scholar
F. E. Robleset al.,
“Molecular imaging true-colour spectroscopic optical coherence tomography,”
Nat. Photonics, 5
(12), 744
–747
(2011). http://dx.doi.org/10.1038/nphoton.2011.257 1749-4885 Google Scholar
E. A. Geninaet al.,
“Optical coherence tomography monitoring of enhanced skin optical clearing in rats in vivo,”
J. Biomed. Opt., 19
(2), 021109
(2014). http://dx.doi.org/10.1117/1.JBO.19.2.021109 JBOPFO 1083-3668 Google Scholar
M. H. Khanet al.,
“Optical clearing of in vivo human skin: implications for light-based diagnostic imaging and therapeutics,”
Lasers Surg. Med., 34
(2), 83
–85
(2004). http://dx.doi.org/10.1002/(ISSN)1096-9101 LSMEDI 0196-8092 Google Scholar
R. Y. Heet al.,
“Effects of optical clearing agents on noninvasive blood glucose monitoring with optical coherence tomography: a pilot study,”
J. Biomed. Opt., 17
(10), 101513
(2012). http://dx.doi.org/10.1117/1.JBO.17.10.101513 JBOPFO 1083-3668 Google Scholar
I. V. Larinaet al.,
“Enhanced OCT imaging of embryonic tissue with optical clearing,”
Laser Phys. Lett., 5
(6), 476
–479
(2008). http://dx.doi.org/10.1002/lapl.200810019 1612-2011 Google Scholar
R. Cicchiet al.,
“Contrast and depth enhancement in two-photon microscopy of human skin ex vivo by use of optical clearing agents,”
Opt. Express, 13
(7), 2337
–2344
(2005). http://dx.doi.org/10.1364/OPEX.13.002337 OPEXFF 1094-4087 Google Scholar
A. Matsuiet al.,
“Optical clearing of the skin for near-infrared fluorescence image-guided surgery,”
J. Biomed. Opt., 14
(2), 024019
(2009). http://dx.doi.org/10.1117/1.3103317 JBOPFO 1083-3668 Google Scholar
M. R. HunsakerD. G. Amaral,
“A semi-automated pipeline for the segmentation of rhesus macaque hippocampus: validation across a wide age range,”
PLoS One, 9
(2), 10
(2014). http://dx.doi.org/10.1371/journal.pone.0089456 1932-6203 Google Scholar
C. Orczyket al.,
“Preliminary experience with a novel method of three-dimensional co-registration of prostate cancer digital histology and in vivo multiparametric MRI,”
Clin. Radiol., 68
(12), E652
–E658
(2013). http://dx.doi.org/10.1016/j.crad.2013.07.010 CLRAAG 0009-9260 Google Scholar
N. Kadoyaet al.,
“Evaluation of various deformable image registration algorithms for thoracic images,”
J. Radiat. Res., 55
(1), 175
–182
(2014). http://dx.doi.org/10.1093/jrr/rrt093 JRARAX 0449-3060 Google Scholar
S. S. Liet al.,
“Voxel-based statistical analysis of uncertainties associated with deformable image registration,”
Phys. Med. Biol., 58
(18), 6481
–6494
(2013). http://dx.doi.org/10.1088/0031-9155/58/18/6481 PHMBA7 0031-9155 Google Scholar
S. Y. Liuet al.,
“Evaluation of image registration spatial accuracy using a Bayesian hierarchical model,”
Biometrics, 70
(2), 366
–377
(2014). http://dx.doi.org/10.1111/biom.v70.2 BIOMB6 0006-341X Google Scholar
C. Hoffmannet al.,
“Accuracy quantification of a deformable image registration tool applied in a clinical setting,”
J. Appl. Clin. Med. Phys, 15
(1), 237
–245
(2014). http://dx.doi.org/10.1120/jacmp.v15i1.4564 Google Scholar
F. P. M. OliveiraJ. Tavares,
“Medical image registration: a review,”
Comput. Methods Biomech. Biomed. Eng., 17
(2), 73
–93
(2014). http://dx.doi.org/10.1080/10255842.2012.670855 1025-5842 Google Scholar
R. Alterovitzet al.,
“Registration of MR prostate images with biomechanical modeling and nonlinear parameter estimation,”
Med. Phys., 33
(2), 446
–454
(2006). http://dx.doi.org/10.1118/1.2163391 MPHYA6 0094-2405 Google Scholar
D. Loeckxet al.,
“Nonrigid image registration using conditional mutual information,”
IEEE Trans. Med. Imaging, 29
(1), 19
–29
(2010). http://dx.doi.org/10.1109/TMI.2009.2021843 ITMID4 0278-0062 Google Scholar
J. Schiinget al.,
“Regional 3D superimposition to assess temporomandibular joint condylar morphology,”
Dentomaxillofac. Radiol., 43
(1), 20130273
(2014). http://dx.doi.org/10.1259/dmfr.20130273 Google Scholar
K. Volkmannet al.,
“The zebrafish cerebellar upper rhombic lip generates tegmental hindbrain nuclei by long-distance migration in an evolutionary conserved manner,”
J. Comp. Neurol., 518
(14), 2794
–2817
(2010). http://dx.doi.org/10.1002/cne.22364 JCNEAM 0021-9967 Google Scholar
F. Reiferset al.,
“Fgf8 is mutated in zebrafish acerebellar (ace) mutants and is required for maintenance of midbrain-hindbrain boundary development and somitogenesis,”
Development, 125
(13), 2381
–2395
(1998). 68KCAI 0950-1991 Google Scholar
E. FriseA. S. HammondsS. E. Celniker,
“Systematic image-driven analysis of the spatial Drosophila embryonic expression landscape,”
Mol. Syst. Biol., 6 345
(2010). http://dx.doi.org/10.1038/msb.2009.102 MSBOC3 1744-4292 Google Scholar
J. Gutierrez,
“A developmental systems perspective on epistasis: computational exploration of mutational interactions in model developmental regulatory networks,”
PLoS One, 4
(9), e6823
(2009). http://dx.doi.org/10.1371/journal.pone.0006823 1932-6203 Google Scholar
T. V. TruongW. Supatto,
“Toward high-content/high-throughput imaging and analysis of embryonic morphogenesis,”
Genesis, 49
(7), 555
–569
(2011). http://dx.doi.org/10.1002/dvg.20760 1526-954X Google Scholar
BiographyHolly C. Gibbs earned her BS degree in biomedical engineering from Texas A&M University in 2006 and her MSc degree in genomics and pathways biology from the University of Edinburgh in 2008. Currently, she is a doctoral candidate in the Tissue Microscopy Lab in the Department of Biomedical Engineering at Texas A&M University, where she specializes in the application of ultrashort laser technology in the field of developmental biology, specifically vertebrate brain patterning and development. Colin R. Dodson is currently an undergraduate student studying biomedical engineering at Texas A&M University. He is working with Dr. Roland R. Kaunas’ Cellular Biomechanics Lab to engineer microtissues containing stem cells as vehicles for regenerating musculoskeletal tissues and as in vitro models for studying bone tumor biology. Yuqiang Bai earned his BS degree in physics from Shanxi University, in 1999, and his MS degree in optics from the Shanghai Jiao Tong University in 2002. He worked in telecommunications for 4 years and earned his PhD degree in biomedical engineering at Texas A&M University in 2014, where he specialized in imaging dynamic cell-matrix interactions and remodeling in engineered tissues with optical coherence microscopy. He is currently in postdoctoral training at Florida International University. Arne C. Lekven earned his BA in animal physiology from UCSD in 1989 and his PhD in molecular, cell, and developmental biology at UCLA in 1996. His postdoctoral training at the University of Washington School of Medicine centered on zebrafish development. He is an associate professor of biology at Texas A&M University and focuses on the role of Wnt signaling in patterning and growth of the vertebrate brain and mesoderm. Alvin T. Yeh earned his BSE in chemical engineering from the University of Michigan in 1993 and his PhD in physical chemistry at the University of California Berkeley, in 2000. His postdoctoral training at the Beckman Laser Institute and Medical Clinic in Irvine, California, centered on imaging with ultrashort pulse lasers. He is an associate professor of biomedical engineering at Texas A&M University and focuses on instrumentation development for imaging engineered tissues and embryonic development. |


