|
|
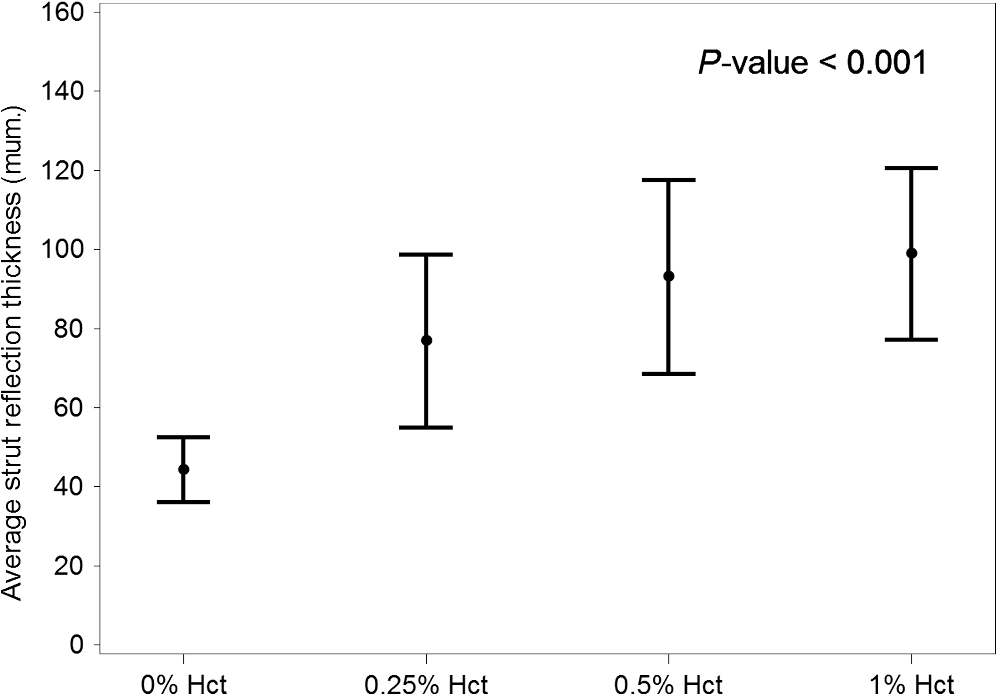
1.IntroductionIntravascular optical coherence tomography (IV-OCT) has proven useful for the assessment of coronary stent parameters such as strut apposition and the extent of strut coverage by intimal hyperplasia.1–3 Recognition and understanding of artifacts unique to IV-OCT are vital for correct image interpretation as they could negatively impact clinical decisions and core lab analyses. Two common IV-OCT artifacts are the “merry-go-round” (MGR) artifact,4–8 which is an artifactual increase in the strut arc length (SAL) in the lateral dimension, and the “blooming” artifact,4,6,7,9–11 which is an artifactual increase in the strut reflection thickness (blooming thickness) in the axial dimension [Fig. 1(a)]. However, the proposed mechanisms for these artifacts have not been validated and on closer inspection are inconsistent with clinical observations. Fig. 1Definition of strut arc length (SAL) [merry-go-rounding (MGR)] and strut reflection thickness (blooming) (a) and published clinical examples (b)–(f): (b) MGR due to catheter offset,4 (c) MGR due to blood artifact,6 (d) MGR and blooming due to intimal hyperplasia and worsened by blood,4 (e) MGR and blooming due to intimal hyperplasia,4 and (f) MGR and blooming due to thrombus.12 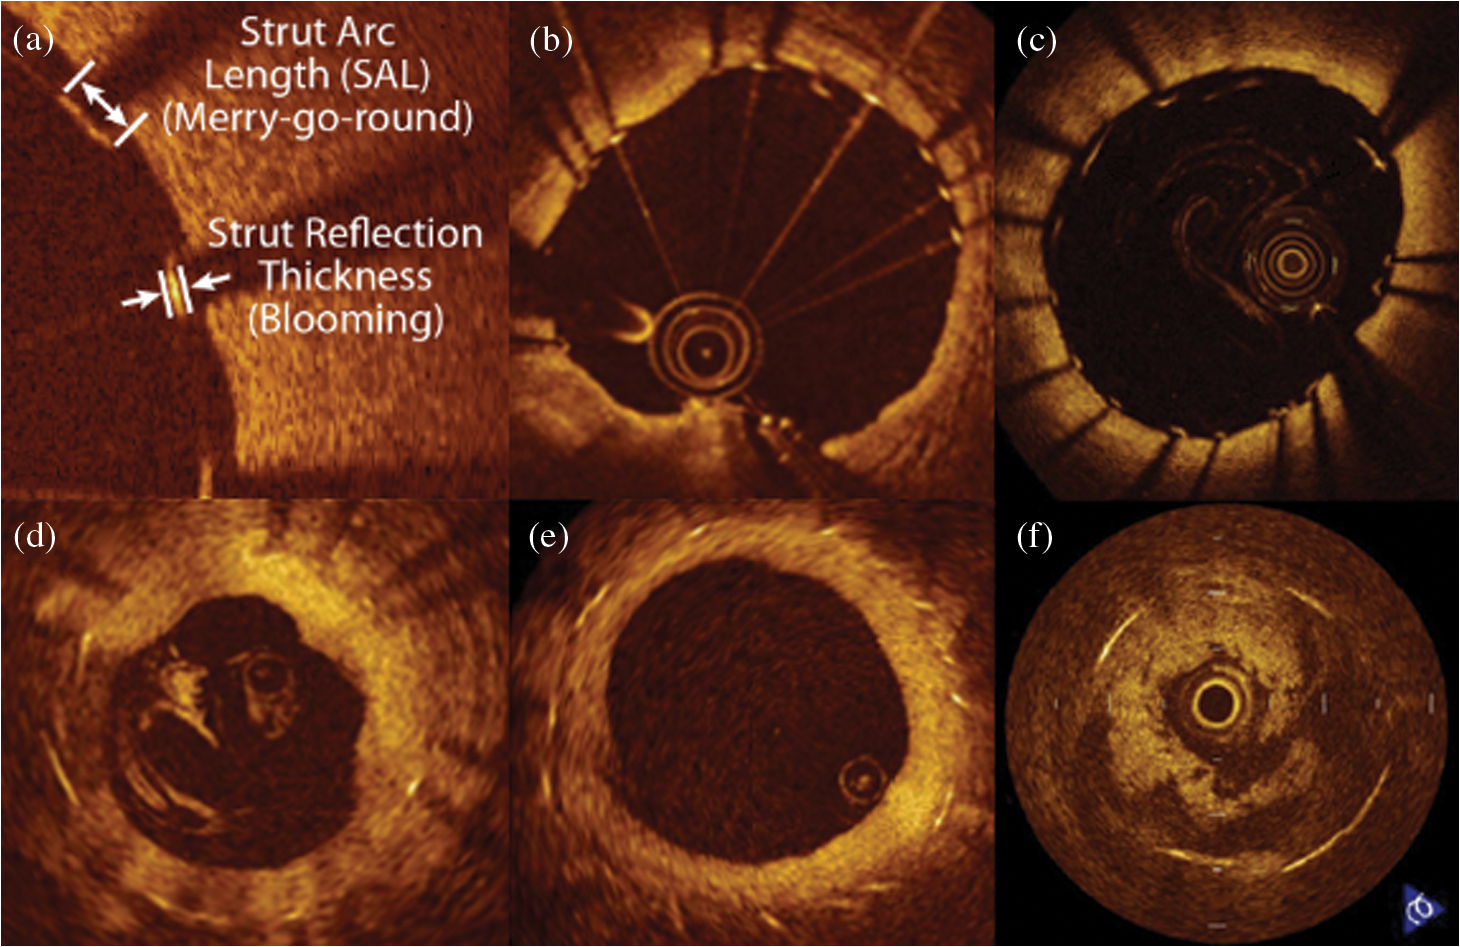 Although many investigators have recognized a correlation between catheter eccentricity and the presence of MGR,4–8 the underlying mechanism is poorly understood. The current hypotheses published in the literature attribute MGR to two mechanisms: reduction in lateral resolution based on the polar-to-rectangular conversion associated with IV-OCT image reconstruction,4,5 and increased OCT beam spot size outside of the optical focal point5,9 (Fig. 2). During IV-OCT image acquisition, the OCT catheter rotates and emits beams of near-infrared (NIR) light at regular intervals, collecting the light which is scattered back to the catheter [Fig. 2(a)]. The information from this collected light is stored as one-dimensional (1-D) A-lines containing depth and intensity information [Fig. 2(b)]. To reconstruct this information into an image of the artery (B-scan), A-lines recorded in the polar domain are converted into Cartesian coordinates [polar-to-rectangular conversion, Fig. 2(c)]. At increased distances from the catheter, these 1-D A-lines would introduce gaps of lateral width in the rectangular B-scan, where is the angle between two adjacent A-lines and is the distance from the catheter. To fill these gaps, pixel values from neighboring A-lines are interpolated. Our OCT system uses a bilinear interpolation scheme, where all the information to fill in a gap between two A-lines come from those two A-lines. To illustrate this concept, Fig. 3 shows the same IV-OCT B-scan of a stented human coronary artery with and without bilinear interpolation. At greater distances from the catheter, greater lateral distances must be filled by interpolation resulting in a reduction of lateral resolution. Some investigators have suggested4,5 that the strut-stretching in the lateral direction (MGR) is due to this interpolation effect, which is most exaggerated at greater catheter-strut distances when the catheter is at eccentric positions [Fig. 2(d)]. However, as is increased, the angle subtended by the strut to the catheter is reduced, resulting in fewer A-lines intersecting the strut [Figs. 2(e) and 2(f)]. These two opposing effects balance one another and are not expected to result in lateral stretching of the strut by more than twice the width of the gap between two A-lines, far less than the increase in SAL observed clinically4,12 [Figs. 1(d) and 1(f)]. Fig. 2Current MGR mechanisms proposed in the literature. (a) As the optical coherence tomography (OCT) catheter rotates, near-infrared light is emitted and the backscattered light is collected. Six beams (labeled A–F) are depicted. (b, c) Information from the collected light is stored as one-dimensional (1-D) A-lines (labeled A–F, red squares indicate the points in the A-line where the stent surface is contacted by the beam). The polar-to-rectangular conversion of the A-lines to a B-scan introduces gaps between the A-lines which are wider at increased distance from the catheter. Filling the gap between two A-lines requires bilinear interpolation of information from those two A-lines, thus reducing the lateral resolution. (d) It has been proposed in the literature that the MGR is due to this reduced lateral resolution at greater distances from the catheter, where more space is filled by interpolation. (e, f) However, since the angle between two sequential A-lines is fixed, as the distance from the catheter to the strut is increased, fewer A-lines intersect the strut (in the blowups, black lines represent the centers of the OCT beams, but OCT beams which only partially touch the strut such as the two outermost beams in (e) will still result in A-lines containing stent strut signal). These two offsetting mechanisms would balance for no change in SAL, except for an additional factor, changing laser spot size outside of the beam focus. As shown in scales in (e, f), the width of the beam spot of our OCT system increases from 23 to when the catheter–strut distance is increased from 1.5 to 2.5 mm, which can explain a small (i.e., ) increase in apparent SAL, but cannot explain the more dramatic clinical images shown in Fig. 1.  Fig. 3Bilinear interpolation in intravascular optical coherence tomography (IV-OCT) image reconstruction. The same IV-OCT B-scan of a stented human coronary artery is shown without (top) and with (bottom) bilinear interpolation. In the blowup from the top image without interpolation, the gaps between A-lines can be clearly seen. In the blowup of the same region from the bottom image, each of these gaps has been filled in using a weighted average of pixel values from the two surrounding A-lines.  However, a third factor, the varying spot size of the OCT beam, is responsible for the SAL increasing with greater eccentricity of the catheter.5,9 For the OCT system used in this study, the beam is smallest at its focus () from the catheter center and increases in size outside of this optical focal point. Changes in spot size with distance from the catheter for this system have been modeled elsewhere13 and showed that the laser spot is elliptical with a long-axis of and a short axis that is minimum () at the focal point of 1.5 mm [Fig. 2(e)] and which increases to outside the focal point at 2.5 mm from the catheter [Fig. 2(f)]. Because stent struts are highly reflective objects, an OCT beam which only partially touches the stent may produce strong backreflections. For a 3-mm vessel, like the phantoms used in this study, with a stent strut of known lateral width of , a maximum of nine A-lines would at least partially touch the strut when the catheter was centered in the vessel [, Fig. 2(e)], while only seven A-lines would at least partially touch the strut when the catheter was fully offset touching the vessel wall [, Fig. 2(f)]. Following interpolation, the strut would have an apparent SAL of in the centered case, which would increase to in the fully offset case. This maximal 33% increase in SAL still cannot explain many examples of MGR where the increase in SAL is much greater. Since more dramatic MGR examples observed clinically occur in the presence of optical scatterers such as blood4,6 [Figs. 1(c) and 1(d)], intimal hyperplasia4 [Fig. 1(e)], and thrombus12 [Fig. 1(f)], we hypothesized that increased optical scattering in the vessel lumen by intimal hyperplasia or residual blood due to inadequate flushing may be primarily responsible for MGR rather than decreased lateral resolution or spot size variation. The in vivo study of IV-OCT artifacts is complicated by a number of factors including catheter tilt due to blood vessel tortuosity, incomplete removal of red blood cells from the flush fluid, intimal coverage of stent struts, and uncontrolled distance between strut and catheter. Thus, we performed an in vitro assessment of MGR and blooming in stented vessel phantoms, independently testing the contribution of offset catheter, intimal hyperplasia thicknesses, and concentration of blood contamination of the flush fluid (Fig. 4). Fig. 4Demonstration of MGR in phantoms. Driver stent imaged in centered (a) and offset catheter positions (d). Driver stent imaged without (b) and with simulated intimal hyperplasia (e). Xience V stent imaged in 0.9% saline (c) and in 1% hematocrit (Hct) (f). Light scattering by blood dramatically increases MGR and blooming artifacts, while an offset catheter position and simulated intimal hyperplasia do not.  In the present study, we provide experimental results suggesting that MGR and blooming both arise as manifestations of a common mechanism, namely optical scattering between the catheter and stent struts. We also report the first observations of artifactual distortion in the third dimension, longitudinally along the pullback, and provide empirical support that this “three-dimensional merry-go-round” (3-D-MGR) is also a manifestation of optical scattering. Finally, we discuss the implications of these findings for the correct interpretation of IV-OCT images. 2.Methods2.1.Intravascular Optical Coherence Tomography Image AcquisitionDriver (Medtronic, Inc., Minneapolis, Minnesota) and Xience V (Abbott Vascular, Santa Clara, California) coronary stents were deployed within vessel phantoms of 3-mm luminal diameter created from polydimethylsiloxane (PDMS) (Dow Corning Corporation, Midland, Michigan) and titanium dioxide () (Sigma-Aldrich, St. Louis, Missouri) to simulate optical scattering properties of arterial tissue for 1300-nm light ().14,15 The stented phantoms were inserted into a custom imaging apparatus and imaged in 0.9% saline or porcine blood with hematocrits (Hcts) of 0.25%, 0.5%, and 1% at a flow rate of . 2.2.Catheter OffsetTo assess MGR due to catheter offset, a Driver stent was selected due to the round cross-section of each strut, which allows each strut to “present” the same leading edge to the light independent of catheter position. The stented phantom was imaged in 0.9% saline with the catheter coaxially located at three positions within the stent: (1) the center of the phantom; (2) 0.6-mm offset from center; and (3) eccentrically located adjacent to the vessel wall. 2.3.Simulated Intimal HyperplasiaTo assess MGR due to tissue coverage, simulated tissue coverage of varying thickness was created by performing serial dips of the Driver-stented phantom within . 2.4.Merry-Go-Rounding, Blooming, and Three-Dimensional Merry-Go-Rounding due to Blood ScatteringTo assess MGR, blooming, and 3-D-MGR due to blood scattering, the Xience-stented phantom was imaged at increasing %Hct. The 8-mm long Xience V was selected for blood artifacts analysis due to the open cell design, containing six repetitive corrugated rings that are each connected by three embedded links. B-scans of the regions involving the three embedded links appear as three equally spaced struts in cross-section, which are sufficiently separated such that “blurring” of these struts into one another, which would complicate measurements of SAL between struts, did not occur. The longitudinal lengths of the six corrugated rings and the five regions containing three embedded links were measured by multiplying the number of B-scans containing the relevant region by the longitudinal thickness of a B-scan. It is recognized that the light saturation can result in the blooming of reflective objects such as struts. For blooming measurements in this study, however, struts which exhibited signs of saturation (i.e., linear streaks extending axially between the strut and catheter) were excluded. Thus, we are measuring a separate artifact which results in blooming by a mechanism other than saturation. 2.5.Micro-CTThe Xience-stented phantom was scanned at the High-Resolution x-ray CT Facility at the University of Texas at Austin and taken as the gold standard for the true stent dimensions. A FeinFocus microfocal x-ray source was employed operating at 200 kV and 0.17 mA without an x-ray prefilter. A slice thickness of corresponded to one line in a CCD image intensifier imaging system. Each slice was reconstructed at 1024 × 1024 pixels over a 6 mm field of reconstruction, resulting in an in-plane resolution of per pixel. Data were reconstructed as 16-bit TIFFs for offline analysis. 2.6.Optical Coherence Tomography SystemThe OCT system is a custom-made Volcano Corporation system which has a 1310-nm swept source laser (HSL-1000, Santec, Hackensack, New Jersey) scanning at a repetition rate of 20 kHz. The measured free-space axial resolution was with a 6-mm scan depth in saline. The OCT signal was sampled with a linear -space sampling clock to allow real-time OCT image acquisition and display. The IV-OCT catheters were 3.1 French and included a point source with a cone angle of 6.315 deg, a single-mode optical fiber (SMF-28 which features low-dispersion at 1310 nm) with a mode field diameter of , a GRIN lens (0.5-mm diameter, 1.32-mm length, and peak refractive index of 1.629), 0.150-mm glass (BK7) 45-deg prism, and a polymer sheath (). The space () between the glass prism and sheath is filled with air. The focal depth of the beam is and the numerical aperture of the catheter is . Our OCT system has an average of 666 A-lines per B-scan. 2.7.Image Analysis and StatisticsRaw data from the IV-OCT pullbacks were stored in a datalog file format (National Instruments, Austin, Texas) and exported for offline analysis. Offline analysis of IV-OCT and micro-CT images was performed using Medis QIvus analysis software (QCU-CMS) (Medis, Leiden, The Netherlands). Measurements of SAL, blooming thickness, catheter–strut distance, and intimal coverage thickness were visually defined using a caliper tool. For 3-D reconstructions, the stent struts were manually segmented from each IV-OCT B-scan to form black and white images and imported into MATLAB to form a voxel 3-D array. Two-dimensional cross-sections were imported as an image sequence into ImageJ, and the 3-D Viewer function was used to reconstruct the sequence into a 3-D image. Catheter offset and strut coverage thickness data were analyzed with linear models. Data for varying %Hct were analyzed with ANOVAs with Tukey correction for multiple pairwise testing. All statistical testing were two-sided with a significance level of 5%. SAS Version 9.3 for Windows (SAS Institute, Cary, North Carolina) was used throughout. All results are expressed as (SD). We summarized intraobserver variability with the within-observer SD and interobserver agreement with the intraclass reliability coefficient, paired-data scatter plots, and Bland–Altman plots.16 3.Results3.1.Merry-Go-Rounding due to Catheter OffsetThe mean SAL of struts increases significantly with the distance between the catheter and the strut [, , ; Fig. 5(a)]. Typical B-scans are shown in Fig. 4. Fig. 5Effect of catheter–strut distance, simulated intimal hyperplasia, and blood contamination on SAL. (a) SAL versus catheter–strut distance (). (b) SAL versus thickness of strut coverage (). (c) SAL versus %Hct (). The changes in SAL due to blood scattering were greater than fourfold and greater than the changes caused by catheter offset or intimal hyperplasia. Whiskers extend to the (SD); (a) and (b) show the overlaid least square lines.  3.2.Merry-Go-Rounding due to Simulated Intimal HyperplasiaThe mean SAL of struts increases significantly with coverage thickness [, , ; Fig. 5(b)]. Typical B-scans are shown in Fig. 4. 3.3.Merry-Go-Rounding due to Blood ScatteringMicro-CT of the Xience stent strut gives a width of . Mean SAL of struts by OCT increases significantly with %Hct [ANOVA; ; Fig. 5(c)]. When compared with the Xience stent imaged in 0.9% saline (mean , struts), the mean SAL increased to ( struts), ( struts), and ( struts) for 0.25%, 0.5%, and 1% Hct, respectively [Fig. 5(c)]. All pairwise comparisons were statistically significant ( for each comparison). Typical B-scans for 0.9% saline and 1% Hct are shown in Fig. 4. The changes in SAL due to blood scattering were greater than fourfold and greater than the changes caused by catheter offset or intimal hyperplasia. 3.4.Blooming due to Blood ScatteringWhen compared with the Xience stent imaged in 0.9% saline (, ), the mean blooming thickness increased to (), (), and () for 0.25%, 0.5%, and 1% Hct, respectively (ANOVA; ; Fig. 6). All but one of the pairwise contrasts were statistically significant (); the single exception was 0.5% versus 1% (). 3.5.Three-Dimensional Merry-Go-Rounding due to Blood Scattering (“Ghost Struts”)Three-dimensional reconstructions of the micro-CT and IV-OCT images of the Xience V stent recorded at different blood Hcts are shown in Figs. 7(a)–7(c). When increasing concentrations of blood scatterers were present, longitudinal blurring of the struts caused the average longitudinal length of the six corrugated rings to increase: in 0.9% saline, in 0.25% Hct, in 0.5% Hct, and in 1% Hct. All but two pairwise contrasts were statistically significant (); the exceptions were 0.25% versus 0.5% () and 0.5% versus 1% (). Further, the total length of the stent increased from 8.15 mm in 0.9% saline to 8.55 mm in 1% Hct, while the micro-CT value for the length was 8.22 mm. With increasing %Hct, the longitudinal blurring of the corrugated rings into the adjacent B-scans of the regions containing the three embedded links created “ghost struts” [Figs. 7(d)–7(f)]. As a result, the average longitudinal length of regions involving the three embedded links ( regions) decreased from in 0.9% saline to in 0.25% Hct and in 0.5% Hct. This artifact was most apparent in 1% Hct in which there were no B-scans containing only three struts in cross-section [Fig. 7(d)]. All but one of the pairwise contrasts were statistically significant ( for each contrast); the single exception was 0.5% versus 1% (). Fig. 7Three-dimensional MGR. Micro-CT of a Xience V stent showing the five repetitive embedded link regions along the longitudinal axis (a), compared with 3-D reconstructions of OCT images of the same stent imaged in 0.9% saline (b), and 1% Hct (c). The 1% Hct causes longitudinal blurring (3-D-MGR) of the struts, causing the total length of the stent to increase from 8.15 mm (0.9% saline) to 8.55 mm (1% Hct), while the micro-CT value for the length was 8.22 mm. (d)–(f) show the corresponding B-scans from the center embedded link region of the 3-D reconstructions in (a)–(c), respectively. As seen in (f), longitudinal blurring (3-D-MGR) can introduce struts into B-scans artifactually that are not truly present (“ghost struts”), causing the number of struts in the B-scan to increase from (e) 3 when imaged in 0.9% saline to (f) 5 when imaged in 1% Hct (see white arrows).  3.6.ReproducibilityTwo observers made measurements in this study. With regard to intraobserver variability, the within-observer SD for SAL (), coverage thickness (C, ) and catheter–strut distance (D, ) were observer 1: SAL 175.3, C 77.5, and D 50.3 and observer 2: SAL 186.4, C 77.7, and D 51.2, and the intraclass reliability coefficient was SAL 0.74, C 0.52, and D 0.93. Paired data and Bland–Altman plots for SAL, C, and D (not shown) displayed approximate symmetry about the diagonal in the paired data plots and about the zero line in the Bland–Altman plots, suggesting reproducibility between observers. 4.DiscussionMany investigators have noted a correlation between catheter eccentricity and the presence of MGR.4–8 Proposed mechanisms for MGR include reduced lateral resolution due to an increased lateral distance between A-lines with an eccentric catheter position4,5 and increased laser spot size outside of the optical focal point.5,9 While these mechanisms can account for a relatively small increase in SAL (i.e., increase in SAL for a 3-mm vessel and 100-μm stent strut), they are insufficient to explain the more extreme examples of MGR commonly observed in clinical IV-OCT images, as well as MGR artifacts observed when the catheter is centered in the vessel [Figs. 1(d) and 1(f)]. We hypothesized that the optical scattering by residual blood in the flush fluid or strut coverage by intimal hyperplasia is the primary cause of MGR. We examined each of these mechanisms in isolation, as well as catheter eccentricity. Our results with light scattering from residual blood are consistent with the magnitude of more dramatic SAL elongation observed in clinical IV-OCT images (Fig. 1). We have provided results suggesting that the MGR and blooming both arise as manifestations of increased optical scattering in the space between the catheter and stent struts. Optical scattering is not only limited to two dimensions within a single B-scan, but also occurs in the third dimension, longitudinally along the pullback creating “ghost struts” between B-scans. The mechanism underlying IV-OCT blooming artifact is most commonly attributed to light saturation of the detection electronics resulting from the highly reflective surfaces of stent struts4,6,9,10 causing a spillover effect into neighboring lower-intensity pixels along the axial A-line. This mechanism suggests that the blooming is more pronounced in the absence of blood, which is known to attenuate the OCT light beam4–6,9 and would thus reduce the signal intensity of light returning from the strut surface to the catheter. However, our data presented in Fig. 6 show that the opposite effect occurs; blooming thickness increases with %Hct, more than doubling when imaged through concentrations of blood that are difficult to appreciate clinically (i.e., 0.5% Hct versus 0.9% saline). Findings reported here have significant implications for the assessment of stent strut apposition by IV-OCT. The current teaching is that in the presence of saturation-induced blooming [identified by linear streaks such as those seen in Fig. 1(b)], the true leading edge of the strut is in the center of the bloom.7,11 The current study provides new information regarding blooming in the absence of the saturation artifact. When blooming is produced by blood artifact and the stent strut is measured in the middle of the bloom, there can be an artifactual lifting of the stent strut off the vessel wall. Clinicians should be aware of this newly described artifact: blooming due to light scattering. Consistent with our hypothesis, catheter eccentricity [Fig. 5(a)] over a range of distances typical of a 3-mm vessel resulted in a minor increase in SAL, substantially less than the degree of MGR observed in clinical IV-OCT images [Figs. 1(d) and 1(f)]. The degree of MGR due to simulated intimal hyperplasia [Fig. 5(b)] was also minor and comparable with that of catheter eccentricity for the range of offsets and coverage thicknesses examined in this study. Optical scattering by low blood concentrations, however, caused a much greater MGR effect, with 1% Hct [Figs. 4(f) and 5(c)] producing SALs comparable with those observed in clinical IV-OCT images [Figs. 1(d) and 1(f)] with SAL varying from 140 to over the physiological range of %Hct [Fig. 5(c)], six times the corresponding SAL variation over the physiological range of intimal hyperplasia thickness [Fig. 5(b)], and four times the SAL variation over the range of possible catheter offset for a 3-mm vessel [Fig. 5(a)]. Increased SAL due to scattering by blood compared with intimal hyperplasia is interesting considering that our simulated intimal hyperplasia has a greater scattering strength than blood at the concentrations used in this study ( for simulated intimal hyperplasia and for 1% Hct for 1300-nm light17). The result is explained by considering that the distance over which blood scattering occurs is much greater than for the case of intimal hyperplasia. For the simulated tissue coverage, scatterers occupied a maximum axial distance of only , while blood scatterers occupied the entire axial length from the centered catheter to the struts, on the order of millimeters. The increased distance over which the scattering occurs results in a greater lateral deviation of light rays (Fig. 8). This perspective also possibly explains why many investigators have recognized a correlation between catheter offset and MGR with the implication that the subvisible scatterers are present. These scatterers positioned between the catheter and strut could be residual red blood cells incompletely removed while flushing, but also may originate in microbubbles formed through the power injection of flush-fluid during the IV-OCT image acquisition. Fig. 8Illustration of MGR light scattering mechanism by blood (a) and intimal hyperplasia (b), and 3-D-MGR light scattering mechanism by blood (c). (a, b) The yellow lines represent the path traveled by light as it is scattered away from the normal path (blue dashed lines). A greater distance over which the scattering occurs results in a greater deviation from the normal axial path of an A-line, allowing more A-lines to intersect the strut and resulting in greater MGR effects. (c) This same concept occurs longitudinally along the pullback, resulting in the appearance of ghost struts in B-scans where struts are not truly present.  Our results show that the red blood cells in the imaging field result in blooming and MGR. However, these artifacts do not occur equally, as 1% Hct caused SAL to increase fourfold, while blooming thickness only increased twofold. This is likely because MGR is an angular effect, where a scatterer closer to the catheter will result in a greater lateral deviation of a photon (Fig. 8), while blooming is instead dependent on the change in path length of the photon, making the distance of the scatterer from the catheter less important. In addition to the two artifacts discussed here (MGR and blooming), which result in the stretching of struts in the lateral and axial dimensions of a B-scan, respectively, we have also identified for the first time stretching of struts in the longitudinal direction (3-D-MGR) along the pullback (Fig. 7). Unlike blooming and MGR which alter the apparent dimensions of a strut, 3-D-MGR occurs between B-scans and can artifactually create “ghost struts” in a B-scan where no struts exist. Artifactual increases in all three dimensions due to optical scatterers are not expected to be limited to stent struts, but may extend to other features such as native plaque components. Thus, studies involving serial core lab assessments of fibrous cap thickness, lipid core regression, and bioabsorbable stent resorption could be affected if blood contamination is present. For instance, poor blood clearance can artifactually increase fibrous cap thickness measurements by ( to , paired -test, , patients) (Fig. 9). This error in measurement could impact whether fibrous caps are considered vulnerable or not. Fig. 9Artifactual increase in fibrous cap thickness due to residual blood. Two IV-OCT pullbacks were performed in the same patient minutes apart. (a) First, the power injector was underinjected (), resulting in an apparent fibrous cap thickness of (white bar). (b) The second pullback was performed to achieve proper clearance (), resulting in an apparent fibrous cap thickness of 120 (white bar). This difference represents a 25% artifactually increased fibrous cap thickness.  Our data indicate that light scattering by red blood cells results in MGR, blooming, and 3-D-MGR, suggesting that these three artifacts are manifestations of a common mechanism (light scatterers in the lumen) in the lateral, axial, and longitudinal dimensions, respectively. While blooming is clinically significant as it may be mistaken for malapposition of the stent and lead to inappropriate clinical decisions such as aggressive postdilation, erroneous measurements of SAL due to MGR distortions are unlikely to affect clinical decisions. However, the appreciation of MGR in clinical OCT images is of value, as it is easier to recognize than the other two artifacts and indicates that the scatterers may be present in the lumen, suggesting that the blooming artifact, and ghost struts, may be present in the B-scan as well. As with any in vitro phantom study, this study is limited as all conditions that occur in clinical practice are not duplicated. The simulated intimal hyperplasia made with will have different scattering properties from true intimal hyperplasia. Further, optical scattering by blood was designed to be homogenous for experimental consistency, while clinically, heterogeneous blood swirls are more commonly encountered. However, microbubbles formed during clinical contrast injection represent another source of light scattering and would be homogenous. While our study implicates optical scatterers in the imaging field to have the greatest impact on these artifacts, a discussion of the effect of confounders (such as catheter angulation relative to the vessel axis and changing vessel size) on these findings will require further research. Finally, our correlation coefficients regarding the impact of catheter offset and intimal hyperplasia on MGR ranged from 0.39 to 0.68 deserve further explanation. As described in Fig. 2, an OCT beam which only partially touches a strut can result in the strut being interpolated over the whole spot size. With our OCT beam profile and phantom vessel of 3-mm diameter, this effect can change the SAL by up to and may account for the variability of our data. In the case of simulated intimal hyperplasia, inhomogeneities of the mixture may be the cause of variability. In conclusion, previously proposed mechanisms cannot account for the magnitude of MGR observed in clinical IV-OCT images. We have demonstrated that the MGR and blooming both arise from a newly described and common mechanism, optical scattering, and that the subvisible concentrations of residual blood in the flush fluid result in MGR artifacts comparable with the degree observed in clinical IV-OCT images. We also describe 3-D-MGR for the first time, which may be a source of “ghost struts” as a newly described OCT artifact. Of clinical concern, MGR has a significant effect at levels of blood contamination that are not apparent to the operator, which emphasizes the importance of reducing potential contamination during image acquisition. Careful consideration of flushing parameters, including the use of viscous flush medium (i.e., Visipaque™ or dextran 40), to adequately clear blood from the lumen should be performed. Further, subjective assessment of stent apposition without careful consideration of MGR and blooming could lead to unnecessary and potentially harmful postdilatation following stent deployment. AcknowledgmentsThis work was supported by the South Texas Veterans Health Care System (VA Merit Grant, San Antonio, Texas), the Janey and Dolph Briscoe Center for Cardiovascular Research (San Antonio, Texas), Volcano Corporation (San Diego, California), and the Clayton Foundation for Biomedical Research (Houston, Texas). Disclosures: None. ReferencesM. Terashimaet al.,
“Accuracy and reproducibility of stent-strut thickness determined by optical coherence tomography,”
J. Invasive Cardiol., 21
(11), 602
–605
(2009). 1042-3931 Google Scholar
S. Taharaet al.,
“Optical coherence tomography endpoints in stent clinical investigations: strut coverage,”
Int. J. Cardiovasc. Imaging, 27 271
–287
(2011). http://dx.doi.org/10.1007/s10554-011-9796-3 1569-5794 Google Scholar
P. Barliset al.,
“Quantitative analysis of intracoronary optical coherence tomography measurements of stent strut apposition and tissue coverage,”
Int. J. Cardiol., 141 151
–156
(2010). http://dx.doi.org/10.1016/j.ijcard.2008.11.204 IJCDD5 0167-5273 Google Scholar
H. G. Bezerraet al.,
“Intracoronary optical coherence tomography: a comprehensive review: clinical and research applications,”
J. Am. Coll. Cardiol. Interventions, 2 1035
–1046
(2009). http://dx.doi.org/10.1016/j.jcin.2009.06.019 19368798 Google Scholar
N. Suzukiet al.,
“The impact of an eccentric intravascular ImageWire during coronary optical coherence tomography imaging,”
Eurointervention, 6 963
–969
(2011). http://dx.doi.org/10.4244/EIJV6I8A167 1774-024X Google Scholar
H. C. Loweet al.,
“Intracoronary optical diagnostics: current status, limitations, and potential,”
J. Am. Coll. Cardiol. Interventions, 4 1257
–1270
(2011). http://dx.doi.org/10.1016/j.jcin.2011.08.015 19368798 Google Scholar
E. A. Mehannaet al.,
“Assessment of coronary stent by optical coherence tomography, methodology and definitions,”
Int. J. Cardiovasc. Imaging, 27 259
–269
(2011). http://dx.doi.org/10.1007/s10554-010-9793-y 1569-5794 Google Scholar
G. Ferranteet al.,
“Current applications of optical coherence tomography for coronary intervention,”
Int. J. Cardiol., 165 7
–16
(2013). http://dx.doi.org/10.1016/j.ijcard.2012.02.013 IJCDD5 0167-5273 Google Scholar
G. J. Tearneyet al.,
“Consensus standards for acquisition, measurement, and reporting of intravascular optical coherence tomography studies: a report from the International Working Group for intravascular optical coherence tomography standardization and validation,”
J. Am. Coll. Cardiol., 59 1058
–1072
(2012). http://dx.doi.org/10.1016/j.jacc.2011.09.079 JACCDI 0735-1097 Google Scholar
F. Pratiet al.,
“Expert review document: part 2, methodology, terminology and clinical applications of optical coherence tomography for the assessment of interventional procedures,”
Eur. Heart. J., 33 2513
–2520
(2012). http://dx.doi.org/10.1093/eurheartj/ehs095 EHJODF 0195-668X Google Scholar
A. Murataet al.,
“Accuracy of optical coherence tomography in the evaluation of neointimal coverage after stent implantation,”
J. Am. Coll. Cardiol. Imaging, 3
(1), 76
–84
(2010). http://dx.doi.org/10.1016/j.jcmg.2009.09.018 Google Scholar
T. Kuboet al.,
“Diagnostic accuracy of CT angiography to assess coronary stent thrombosis as determined by intravascular OCT,”
J. Am. Coll. Cardiol. Imaging, 4
(9), 1040
–1043
(2011). http://dx.doi.org/10.1016/j.jcmg.2011.02.024 Google Scholar
S. Elahi,
“IVOCT imaging artifacts of coronary stents,”
University of Texas at Austin,
(2013). Google Scholar
M. Essenpreis,
“Thermally induced changes in optical properties of biological tissues,”
(1992). Google Scholar
W. F. Cheong,
“Photo-thermal processes in tissue irradiated by Nd:YAG laser (1064 nm, 1320 nm),”
University of Texas at Austin,
(1990). Google Scholar
J. W. BartlettC. Frost,
“Reliability, repeatability and reproducibility: analysis of measurement errors in continuous variables,”
Ultrasound Obstet. Gynecol., 31 466
–475
(2008). http://dx.doi.org/10.1002/(ISSN)1469-0705 0960-7692 Google Scholar
J. Kalkmanet al.,
“Multiple scattering effects in Doppler optical coherence tomography of flowing blood,”
Phys. Med. Biol., 57 1907
–1917
(2012). http://dx.doi.org/10.1088/0031-9155/57/7/1907 PHMBA7 0031-9155 Google Scholar
BiographyJ. Jacob Mancuso received his medical degree at University of Texas Health Science Center at San Antonio’s School of Medicine in 2005. He completed his internal medicine residency (2008), cardiovascular diseases (2011) and interventional cardiology fellowships (2013) at University of Texas Health Science Center. He is board certified in internal medicine, cardiovascular disease, interventional cardiology and endovascular medicine, a member of the ACC and SCAI. He joined the Cardiology Clinic of San Antonio in 2013. David L. Halaney received his BS degree in biology from Trinity University, San Antonio, Texas, in 2011. He is currently employed as a research assistant at the University of Texas Health Science Center in San Antonio. Sahar Elahi received her PhD in biomedical engineering from the University of Texas at Austin in 2014. She is currently employed at the Research Foundation for Mental Hygiene, Inc., New York, where she works developing algorithms to perform automatic image processing of magnetic resonance imaging (MRI) images of the brain. Derek Ho received his BS in biomedical engineering from the University of Texas at Austin in 2013. He is currently a PhD candidate in the BIOS lab at Duke University, where his research focuses on designing a combined a/LCI and m/LCI system for early detection of cervical dysplasia, and developing a wavelet based nuclear sizing method for analyzing a/LCI angular scattering profiles. Tianyi Wang received his PhD in biomedical engineering from the University of Texas at Austin in 2012. He is currently a research associate at the University of Texas at Austin, developing a multimodal optical coherence tomography (OCT) system for enhanced characterization of atherosclerotic lesions. Yongjian Ouyang received his BS in electrical and electronics engineering from the Nanjing University of Information Science and Technology in 2004, and his MS in applied statistics from the University of Texas at San Antonio in 2009. He is currently employed by Reliant Energy, where he works as an IT developer and data analyst. Jouke Dijkstra received his PhD degree in engineering from the Wageningen University, Netherlands, in 1994. He is currently an associate professor in medical imaging processing heading the vascular and molecular imaging section in the Department of Radiology at Leiden University Medical Center, Netherlands. One of the research interests is the quantitative analysis of optical coherence tomography (OCT) images. Thomas E. Milner received his PhD degree in optical sciences from the University of Arizona (1991). After working as a research faculty member at the Beckman Laser Institute and Medical Clinic (1992-1997), he joined the engineering faculty at the University of Texas in Austin (1998), where he currently resides. His research is directed toward the development of novel optical tomographic imaging modalities and laser surgical procedures for diagnosis and treatment of disease in humans. Marc D. Feldman received his MD from the University of Pennsylvania School of Medicine in 1981. Since 1998, he has served as faculty at the University of Texas Health Science Center at San Antonio, where he practices interventional cardiology and leads a research lab focusing on the use of optical coherence tomography to predict subsequent rupture of atherosclerotic plaques and myocardial infarction. |