

|
|
1.IntroductionDiffuse optical imaging (DOI) techniques, which use two or more wavelengths of near-infrared light to image changes in oxyhemoglobin and deoxyhemoglobin concentrations (HbO and HbR respectively), are continuing to become more technically advanced, more accurate, and more widely applicable.1–3 Although diffuse optical techniques are successfully being used to study a variety of clinical conditions in a variety of patients,4–7 their most common and fastest growing application is the study of functional brain activation.8,9 In this context, functional activation refers to the local changes in HbO and HbR that occur as a reaction to the increased metabolic activity of groups of neurons that are responsible for the processing of a given cognitive task or stimulus. The classical hemodynamic response function signal consists of a localized increase in HbO and a smaller, colocated, simultaneous decrease in HbR.10 This behavior is consistent with the localized vasculature system over-compensating for the increase in neuronal oxygen demand by initiating a large influx of oxygenated blood. Near-infrared spectroscopy (NIRS), the forerunner to DOI, usually employs two wavelengths of light and allows measurements of changes in HbO and HbR in a channel-wise (rather than imaging) domain. Since the invention of NIRS, there have been a number of investigations which have aimed to determine which two wavelengths provide the most accurate measurements of HbO and HbR. These studies have typically used analytical approaches to minimize the cross talk between the measurements at each wavelength, to ensure that a change in concentration of one chromophore does not give rise to an erroneous measurement of a change in concentration of the second chromophore.11–14 These studies broadly concluded that the first wavelength should be in the range of 650 to 750 nm, whereas the second should be 820 nm or higher. Diffuse optical tomography systems can be divided into three categories based on the data they acquire. Continuous wave (CW) systems are the most common and least expensive. They use continuously illuminated sources and provide a measure of change in intensity for each wavelength and channel. Frequency domain systems employ intensity-modulated sources, so that both the change in amplitude and change in phase resulting from an alteration in the optical properties of the target can be recorded. Last, time-domain systems use picosecond laser pulses and high temporal resolution detectors to measure the time-of-flight of photons across a region of tissue, allowing a number of data-types to be calculated including amplitude, phase, and mean time-of-flight.15 The process of reconstructing images of changes in HbO and HbR, which is central to DOI, requires a model of the geometric and optical properties of the target object. A forward model that relates changes in optical properties to changes in the measurement space is produced using knowledge of photon transport.16 This model can then be inverted to transform from the measured data to an image of changes in optical properties. CW systems are limited by their inability to separate signal changes due to an alteration of scatter from those due to an alteration of absorption.17,18 Images of functional changes in HbO and HbR reconstructed from CW systems will, therefore, be predicated on the assumption that scatter remains constant. The simplest approach to reconstruct HbO and HbR images is to produce a forward model for each wavelength and independently reconstruct images of the change in absorption coefficient. Two or more of these images can then be linearly combined using the relevant specific absorption spectra to produce images of changes in HbO and HbR.19 This approach, however, includes a number of sources of error. A more optimal, multispectral approach was introduced by Corlu et al.20 This approach constructs a multispectral forward model of chromophore concentration and wavelength-independent scattering properties for multiple wavelengths and inverts it in a single process. This direct reconstruction means that the number of unknowns remains constant as the number of wavelengths increases, thus a greater number of wavelengths will typically result in a more accurate reconstruction.20 Corlu et al. also introduced an analytical method for optimizing wavelength selection. This method sought to minimize cross talk between the optical properties of absorption and scatter, while maximizing the separation of HbO and HbR. Correia et al.21 extended this optimization process further. By using a three-layer slab to simulate the adult head, sensitivity profiles for a range of wavelengths were computed and the spatial overlap of these profiles was introduced as an additional parameter that should be maximized for optimal wavelength selection. Using this criterion in addition to those employed by Corlu et al., Correia et al. reported that the optimum combinations of 3 and 4 wavelengths were [] and , respectively. Although theoretical assessments are extremely valuable, particularly when used to design new DOI systems, they cannot account for experimental factors that may affect the efficacy of certain wavelengths or combinations of wavelengths. Laser source power, system transmission, and detector efficiency can all be wavelength dependent. In addition, although the level of absorption of a given wavelength of light in tissue can be modeled, the effect on the signal-to-noise ratio (SNR) for real DOI channels is difficult to simulate. Wavelengths at the lower end of the near-infrared (NIR) range are more heavily absorbed by human tissues because of the spectra of hemoglobin and the effect of the pigment melanin. In practice, this can mean that there is simply not enough light reaching the detector to provide a meaningful measurement. With these considerations in mind, we designed an experiment using the second generation of University College London’s (UCL) time-domain optical tomography system, MONSTIR II, to allow a data-driven approach to wavelength selection. This approach can then be directly compared to the theoretical results of previous studies. 2.Methods2.1.MONSTIR II and System ApplicationThe second generation of UCL’s multichannel optoelectronic NIR system for time-resolved image reconstruction (MONSTIR II) employs a supercontinuum laser source (Fianium Ltd., Southampton, United Kingdom) and 32 independent photomultiplier tube (PMT) detector channels.22 The laser output, consisting of light pulses at 40 MHz, is routed through an acousto-optic tunable filter and switched into one of 32 source fibers. The end of each source fiber is embedded coaxially within a 4-mm diameter detector fiber bundle and coupled to the target object. The remaining end of each detector bundle is then connected to one of the 32 detector channels. Variable optical attenuators, located between the detector bundle and the photocathode of each PMT, allow the intensity of light incident on each PMT to be optimized for each source–detector combination. During an imaging sequence, each source position on the target object is illuminated in turn, whereas all other channels act as detector locations. During each illumination, the acousto-optic tunable filter is switched between four different wavelength settings so that the target object is illuminated at each wavelength for the same period of time. A full imaging sequence is completed once all source locations have been illuminated. For each wavelength and source–detector pair, MONSTIR II produces a temporal-point spread function (TPSF); a histogram of photon travel times through the target object. In order to obtain a sufficient number of samples to build up these histograms, it is necessary to acquire photons from several million input pulses at each of the 4 wavelengths, which in practice means illuminating each source position for several seconds. The MONSTIR II system is described in greater detail in Cooper et al.22 For this study of adult functional activation, 10 optical fiber bundles were positioned so as to cover the left motor cortex. The holes in the head cap into which each connector was fixed were located around the 10-20 scalp location C3. The layout of the imaging array is depicted in Fig. 1. Over the course of each imaging sequence, 2 of the 10 positions were used, in turn, as source locations. During the illumination of each source location, the remaining 9 positions served as detectors. For each imaging sequence, we acquired data from 18 channels at 4 wavelengths (72 TPSFs). Fiber locations were chosen to provide a range of source–detector separations from 27.5 to 55 mm. The fibers were held in place using custom built plastic connectors each containing a 5-mm glass prism (Thorlabs, Inc., United Kingdom), which were coupled to a flexible head cap (EasyCap GmbH, Germany). These prism connectors were designed to allow the fiber bundles to lie flat against the surface of the head while also fitting into the head cap. 2.2.Experimental DesignAs MONSTIR II is limited to 4 wavelengths per imaging sequence, obtaining high quality functional activation data at a greater number of wavelengths required a careful experimental design. The functional task we chose to employ was a simple right-hand finger tapping task that has been used repeatedly in DOI studies to elicit a functional response.8 Four right-handed male subjects (median age 35.5 years, range 15 years) participated in the study. Written informed consent was obtained prior to the experiment. In order to balance the duration of the experiment with the number of wavelengths employed, images were obtained at 12 wavelengths divided into 3 sets of 4: [710, 770, 810, 850], [690, 750, 790, 830], and [730, 740, 840, 870]. Each of the two source locations was illuminated for 5 s, with this time being divided equally between the 4 wavelengths in 100-ms intervals. A full imaging sequence at any one of the 3 sets of 4 wavelengths took 10 s. The order in which the two source positions were illuminated was alternated in order to remove any potential bias. This resulted in six different imaging sequences (3 sets of wavelengths, 2 illumination orders). For each of the six imaging sequences, the functional task was repeated five times. During each repetition, one imaging sequence was performed where the subject remained at rest. Once this sequence was completed, an auditory cue was used to instruct the subject to begin the finger-tapping task. After 4 s of the task, a second imaging sequence was initiated. Once this sequence was completed another auditory cue instructed the subject to stop tapping. The time between the end of each finger-tapping task and the beginning of the next rest sequence was randomized between 20 and 30 s. The period of data acquisition, including some additional rest periods when changing the imaging sequence, lasted . A significant period of time was required prior to data acquisition to adjust the head cap and the subject’s hair to ensure good optical contact between the scalp and each optical fiber. 2.3.Data Preprocessing, Head-Model and Image ReconstructionThe experiment yielded a total of 2160 TPSFs (5 task repetitions, 2 illumination orders, 18 channels, and 12 wavelengths) per subject for both active (during finger tapping) and rest (prior to finger tapping) states. The TPSFs were averaged over the 5 task repetitions and 2 illumination orders before being background corrected, resulting in 216 mean TPSFs for both active and rest states. The raw data from each channel were visually inspected for unusual features, such as prepeaks (which are typically caused by light passing from the end of the source fiber to the detector fiber without travelling through tissue) or abnormally high background noise. Channels displaying such features were removed from further analysis. To eliminate unacceptably noisy data, channels which exhibited a standard deviation of the mean time of flight greater than 15 ps ( path deviation) were removed. Log-amplitude and phase data-types were then computed from these mean TPSFs using the methods described by Hebden et al.23 Phase data extracted at 100 MHz was corrected for phase wrapping. To allow meaningful image reconstruction, we built a 5 layer adult head model based on the ICBM 2009c nonlinear asymmetric MRI atlas.24 The scalp and skull layers were extracted from the average T1 MRI images using the methodology proposed by Perdue et al.25 Combined with the segmentations present in the ICBM atlas, this yielded a 5-part tissue mask (scalp, skull, cerebrospinal fluid, gray matter, and white matter) with a voxel size of . The Iso2Mesh package26,27 was then applied to produce a 5 layer tetrahedral volume mesh and a cortical surface mesh from the tissue mask. The resulting adult head model package, containing the tissue mask, volume, and surface meshes, is now freely available at Ref. 28. Values of the absorption coefficient () and reduced scattering coefficient () were estimated for each tissue type and at each of the 12 wavelengths used in this study by taking the available measurements for each tissue type13,29,30 and performing a linear fit to these data over the wavelength range 690 to 870 nm. Although this relationship is clearly not linear, this approach is likely the best available. The refractive index was taken as 1.4 for all tissues. Using the tetrahedral head mesh, optical fiber locations and tissue optical properties, we used the TOAST image reconstruction package16 to compute a forward model for each of the 12 wavelengths. This process produced 12 Jacobian matrices of dimensions , where is the number of mesh nodes and 36 is the number of channels (18) multiplied by the number of data-types (amplitude and phase). Each Jacobian matrix maps a change in absorption coefficient in the mesh space to a change in amplitude and phase in the measurement space, within the limits of a linear approximation. Images of changes in HbO and HbR were calculated using the multispectral image reconstruction approach.20,21 A multispectral Jacobian was compiled to allow direct reconstruction of images of concentration change to be performed for wavelengths such that: where is the Jacobian matrix for wavelength , and are the specific absorption coefficients at wavelength for HbO and HbR, respectively, and are the changes in log-amplitude and phase data values between the active and rest states for channel c and wavelength , and and are vectors of length corresponding to the nodal images of changes in HbO and HbR, respectively. The absorption coefficient spectra for oxy- and deoxyhemoglobin were those acquired by Matcher et al.31The multispectral Jacobian was inverted using a standard pseudoinverse approach with zeroth-order Tikhonov regularization. The regularization parameter was chosen by inspection of the gold standard image for each subject and then fixed for all reconstructions for that subject. In all cases, the regularization parameter was of the order of 1% of the maximum singular value of the multispectral Jacobian.32 The Jacobian and data for each channel were normalized by the standard deviation of the amplitude and phase data across all 12 wavelengths. To improve computational performance, each Jacobian was mapped from the tetrahedral head mesh to a regular grid of dimensions using TOAST. Reconstructed images of changes in HbO and HbR were then mapped back to the tetrahedral head mesh. To simplify image presentation and to isolate functionally induced changes, the cortical changes in HbO and HbR were extracted from the tetrahedral head mesh by assigning each node in the cortical surface mesh an image value equal to the mean over a 3-mm spherical kernel in the tetrahedral volume mesh centered at the location of the surface mesh node. The resulting images of the cortical changes in HbO and HbR were then used in the analysis of wavelength selection. 2.4.Wavelength OptimizationOur approach to determine the optimum selection of wavelengths was based on the assumption that the case where all 12 wavelengths are used to reconstruct images of the concentration changes of HbO and HbR will produce images that are, within the limits of our experiment, maximally accurate. For each subject, “gold standard” images of HbO and HbR were calculated using all 12 wavelengths. In addition, for every possible combination of 2, 3, and 4 wavelengths from the set of 12 (corresponding to 66, 220, and 495 combinations, respectively) we computed the corresponding cortical HbO and HbR images. In order to determine the optimum combinations of wavelengths on a group level, average images were calculated. Prior to calculating average images, it was first necessary to undertake a process of normalization. Normalizing the subject images prior to averaging ensured that each subject’s data contributed equally to the analysis, so as not to bias the results in favor of the subject with the strongest functional response. The necessity of this process is particularly clear in our data set because the functional response of subject 1 was greater in magnitude than that of the other subjects. A normalization process is also necessary because functional activation typically exhibits a larger increase in HbO than decrease in HbR, therefore, any efforts to select optimum wavelengths will be biased toward the wavelengths which are most suitable for HbO image reconstruction at the expense of the accuracy of the HbR image. To account for these effects, all HbO and HbR combination images produced for each subject were divided by the maximum absolute value of that subject’s gold standard HbO and HbR images, respectively. We refer to these images as “relative” in comparison to the normalized gold standard images. The relative HbO and HbR images were averaged across all possible combinations, yielding group average cortical HbO and HbR images for the 12 wavelength gold standard, 66 combinations of 2 wavelengths, 220 combinations of 3 wavelengths, and 495 combinations of 4 wavelengths. We then calculated the mean-squared error (MSE) between the group average HbO images for every combination of 2, 3, and 4 wavelengths and the group average gold standard HbO image. Similarly, we calculated the MSE between the group average HbR images for every combination of 2, 3, and 4 wavelengths and the group average gold standard HbR image. In addition, we also calculated the MSE between the group average HbO and HbR images in combination, (i.e., a concatenated matrix [HbO, HbR]; the total error across both image types when equally weighted, henceforth referred to as HbAll) and the group average gold standard equivalent. All possible combinations of wavelengths could then be ranked in order of the MSE they give rise to, which allowed the combinations that produce images most similar to the gold standard images to be identified. To improve the sensitivity of the MSE measurement, values were only calculated for cortical nodes to which the imaging array was sensitive: i.e., nodes where the sum over rows of the average Jacobian for all 12 wavelengths exceeded 0.1% of the maximum. The cortical sensitivity distribution for the mid-wavelength 770 nm (i.e., the sum over rows of ), with optode locations superimposed, is shown in Fig. 1. 3.ResultsPreprocessing resulted in the removal of 4 channels from subject 1, 4 channels from subject 2, 3 channels from subject 3, and 2 channels from subject 4. As a result, we retained to 90% of the data across all subjects for further processing. Figure 2 shows the mean percentage change in intensity between the active and rest states as a function of wavelength for a representative subject. The normalized 12 wavelength gold standard image for each subject and the group average images are shown in Fig. 3. As expected from a functional response, each subject shows a localized increase in HbO (with an average peak of ) and a smaller, colocalized decrease in HbR (average peak of ) occurring over the left motor strip in response to the right-handed motor task. Fig. 2Average change in intensity between active and rest states for 16 channels at all 12 wavelengths. Two of the 18 channels were removed due to experimental confounds in this subject.  Fig. 3Normalized, gold standard (i.e., 12 wavelength) reconstructed images of changes in cortical concentrations of HbO and HbR for each individual subject during the right-handed finger-tapping task. Each of the 10 images are normalized to their maximum absolute value. The actual peak HbO and HbR concentration changes for each subject are as follows: subject 1: , ; subject 2: , ; subject 3: , ; subject 4: , ; average: , .  Figure 4 depicts the group average gold standard 12 wavelength images for HbO and HbR in the top row, and in the proceeding rows shows the 4, 3, and 2 wavelength relative group average images for both HbO and HbR, where the wavelength combination used to reconstruct the images was determined by which HbAll matrix exhibited the lowest MSE in relation to the group average gold standard HbAll matrix. Using this criteria, the best combinations of 4, 3, and 2 wavelengths were [730, 770, 810, 850], [770, 790, 850], and [770, 810] nm, respectively. These best-case images show remarkable consistency with the 12 wavelength images, particularly for HbO. Figure 5 follows a similar format to represent the opposite extreme, depicting the group average gold standard 12 wavelength images for HbO and HbR in the top row, and subsequently the 4, 3, and 2 wavelength group average HbO and HbR images where the wavelength combination used to reconstruct the images was determined by which HbAll matrix exhibited the highest MSE in relation to the group average gold standard HbAll matrix. The worst 4, 3, and 2 wavelength combinations were [830, 840, 850, 870], [840, 850, 870], and [840, 870] nm, respectively. Fig. 4The best reconstructed relative images of group average changes in cortical concentrations of HbO and HbR. Results are shown for the HbO and HbR images of the gold standard 12 wavelength case, and for the combinations of 2, 3, and 4 wavelength relative images which yielded the best HbAll results [i.e., lowest mean squared error (MSE)] relative to the gold standard. The associated HbAll MSE values (a.u.) are also presented. 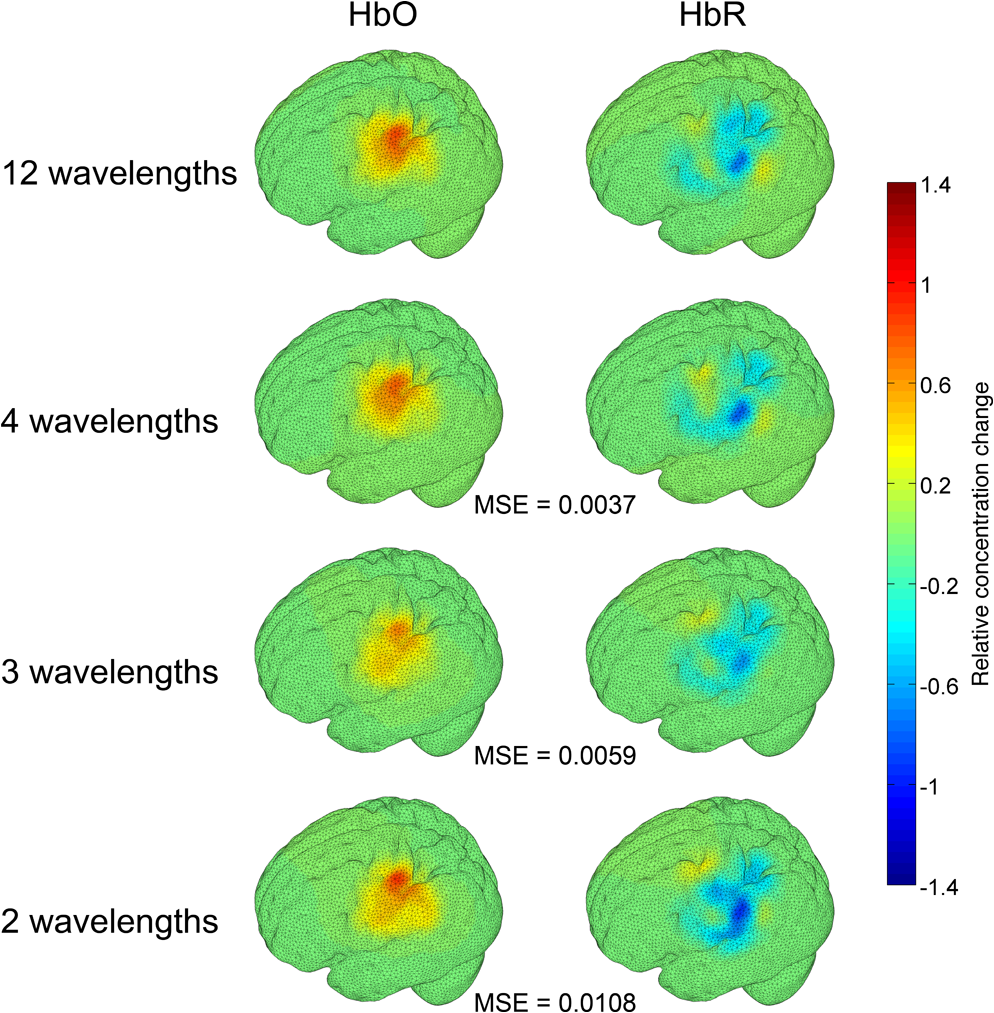 Fig. 5The worst reconstructed relative images of group average changes in cortical concentrations of HbO and HbR. Results are shown for the HbO and HbR images of the gold standard 12 wavelength case, and for the combinations of 2, 3, and 4 wavelength relative images which yielded the worst HbAll results (i.e., highest MSE) relative to the gold standard. The associated HbAll MSE values (a.u.) are also presented.  Figure 6 depicts the 10 combinations of 2 wavelengths which yielded the lowest MSE and the 10 combinations that yielded the highest MSE between the relative group average HbAll matrices and the group average gold standard HbAll matrix. The MSE values associated with each combination are shown in the lower panel. Figures 7 and 8 show the same arrangement of best and worst combinations for the HbAll matrices with their associated error values, but for 3 and 4 wavelengths, respectively. Figure 9 shows the best 10 and worst 10 combinations of 4 wavelengths along with their associated MSE values for the HbO images, whereas Fig. 10 shows the same arrangement for the 4 wavelength HbR images. Fig. 6The 10 best and 10 worst combinations of 2 wavelengths, ordered by HbAll MSE are shown in (a), whereas the associated MSE values are shown in (b).  Fig. 7The 10 best and 10 worst combinations of 3 wavelengths, ordered by HbAll MSE are shown in (a), whereas the associated MSE values are shown in (b). 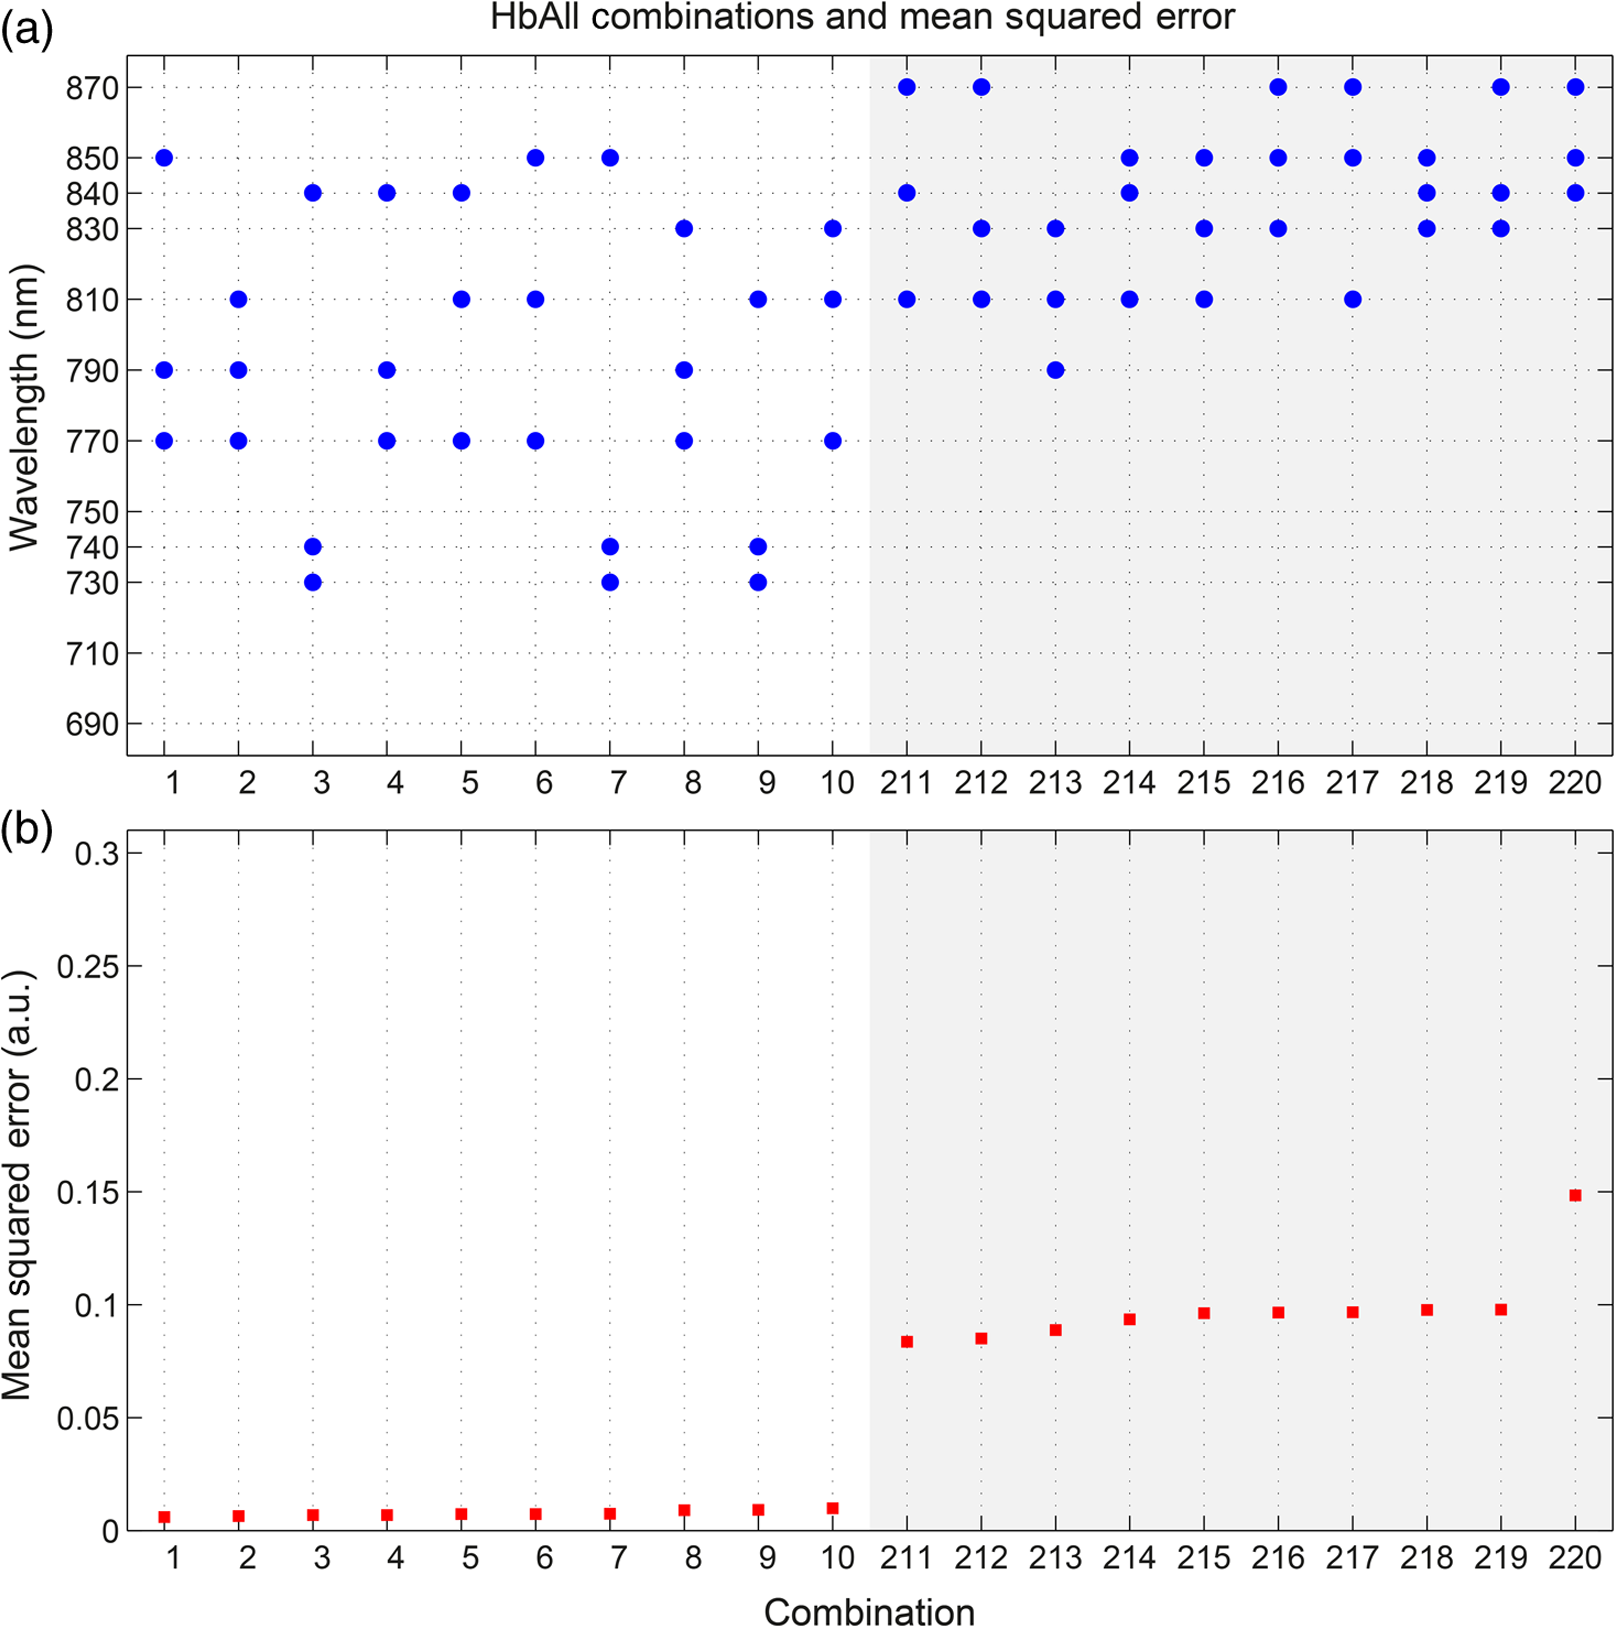 Fig. 8The 10 best and 10 worst combinations of 4 wavelengths, ordered by HbAll MSE are shown in (a), whereas the associated MSE values are shown in (b). 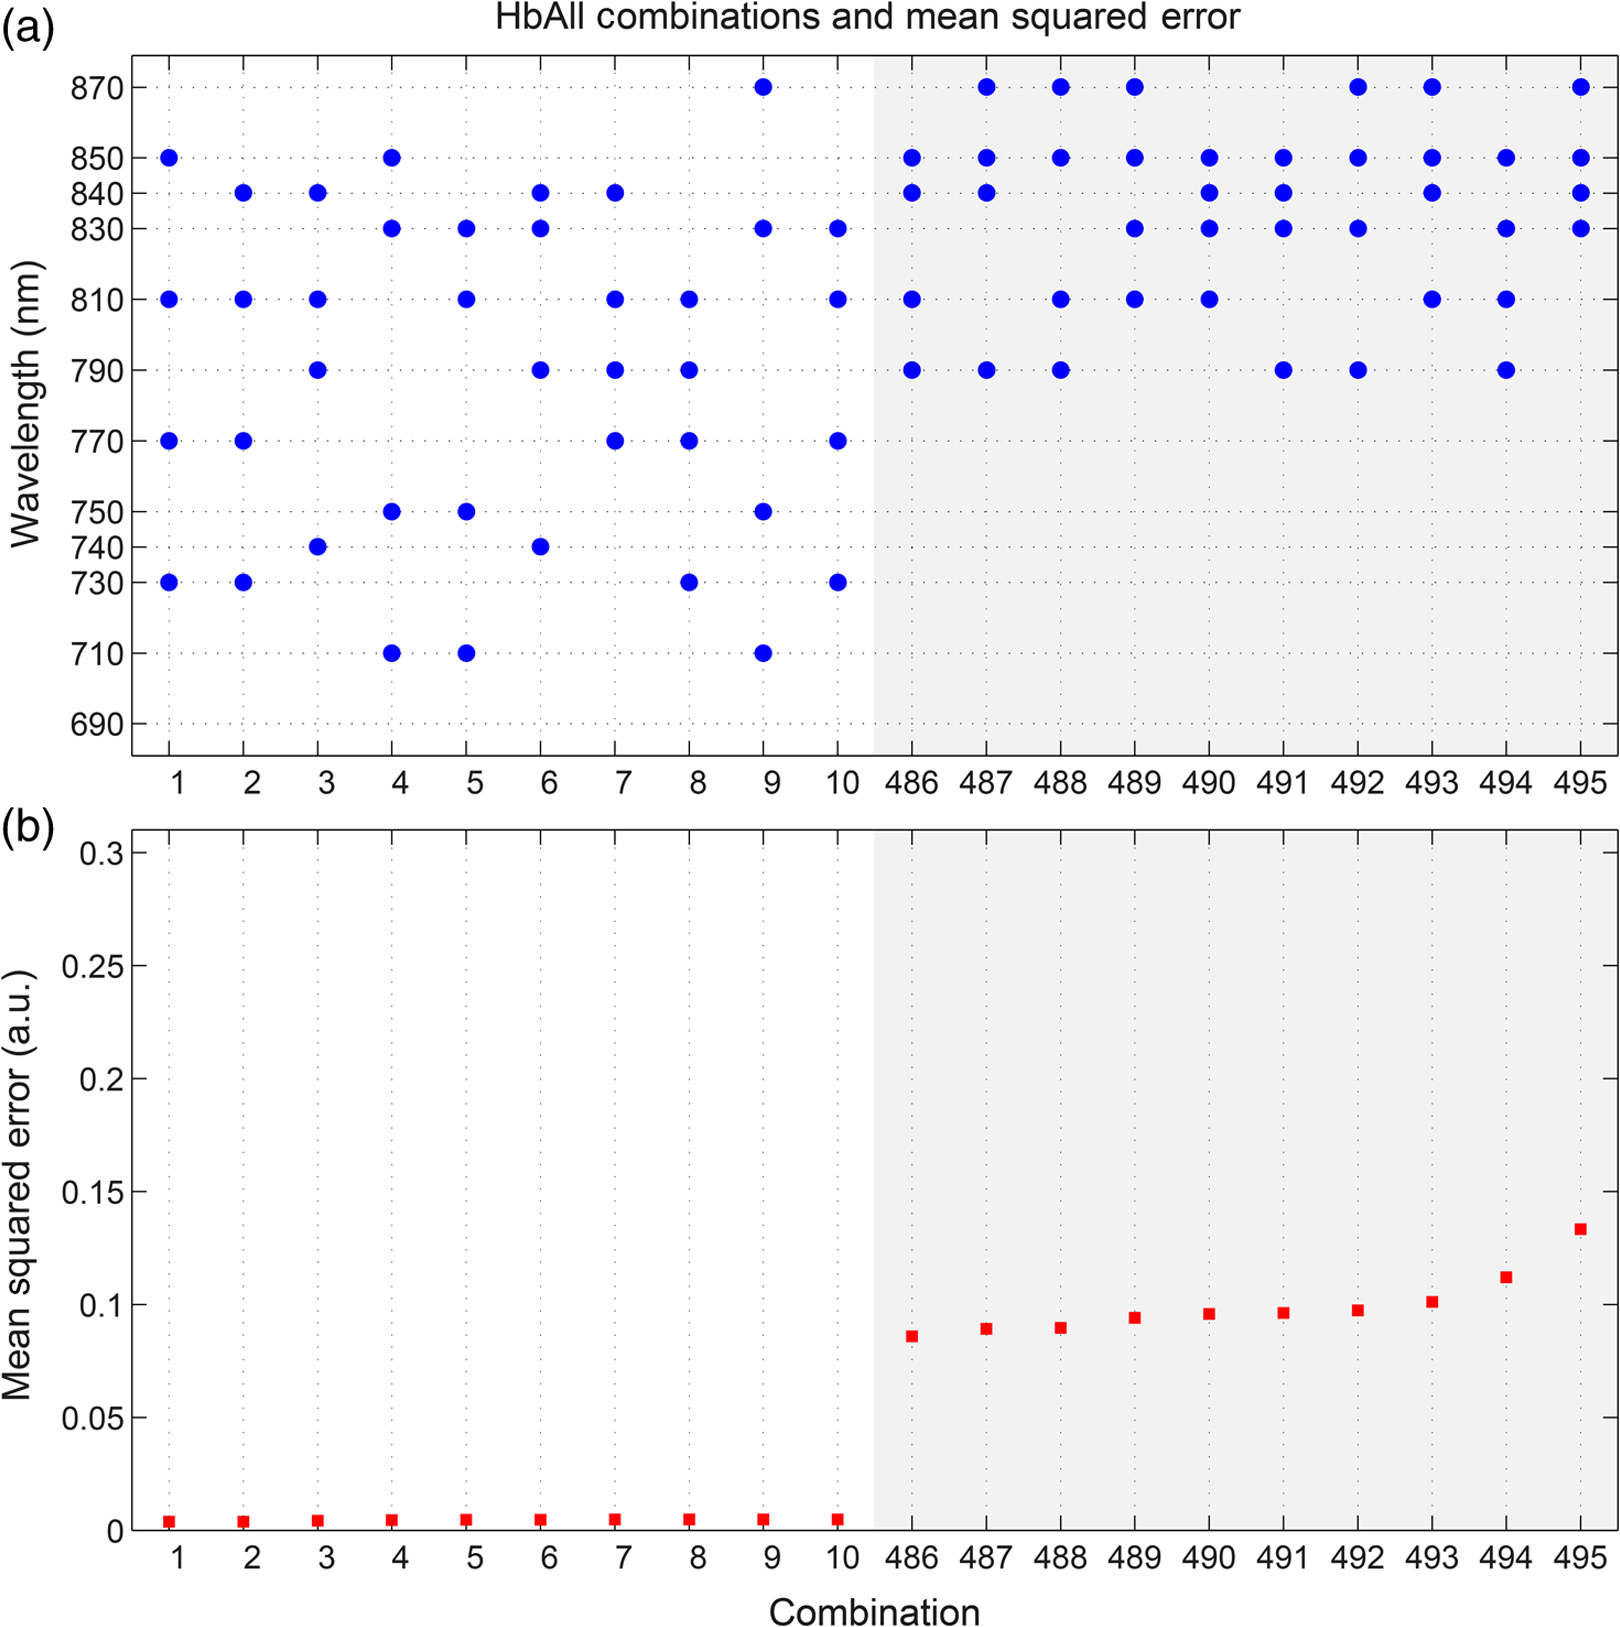 4.DiscussionOur results exhibit a number of features which are expected, given knowledge of the specific absorption spectra of HbO and HbR. This is particularly clear from Figs. 9 and 10, which show the combinations of 4 wavelengths which produce the best and worst relative HbO and HbR images, respectively. The best combinations for creating HbO images consistently include at least 2 wavelengths above the isosbestic point, and the majority of the best combinations for creating HbR images include at least 2 or 3 wavelengths below the isosbestic point. The majority of the best combinations for the 2, 3, and 4 wavelength matrices of HbAll all contain 770 nm, implying this wavelength’s position in the specific absorption spectra works well for resolving changes in both chromophores. In general, for reconstructing accurate images of both HbO and HbR, a dispersed selection of wavelengths across the NIR range, both above and below the isosbestic point, is essential. The worst 4 wavelength combinations for HbO and HbR also agree well with theory. The worst combinations for the HbO images are all below 770 nm, where the specific absorption coefficient for oxyhemoglobin is lower than that of deoxyhemoglobin. Similarly, the worst combinations for HbR images all contain wavelengths equal to or above 790 nm, the part of the NIR spectrum where the specific absorption coefficient of deoxygenated hemoglobin is lower than that of oxygenated hemoglobin. Figure 5 demonstrates that the worst HbR images represent cross talk, i.e., they mimic the HbO response. In comparison, the worst HbO images, though weaker in strength than the gold standard image, still maintain the same general shape and a positive value. This observation is almost certainly because the increase in HbO concentration during a functional response is significantly larger than the associated decrease in HbR concentration. For those building optical imaging systems or choosing between wavelengths for their imaging studies, the results of the HbAll MSE comparison are the most relevant as they dictate which wavelengths should be selected in order to achieve an equal balance between the accuracy of HbO and HbR images. Of the best 10 combinations of 4 wavelengths for HbAll, 9 have 2 wavelengths below and 2 wavelengths above the isosbestic point, which appears to provide a balance between the accuracy of HbO and HbR images. This result is clearly theoretically supported by the shape of the specific absorption spectra for the two chromophores. Our normalization procedure removes the scaling bias that would favor the HbO images over HbR images in the selection of wavelengths, but does not affect the SNRs of the HbO or HbR signals. Consequentially, the HbAll results tend to be dominated by the component with the higher error (i.e., the most noise or lower SNR), which in this instance is the HbR image. For example, the worst HbR combination images have a much higher MSE than the worst HbO combination images (0.26 versus 0.052 a.u. respectively for the 4 wavelength images), and the HbAll MSE values are in between the two (0.13 a.u. for the worst 4 wavelength image). These results indicate that when selecting wavelengths with the intention of reconstructing both HbO and HbR images, one should choose wavelengths that favor HbR. In practice, this compromise is not an issue, since the HbO image is relatively robust to wavelength selection. In addition (and as the best wavelength distributions in Figs. 8–10 demonstrate), for every chromophore the most accurate images are created by using a spread of wavelengths over the NIR range. The minimum and maximum MSE values increase for every image type (HbO and HbR, as well as the HbAll matrix) from the 4, to 3, to 2 wavelength combinations. As can be seen by comparing Figs. 4 and 5, the MSE drops significantly when one moves from the 2 wavelength to the 3 wavelength case (for example, from 0.011 to 0.0059 a.u. respectively for HbR). However, there is a smaller reduction in MSE from the 3 wavelength to the 4 wavelength images (0.0059 to 0.0037 a.u. respectively for HbR), implying that having a DOI system that emits at three different wavelengths may be the optimal balance between efficiency, cost, and image reconstruction accuracy. There are also some features of our results which could not be predicted by theoretical approaches. Figure 6 shows that the 2 wavelengths that yield the smallest error for the HbAll matrix are 770 and 810 nm, which are closer together on the NIR spectrum than previous investigations of wavelength selection for NIRS21 (though more typically combinations such as 770 and 850 nm also produce similarly accurate reconstructions). Furthermore, the combination of 770 and 790 nm also produces a low MSE, despite both wavelengths being below the isosbestic point. An additional unexpected result that can be seen throughout the data is that the majority of the best wavelength combinations do not include the wavelengths at the top and bottom of our wavelength range (i.e., 690 and 870 nm), which means the optimal images are not necessarily produced by using wavelengths with the largest range across the NIR spectrum. For example, the best combinations of 3 wavelengths are all in the range of 730 to 850 nm. The upper wavelength 870 nm is included only once in the HbAll best 4 wavelength combinations (Fig. 8), not at all in the best HbO 4 wavelength combinations (Fig. 9), and is only included in two of the best HbR 4 wavelength combinations (Fig. 10). The consistent selection of certain wavelengths and lack of others implies that a balance exists between four key factors: (1) light penetration through biological tissue at a given wavelength, (2) the sensitivity of a given wavelength to functional changes in HbO and HbR, (3) the power spectrum of MONSTIR II’s supercontinuum laser, and (4) the wavelength-dependent detector sensitivity of MONSTIR II’s PMTs. The higher absorption of lower wavelengths of NIR light by human tissues will decrease the efficacy of wavelengths at the lower end of our tested range. However, the relatively low amplitude of the functional HbR signal will bias wavelength selection toward this lower part of the NIR spectrum. Conversely, on the upper side of the NIR range, spectral variation in detector sensitivity will also have an impact on wavelength selection. This is because the PMT detectors present in MONSTIR II exhibit a relatively flat sensitivity profile between 600 and 860 nm, which quickly drops off at higher wavelengths.22 This helps to explain why very few of the best wavelength combinations for any of the chromophore images include 870 nm. Additionally, the intensity of MONSTIR II’s source reaches a maximum at to 810 nm and tapers on either side,22 with a power output at 670 nm that is that of the peak. This will have the effect of squeezing the range over which high-quality data (and, therefore, accurate images) can be obtained. The regular occurrence of 770 nm and the rarity of lower and upper wavelengths among the best combinations of 2, 3, and 4 wavelengths, along with the occurrence of one of the best combinations of 2 wavelengths being both below the isosbestic point, is likely a reflection of the combined effect of the four key factors mentioned above. A major result of this experiment is that within certain limits, our 4 wavelength system appears relatively robust to the choice of wavelengths. The MSE values typically remain low for a wide range of combinations. There are only 15 combinations of 4 wavelengths that yield an HbAll matrix MSE above 0.05 (arbitrary units, but equivalent to a mean error of of the average HbO concentration change observed). It should be noted that our image reconstruction procedure employed a single atlas space for all four subjects. Despite the fact that the optode locations were based on the 10-20 system and were, therefore, subject-specific, the underlying anatomical structure was assumed to be equal to a population average. This will introduce an additional error, which has been quantified in previous studies.33,34 However, given the fact that our approach is based on a comparison of reconstructed images, the impact of the head model itself will be relatively minor and is unlikely to affect the wavelength selection. Although there are a number of theoretical approaches that allow the estimation of the optimum wavelengths,20,21 our intention was to present an approach that is driven by experimental data, and thus takes into account aspects that can be difficult to include in simulation. These include factors which affect all NIRS and DOI systems, such as the wavelength dependence of the optical properties of tissues of the head, which tend to more heavily absorb lower wavelengths and thus reduce their SNR. Other factors are system-specific, such as the wavelength dependence of laser source power, detector sensitivity, and optical fiber transmission. Although the general results of this data-driven wavelength analysis are potentially applicable to other systems, the exact results are specific to our tomography system, MONSTIR II. However, the method of using real functional activation data and image-based error minimization can be applied to other multispectral systems, providing an explicit experimental assessment of optimum wavelength combinations. 5.ConclusionsWe successfully obtained functional response data with a time-domain DOI system using a right-handed finger-tapping task. This data was used in an image-based optimization procedure to determine the best combinations of 2, 3, and 4 wavelengths to reconstruct images of functional changes in HbO and HbR. The optimum combination of 4 wavelengths for reconstructing images of functional activation using MONSTIR II is [730, 770, 810, 850] nm, which is likely the result of a balance between factors including the absorption spectra of human tissues, the relative sensitivity to changes in HbO and HbR, and the wavelength-dependence of MONSTIR II’s supercontinuum laser source and PMT detectors. Although theoretical calculation of optimum wavelength selection for DOI is an important process, our results demonstrate the necessity of also performing a data-driven analysis for any given imaging system. ReferencesD. A. Boaset al.,
“Improving the diffuse optical imaging spatial resolution of the cerebral hemodynamic response to brain activation in humans,”
Opt. Lett., 29
(13), 1506
–1508
(2004). http://dx.doi.org/10.1364/OL.29.001506 OPLEDP 0146-9592 Google Scholar
B. W. Zeffet al.,
“Retinotopic mapping of adult human visual cortex with high-density diffuse optical tomography,”
Proc. Natl. Acad. Sci., 104
(29), 12169
–12174
(2007). http://dx.doi.org/10.1073/pnas.0611266104 PMASAX 0096-9206 Google Scholar
A. T. Eggebrechtet al.,
“A quantitative spatial comparison of high-density diffuse optical tomography and fMRI cortical mapping,”
NeuroImage, 61
(4), 1120
–1128
(2012). http://dx.doi.org/10.1016/j.neuroimage.2012.01.124 NEIMEF 1053-8119 Google Scholar
A. Gallagheret al.,
“Non-invasive pre-surgical investigation of a 10 year-old epileptic boy using simultaneous EEG-NIRS,”
Seizure, 17
(6), 576
–582
(2008). http://dx.doi.org/10.1016/j.seizure.2008.01.009 SEIZE7 1059-1311 Google Scholar
T. Durduranet al.,
“Transcranial optical monitoring of cerebrovascular hemodynamics in acute stroke patients,”
Opt. Express, 17
(5), 3884
–3902
(2009). http://dx.doi.org/10.1364/OE.17.003884 OPEXFF 1094-4087 Google Scholar
R. J. Cooperet al.,
“Transient haemodynamic events in neurologically compromised infants: a simultaneous EEG and diffuse optical imaging study,”
NeuroImage, 55
(4), 1610
–1616
(2011). http://dx.doi.org/10.1016/j.neuroimage.2011.01.022 NEIMEF 1053-8119 Google Scholar
B. R. Whiteet al.,
“Bedside optical imaging of occipital resting-state functional connectivity in neonates,”
NeuroImage, 59
(3), 2529
–2538
(2012). http://dx.doi.org/10.1016/j.neuroimage.2011.08.094 NEIMEF 1053-8119 Google Scholar
D. R. Leffet al.,
“Assessment of the cerebral cortex during motor task behaviours in adults: a systematic review of functional near infrared spectroscopy (fNIRS) studies,”
NeuroImage, 54
(4), 2922
–2936
(2011). http://dx.doi.org/10.1016/j.neuroimage.2010.10.058 NEIMEF 1053-8119 Google Scholar
S. Lloyd-FoxA. BlasiC. E. Elwell,
“Illuminating the developing brain: the past, present and future of functional near infrared spectroscopy,”
Neurosci. Biobehav. Rev., 34
(3), 269
–284
(2010). http://dx.doi.org/10.1016/j.neubiorev.2009.07.008 NBREDE 0149-7634 Google Scholar
J. Steinbrinket al.,
“Illuminating the BOLD signal: combined fMRI-fNIRS studies,”
Magn. Reson. Imaging, 24
(4), 495
–505
(2006). http://dx.doi.org/10.1016/j.mri.2005.12.034 MRIMDQ 0730-725X Google Scholar
K. Uludağet al.,
“Separability and cross talk: optimizing dual wavelength combinations for near-infrared spectroscopy of the adult head,”
NeuroImage, 22
(2), 583
–589
(2004). http://dx.doi.org/10.1016/j.neuroimage.2004.02.023 NEIMEF 1053-8119 Google Scholar
Y. YamashitaA. MakiH. Koizumi,
“Wavelength dependence of the precision of noninvasive optical measurement of oxy-, deoxy-, and total-hemoglobin concentration,”
Med. Phys., 28
(6), 1108
–1114
(2001). http://dx.doi.org/10.1118/1.1373401 MPHYA6 0094-2405 Google Scholar
G. StrangmanM. A. FranceschiniD. A. Boas,
“Factors affecting the accuracy of near-infrared spectroscopy concentration calculations for focal changes in oxygenation parameters,”
NeuroImage, 18
(4), 865
–879
(2003). http://dx.doi.org/10.1016/S1053-8119(03)00021-1 NEIMEF 1053-8119 Google Scholar
S. UmeyamaT. Yamada,
“New cross-talk measure of near-infrared spectroscopy and its application to wavelength combination optimization,”
J. Biomed. Opt., 14
(3), 034017
(2009). http://dx.doi.org/10.1117/1.3147402 JBOPFO 1083-3668 Google Scholar
S. R. Arridgeet al.,
“A method for three-dimensional time-resolved optical tomography,”
Int. J. Imaging Syst. Technol., 11
(1), 2
–11
(2000). http://dx.doi.org/10.1002/(ISSN)1098-1098 IJITEG 0899-9457 Google Scholar
M. SchweigerS. Arridge,
“The Toast++ software suite for forward and inverse modeling in optical tomography,”
J. Biomed. Opt., 19
(4), 040801
(2014). http://dx.doi.org/10.1117/1.JBO.19.4.040801 JBOPFO 1083-3668 Google Scholar
S. R. ArridgeW. R. B. Lionheart,
“Nonuniqueness in diffusion-based optical tomography,”
Opt. Lett., 23
(11), 882
–884
(1998). http://dx.doi.org/10.1364/OL.23.000882 Google Scholar
Y. Hoshi,
“Functional near-infrared optical imaging: utility and limitations in human brain mapping,”
Psychophysiology, 40
(4), 511
–520
(2003). http://dx.doi.org/10.1111/psyp.2003.40.issue-4 PSPHAF 0048-5772 Google Scholar
H. ObrigA. Villringer,
“Beyond the visible - imaging the human brain with light,”
J. Cereb. Blood Flow Metab., 23
(1), 1
–18
(2003). http://dx.doi.org/10.1097/00004647-200301000-00001 JCBMDN 0271-678X Google Scholar
A. Corluet al.,
“Diffuse optical tomography with spectral constraints and wavelength optimization,”
Appl. Opt., 44
(11), 2082
–2093
(2005). http://dx.doi.org/10.1364/AO.44.002082 APOPAI 0003-6935 Google Scholar
T. CorreiaA. GibsonJ. Hebden,
“Identification of the optimal wavelengths for optical topography: a photon measurement density function analysis,”
J. Biomed. Opt., 15
(5), 056002
(2010). http://dx.doi.org/10.1117/1.3484747 JBOPFO 1083-3668 Google Scholar
R. J. Cooperet al.,
“MONSTIR II: a 32-channel, multispectral, time-resolved optical tomography system for neonatal brain imaging,”
Rev. Sci. Instrum., 85
(5), 053105
(2014). http://dx.doi.org/10.1063/1.4875593 RSINAK 0034-6748 Google Scholar
J. C. Hebdenet al.,
“Assessment of an in situ temporal calibration method for time-resolved optical tomography,”
J. Biomed. Opt., 8
(1), 87
–92
(2003). http://dx.doi.org/10.1117/1.1528206 JBOPFO 1083-3668 Google Scholar
V. Fonovet al.,
“Unbiased nonlinear average age-appropriate brain templates from birth to adulthood,”
NeuroImage, 47 S102
(2009). http://dx.doi.org/10.1016/S1053-8119(09)70884-5 NEIMEF 1053-8119 Google Scholar
K. L. PerdueS. G. Diamond,
“T1 magnetic resonance imaging head segmentation for diffuse optical tomography and electroencephalography,”
J. Biomed. Opt., 19
(2), 026011
(2014). http://dx.doi.org/10.1117/1.JBO.19.2.026011 JBOPFO 1083-3668 Google Scholar
Q. FangD. A. Boas,
“Tetrahedral mesh generation from volumetric binary and grayscale images,”
in IEEE Int. Symp. on Biomedical Imaging: From Nano to Macro ISBI ‘09,
1142
–1145
(2009). http://dx.doi.org/10.1109/ISBI.2009.5193259 Google Scholar
Q. FangD. A. Boas,
“Iso2mesh: a 3D surface and volumetric mesh generator for MATLAB/Octave,”
(2013) http://iso2mesh.sourceforge.net July ). 2013). Google Scholar
S. BrigadoiR. J. Cooper,
“Adult MNI-ICBM152 head model,”
(2014) http://www.ucl.ac.uk/medphys/research/adultMNImodel Google Scholar
F. Bevilacquaet al.,
“In vivo local determination of tissue optical properties: applications to human brain,”
Appl. Opt., 38
(22), 4939
–4950
(1999). http://dx.doi.org/10.1364/AO.38.004939 APOPAI 0003-6935 Google Scholar
A. Custoet al.,
“Effective scattering coefficient of the cerebral spinal fluid in adult head models for diffuse optical imaging,”
Appl. Opt., 45
(19), 4747
–4755
(2006). http://dx.doi.org/10.1364/AO.45.004747 APOPAI 0003-6935 Google Scholar
S. J. Matcheret al.,
“Performance comparison of several published tissue near-infrared spectroscopy algorithms,”
Anal. Biochem., 227
(1), 54
–68
(1995). http://dx.doi.org/10.1006/abio.1995.1252 ANBCA2 0003-2697 Google Scholar
T. Correiaet al.,
“Selection of regularization parameter for optical topography,”
J. Biomed. Opt., 14
(3), 034044
(2009). http://dx.doi.org/10.1117/1.3156839 JBOPFO 1083-3668 Google Scholar
R. J. Cooperet al.,
“Validating atlas-guided DOT: a comparison of diffuse optical tomography informed by atlas and subject-specific anatomies,”
NeuroImage, 62
(3), 1999
–2006
(2012). http://dx.doi.org/10.1016/j.neuroimage.2012.05.031 NEIMEF 1053-8119 Google Scholar
S. L. Ferradalet al.,
“Atlas-based head modeling and spatial normalization for high-density diffuse optical tomography: in vivo validation against fMRI,”
NeuroImage, 85
(Pt 1), 117
–126
(2014). http://dx.doi.org/10.1016/j.neuroimage.2013.03.069 NEIMEF 1053-8119 Google Scholar
|


