
|
|
1.IntroductionFor more than a century, lymphadenectomy, the elective radical removal of regional lymph nodes, has been a standard approach in cancer surgery. The procedure can be used for both diagnostic and therapeutic purposes, however, it often has a negative impact on the patient. The likelihood of complications, among others lymphocele, thrombosis, embolism, or lymphedema increases with the number of removed lymph nodes and glands. To minimize the risk of unnecessary lymph node rejection for patients without metastasis, surgeons search for so-called sentinel lymph nodes (SLNs), which drain the lymph from the tumor area first. During surgery, the SLN is located, removed, and examined for cancer cells. If the sentinel nodes are not affected, then there is a very high probability that the peripheral lymph nodes are free of cancer cells and consequently, their removal is superfluous. However, if cancer cells are found in the sentinel node, then the entire affected lymphatic tissue is removed. For a successful application of the SLN concept, detection methods with high sensitivity are needed. In clinical routine, the lymphatic mapping using colorimetric imaging of blue dyes (isosulfan blue, patent blue, and methylene blue) and/or radiocolloid mapping with Technetium-99m is well established. The combined use of a blue dye and lymphoscintigraphy methods provides high rates of SLN detection: up to 97% for breast cancer.1 However, the scintigraphic method suffers from considerable logistical effort, cost, and patients’ concerns because of the need for the application of radioactive pharmaceuticals. As the legal, safety, and cost considerations limit the use of the radioisotope method in general hospitals, using medical dyes which can be optically excited to emit fluorescence in the near-infrared (NIR) spectral range might be beneficial for lymphatic mapping. Because of the low tissue absorption and negligible tissue autofluorescence in the range between 760 and 900 nm, transcutaneous lymphatic mapping as well as intraoperative imaging of lymph flow in real-time are possible. Currently, the fluorescent agent of choice for SLN mapping is indocyanine green (ICG).2 This organic dye has been used as a contrast agent in medicine for more than two decades with a very low risk of anaphylactoid reaction (1 to 42000).3 The clinical studies where ICG was used in NIR fluorescence-guided cancer surgery have been recently reviewed.2,4,5 Although ICG has not yet been approved for SLN mapping in the US and in Europe, there are numerous publications on clinical trials on humans, where ICG was used as a fluorescent agent for SLN detection for patients with breast cancer6–14 and skin cancer.15–17 Compared with the conventional methods, similar to slightly better detection rates were achieved.8 In addition, the SLN detection with ICG has been successfully reported in various cancers where lymphatic flows are multidirectional and complex, e.g., gastric cancer18–21 and colorectal cancer,22,23 as well as in different gynecological cancer types located in vulva,24–26 cervix,9,25,27 or endometrium.28–30 To our knowledge, there are several investigational devices used for clinical trials of ICG fluorescence imaging of SLNs in humans: the Photodynamic Eye from Hamamatsu,11,19 the IC-View from Pulsion Medical Systems,10,23 the FLARE system developed at Beth Israel Deaconess Hospital in Boston, Massachusetts,6 a prototype developed at the Helmholtz Zentrum of the Technical University Munich, Germany,31 the SPY imaging system (Novadaq Technologies Inc., USA),17 the low-cost ICG fluorescence detection system built at University of Tsukuba in Japan,32 and the frequency-domain photon migration imaging system developed at the University of Texas Health Science Center in Houston, Texas.14,33 In addition, Hirche et al.34 used domestic pigs to evaluate the feasibility of the Fluobeam 800 imaging system (Fluoptics, Grenoble, France) for lymphatic imaging, whereas van Driel et al.35 have recently reported the first in-human study performed with the Artemis (Quest Medical Imaging BV, The Netherlands) imaging system where colorectal liver metastases were visualized with ICG. In each of these systems, the light emitted from the fluorophore is imaged onto a charge-coupled device (CCD) camera. The power, wavelength, and bandwidth of excitation sources, strategy for rejection of backscattered excitation and ambient light establish the overall quality and clinical usefulness of these devices. Furthermore, Solomon et al.36 developed a fiber-based, video-rate fluorescence diffuse optical tomography system and demonstrated its capability for SLN mapping in rats. In this paper, we present a novel, handheld, low-cost device developed for intraoperative fluorescence imaging of SLN applying ICG as a contrast agent (Fig. 1). The system provides fluorescence and anatomical images at the same time. It implements an online ratio-based intensity normalization scheme that corrects the fluorescence images for heterogeneous light absorption in tissues and for concentration quenching of the dye molecule. As will be shown in the following sections, this correction clearly improves the sensitivity for lymph node detection based on ICG fluorescence signals. Up to date, no other handheld device is capable of detecting fluorescence as well as absorption (anatomical) images by using only a single CCD camera (or a similar detector). We demonstrate the performance achieved with this novel device using tissue and lymph node phantoms. 2.Methods2.1.Fluorescence Imaging CameraThe device consists of a camera head (25-cm long cylinder, maximum diameter 6.5 cm) and a medical computer unit connected together with a 3.5-m long cable. The weight of the camera head is approximately 1.1 kg. Inside the camera head (Fig. 2), light sources and a CCD camera are incorporated. Six high-power ( at 600 mA), narrow-band light-emitting diodes (LEDs, SMB735-1100 Epitex Inc., Japan) with a peak wavelength at 735 nm (spectral half-width 25 nm) are used for excitation of ICG. The fluence rate (irradiance) of the excitation light for a 30-cm working distance equals . Two additional LEDs (SMB830-1100, Epitex Inc.) emitting a wavelength of 830 nm (half-width 25 nm) are used to record the tissue anatomical images and to measure the tissue/lymph nodes’ absorption variation. The wavelength of 830 nm has been chosen to correspond to the maximum emission (between 825 to 845 nm in blood plasma) of ICG to ensure that the conditions for light propagation during diffuse reflectance measurement are very similar to those for the fluorescence photons. Fluorescence and absorption images are recorded in an alternating manner. The device is additionally equipped with three cold-white LEDs for on-demand illumination of the patient body, while other sources of visible light (lighting in the operating room) are switched off. An 8-bit noncooled CCD camera (Guppy F-038B NIR, Allied Vision Technologies) with enhanced NIR sensitivity (SONY ExView HAD CCD technology sensor ICX428ALL with maximum quantum efficiency of 61% at 600 nm and about 25% quantum efficiency at 820 nm, effective chip size ) was used as a detector array, equipped with a compact objective of 9-mm focal length (HF9HA-1B, Fujinon). For a working distance of 30 cm between the measured object and the front of the camera, the diagonal field of view equals 27 cm. The image resolution of the camera using the default mode (interlaced) is , allowing, however, for relatively slow image acquisition () only. In our device, the camera runs in the so-called progressive readout mode (noninterlaced, binning) that enables it to increase the image acquisition frequency to with a resolution. The readout noise of the CCD camera at 20°C (without protection glass or standard filters) is given as and the pixel saturation capacity . The corresponding dynamic range equals 400 (52 dB). From the linear relation between the variance and the mean of the photoinduced gray values (photon transfer method), we determined the overall system gain to be around (DN). Since data transfer to the computer is restricted to 8 bit, whereas the analog-to-digital conversion is performed with a 12-bit resolution, the lowest 4 bits are skipped. Alternatively, a user-defined lookup table can be applied to convert the 12-bit data space in the camera head to the 8-bit data range for data transfer. The mean value of the signal-to-noise ratio at saturation (including spatial noise) is specified as 112 (41 dB). The camera has a preamplifier option for the analog video signal, offering a gain from 0 to 24 dB. The optimal rejection of excitation light is important when designing a fluorescence imaging system. The broadband light source used here requires a filter to cut the longer wavelengths. In our camera, we placed high-quality () short-wave pass filters (775 nm Techspec®, Edmund Optics) in front of each of the six 735-nm LEDs used for dye excitation. By combining this with the complementary long-wave pass filters on the camera side, we generated a custom bandpass filtering that minimizes excitation light leakage while maximizing recorded fluorescence light. In front of the objective lens, we placed two high-precision (, slope factor ) interference filters (800 nm Techspec®, Edmund Optics). As the performance of interference filters strongly depends on the angle of incidence, we decided to additionally mount a colored, 3-mm thick glass filter (Schott RG-780) in front of the camera sensor. The effectiveness of the colored glass filters depends almost solely on the absorbing substrate thickness. Hence, photons with angles of incidence deviating from zero that might pass the interference filters will have a high chance to be absorbed by the colored filter. Hwang et al.37 discussed in detail the excitation light leakage problem in in vivo fluorescence imaging, focusing on the importance of collimating optics for noise floor reduction when interference filters are used. Because of device cost and size limits, we decided not to implement expensive or big apparatuses like collimating lenses, image intensifier, or laser diodes. In our measurements, the excitation light leakage has played a negligible role. When illuminating tissue phantoms with our device, the average pixel intensity values (in the 8-bit intensity scale from 1 to 255 DN) in the absence of ICG did not exceed 2.5 DN, of which approximately 1.3 DN was the background measured in the absence of any light. The pixel intensity values of fluorescing lymph node phantoms were typically in the range between 100 and 200 DN. For all measurements presented throughout this paper, the CCD preamplifier gain was switched off. The linear response of the camera system was confirmed () by illuminating a solid fluorescent block with a 735-nm light and recording fluorescence images in the functions of varying excitation light intensities corresponding to LED forward currents from 60 to 600 mA (in steps of 60 mA). The fluorescence signal (the mean value of all the pixels in the image) was plotted as a function of the diode current controlled via a digital-to-analog converter (NI USB 6009, National Instruments, USA). The camera head is sealed with a cap made of polyphenylsulfonate, a material that is biocompatible, easy to clean, and suitable for autoclave sterilization. The central, transparent part of the front cap is made from an antireflective coated borosilicate glass window. In the operating room, the device is wrapped in sterile drapes, making it applicable and safe for intraoperative use. An accredited-notified body (Berlin Cert GmbH, Berlin, Germany) tested the device with respect to electrical safety (e.g., leakage currents) and other safety issues (according to DIN EN 60601 standard) relevant for its application during surgery. A graphical user interface to control the device (Fig. 3) was developed under the LabVIEW (National Instruments, Austin, Texas) environment. The software allows for displaying four different images ( pixels each) simultaneously: a raw fluorescence image (NIR emission), a reflection image representing tissue absorption (serving for the operator as anatomical grayscale image), a normalized fluorescence image (raw fluorescence image divided by absorption image), and a hybrid image. The term hybrid image describes the converted to visible “pseudocolors” normalized fluorescence image that has been overlaid onto the corresponding anatomical grayscale image. The user interface provides control of various system functionalities including: LED intensity adjustment, image display properties (contrast, brightness, and gamma correction) tuning, image archiving, and snapshot collection. Contrast and brightness (display) can be conveniently adjusted by the camera operator using the keyboard located on the camera head (cf. Fig. 1). The software allows for continuous recording of every fifth image acquired and the saving of the data as a tiff-stack. Adjusting contrast, brightness, or gamma correction (either using the user interface or keyboard located on the camera head) does not influence the recorded data, as only raw images can be saved to the file. 2.2.Lymph Node PhantomTo validate the feasibility of the device for real-time fluorescence imaging of lymph nodes, we constructed thin-walled (), 15-mm long hollow double cones (Fig. 4) made of polyoxomethylene. These lymph node mimicking cones were filled with a scattering fluid of the desired optical properties mixed with the fluorescent dye. The absorption coefficients and reduced scattering coefficients of the various liquid phantoms were derived from separate measurements of time-resolved transmittance on a 6-cm thick cuvette using a femtosecond Ti:Sapphire laser and time-correlated single-photon counting and applying the diffusion theory of photon transport for the homogeneous infinite slab with an extrapolated boundary condition.38 The five cones were mounted in a holder ensuring their reliable and reproducible positioning. The holder was placed at the bottom of the glass reservoir (diameter: 18.4 cm, height: 9 cm) filled with the desired amount of a liquid tissue phantom consisting of water and whole ultra-heat treatment milk (3.5% fat). The milk to water ratio (21.6 to 78.4) was kept constant for all experiments, yielding a reduced scattering coefficient of at 780 nm. The schematic of the measurement setup is illustrated in Fig. 4. Fig. 4Experimental setup employed for measurements on lymph node phantoms. The scattering fluid was placed in a glass reservoir. Upper left corner: ultra thin-walled () hollow double cone made of polyoxomethylene filled with scattering fluid and ICG to mimic lymph nodes.  The fluorescent dye we used is ICG-Pulsion (Pulsion Medical Systems SE, Germany), which is supplied as a sterile, water-soluble powder. If a water solution of ICG is administered intravenously, the dye molecules rapidly bind to the plasma proteins2 which results in a red-shift of the absorption and emission peaks. In all measurements presented throughout this paper, the ICG dye was mixed with an excess of bovine serum albumin. 2.3.Fluorescence Ratio ImagesAssuming a typical ICG dose of about 1 mg injected within about 2 ml of solution results in a dye concentration of , which corresponds to the optimum concentration reported by van der Vorst et al.9 for SLN mapping in breast cancer. Although this concentration will be diluted in the tissue, we can expect high enough concentrations in the SLN that the reabsorption of the fluorescence light by ICG itself (concentration quenching) might play an important role (see Sec. 3). Only in the case of microdose investigations should the reabsorption of fluorescence light be negligible. Furthermore, the intensity of the ICG fluorescence signal can be substantially distorted by the interplay of absorption and scattering of the tissue. To retrieve attenuation-corrected fluorescence images with our device, the ratio technique (or F/R) was employed, i.e., the raw local fluorescence signal (F) of each pixel is divided by the corresponding local reflectance (R) at 830 nm. Background subtraction can be omitted here, since the observed fluorescence intensities are at least 50 times larger than the average background values. The F/R technique and its advantages have been reported for intraoperative fluorescence imaging by Ntziachristos et al.39,40 Our device collects raw fluorescence images and reflectance images alternately with a repetition rate of 40 Hz (i.e., 25-ms acquisition time during illumination at 735 nm and 25 ms at 830 nm, respectively) and is capable of displaying the F/R images in real time. The nearly concurrent acquisition of raw fluorescence and reflectance images assures the same geometrical configuration of both measurements. In particular, the overall acquisition rate of 20 Hz is sufficiently short with respect to tissue movements related to the heart rate. Furthermore, the effects of ambient light fluctuations and natural vignetting cancel out in the ratio images. 2.4.Analysis of Experimental DataSince the illumination of the field of view is not homogeneous (up to 50% variation in the light intensity when illuminating with 735-nm LEDs), the acquired images require a correction procedure prior to analysis. For this purpose, a homogeneously fluorescent liquid phantom was illuminated separately by each set of LEDs (735 and 830 nm), where special attention was paid to assure identical geometry of the measurements on lymph node/tissue phantoms. Each pixel value in both raw fluorescence and reflectance images has then been adjusted resulting in an illumination variation below 5% for the 27-cm diagonal field of view in the corrected images. In order to quantitatively determine differences between raw fluorescence images and F/R ratio images, the average photon counts in all double cones were calculated over an identical region of interest (ROI). The ROIs were chosen as squares of the size of 20 pixels, excluding the small square in the middle of each cone of 6 pixels’ size where the screws closing the cones pointing toward the camera head are present. In the vicinity of each cone, a ROI () was chosen to determine the average local background signal. The contrast for each cone was calculated as the ratio of its average photon count signal and the corresponding background. 2.5.SimulationsIn order to theoretically investigate the influence of variations in the intrinsic (i.e., without dye) absorption of the lymph nodes on the fluorescence intensity, we used analytical solutions of the diffusion equations for fluorescence and excitation light. The geometry of superficial or excised lymph nodes was simulated by simply assuming a homogeneous semi-infinite turbid medium. For the case of a lymph node covered by a superficial layer of background tissue, the diffusion theory for a homogeneous semi-infinite medium containing a fluorescent and absorbing sphere was employed.41 In both models, illumination of the diffusive medium by wide-field excitation light was considered by summing up the simulation results for a two-dimensional grid of point-like light sources. Hereby, for each point source, the fluorescence and reflection signals were calculated for a squared detector on a grid with step size of 2 mm. 3.Results3.1.Concentration Quenching of Indocyanine GreenFigures 5(a)–5(c) show the images obtained by illuminating the five cones containing water solutions of ICG with different concentrations (1.0, 2.0, 4.0, 8.0, and ). Here, only the bottom parts of the double cones were immersed in the scattering fluid. The camera was positioned above the lymph node phantoms in so-called 0-deg geometry. The distance between the front of the camera head and the top of the lymph nodes phantom was kept constant at 30 cm. The reflectance image [Fig. 5(a)] depicts a characteristic pattern of varying light absorption at 830 nm caused by the fluorophores inside the cones. Increasing the dye concentration 16 times (from 1 to ) results in relatively minor signal intensity changes ( decrease) in the reflectance image [Fig. 5(d)]. In the raw (uncorrected) fluorescence image [Fig. 5(b)], the cones filled with 4.0 and of ICG solution appear nearly equally bright, brighter than the cone with the highest amount of fluorophore (the first one when looking from top). In the fluorescence image, which has been corrected for the absorption at the fluorophore emission wavelength [F/R ratio, Fig. 5(c)] the cone filled with the lowest amount of ICG appears the darkest, whereas the cone filled with the solution of ICG of the highest concentration appears the brightest. Fig. 5(a)–(c) Images (epi-illumination mode, 0-deg geometry) of five double cones filled with water solutions of ICG (the lowest concentration at the bottom and the highest on top). (a) Reflectance image, R. (b) Raw fluorescence, F. (c) Normalized fluorescence, i.e., F/R ratio. The bottom parts of the double cones are immersed in a diffusive fluid. (d) Normalized intensity for the five cones imaged.  The experimental data have been analyzed as described in Sec. 2.4. If one normalizes the intensities of the observed signals to that observed with the cone filled with ICG solution, then the normalized intensity of the cone filled with ICG is only 1.63 in the raw fluorescence image but is 1.86 in the ratio image. For the cone filled with fluorophore, the corresponding values are 2.19 and 3.05, respectively. The lymph node phantom with dye appears in the uncorrected fluorescence image almost equally bright (2.23) as the one filled with solution, whereas in the ratio image it is much brighter (4.07). Finally, the cone carrying the highest concentration of the fluorophore () is only 1.85 times brighter than the cone with the lowest dye concentration () in the raw image, but the correction leads to a value of 4.15. In the ratio images [Fig. 5(c)], the contrast between the cones and the surroundings as defined in Sec. 2.4 is significantly enhanced. In numbers, the enhancement with respect to the fluorescence image in Fig. 5(b) amounts to about 66%, 88%, 131%, 202%, and 270% for the five cones filled with 1.0, 2.0, 4.0, 8.0, and of ICG, respectively. 3.2.Simulating Tissue HeterogeneityTo simulate tissue optical heterogeneity, the same five cones described above were filled with a scattering liquid (milk and water, , ) and different ink concentrations (10, 54, 113, 201, and 289 ppm), resulting in absorption coefficients of 0.1, 0.4, 0.8, 1.4, and , respectively. The dye concentration in each cone was 200 nM. At this concentration, reabsorption of fluorescence by ICG is negligible. The cones were placed in the reservoir filled with a solution that mimics the background tissue optical properties ( and ). In the first experiment, only the lower halves of the double cones were immersed in the scattering solution to consider the case of superficial or excised lymph nodes (Fig. 6). Despite an equal dye concentration in each cone, the fluorescence images report different fluorescence intensities [see fluorescence image (F) in Fig. 6(b)] as a result of varying the intrinsic absorption of each cone. The varying absorptions can be seen from the diffusely reflected light at 830 nm [reflectance image (R) in Fig. 6(a)]. The reflection image was again used to correct the fluorescence image [F/R ratio in Fig. 6(c)]. Fig. 6(a)–(c) Images (epi-illumination mode, 0-deg geometry) of five double cones filled with scattering fluid, ink, and ICG. The amount of ink was increased (from bottom to top), whereas the concentration of the fluorophore was identical (200 nM) in each cone. (a) Reflectance image, R. (b) Raw fluorescence, F. (c) Normalized fluorescence, F/R. The bottom parts of the double cones are immersed in a diffusive fluid. (d) Normalized intensity for the five cones imaged. (e) Simulated normalized intensities and F/R ratio assuming imaging of a semi-infinite homogeneous medium. 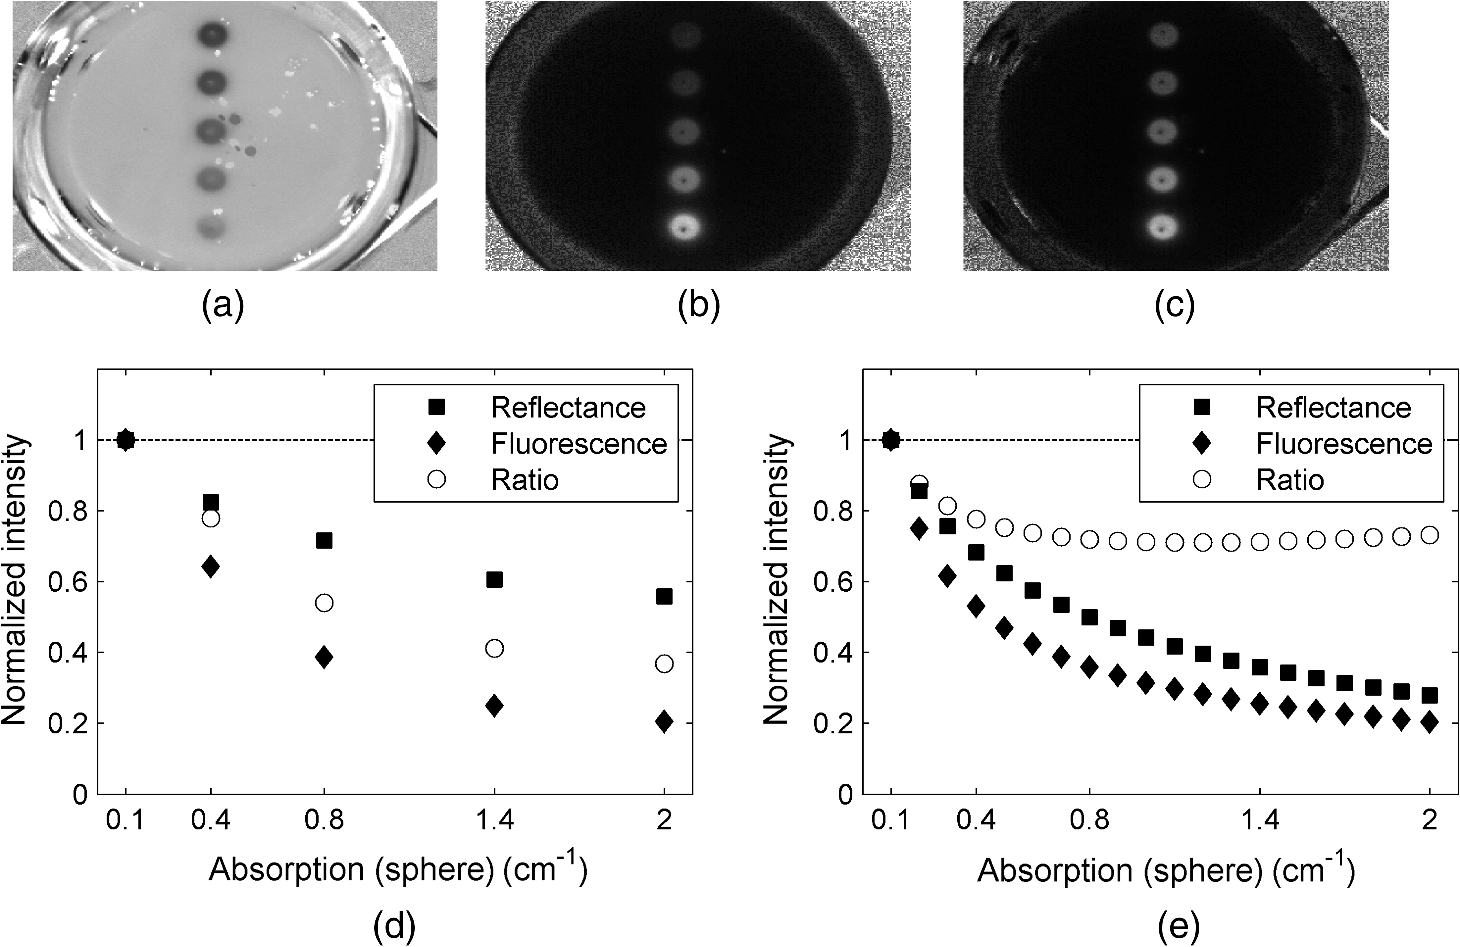 At each cone position, an ROI was defined as described in Sec. 2.4 to estimate the intensity as a function of the cone absorption. The results are shown in Fig. 6(d). In the case of the strongest absorption, the fluorescence intensity drops down to about 20%, whereas the reflection is much less affected. Accordingly, the fluorescence ratio can reduce the effect of intrinsic absorption in part only. In Fig. 6(e), the results of simulations are shown in which a homogeneous semi-infinite fluorescent medium with a plane surface was assumed for simplicity. The drop down of the fluorescence intensity with increasing intrinsic absorption is very similar to the experimental result, whereas the simulated reflection decreases more strongly than in the experiment. Hence, the simple model predicts a better correction by the fluorescence ratio than was observed experimentally, which will be discussed in the following section. The absolute contrast was substantially higher in the ratio images than in the raw fluorescence images. For moderately absorbing cones (, 0.4, and ), the improvement was about 30%, for the cone of , an improvement of 60% was seen, and for the cone with the highest absorption (), an improvement of 190% was observed. In the next experiment, the cones filled with 200-nM ICG and various ink concentration were covered by 2 mm of scattering fluid of optical properties and . All five cones are visible in both the fluorescence and the reflectance images (Fig. 7). However, the increasing intrinsic cone absorption reduces the diffusely reflected signal by a few percent only [Fig. 7(a)], indicating much less efficient absorption correction [Fig. 7(c)] than in the case of the uncovered cones. Figure 7(d) summarizes the relative changes of the peak intensities in the three images as a function of the cone intrinsic absorption. Fig. 7(a)–(c) Images (epi-illumination mode, 0-deg geometry) of five double cones filled with scattering fluid, ink, and ICG, covered by 2 mm of the scattering medium. The amount of ink inside the cones was increased (from bottom to top), whereas the concentration of the fluorophore was identical (200 nM) in each cone. (a) Reflectance image, R. (b) Raw fluorescence, F. (c) Normalized fluorescence, F/R. The bottom parts of the double cones are immersed in a diffusive fluid. (d) Normalized intensity for the five cones imaged. (e) Simulated normalized intensities and F/R ratio obtained by diffusion theory for a sphere embedded in a homogeneous semi-infinite medium. 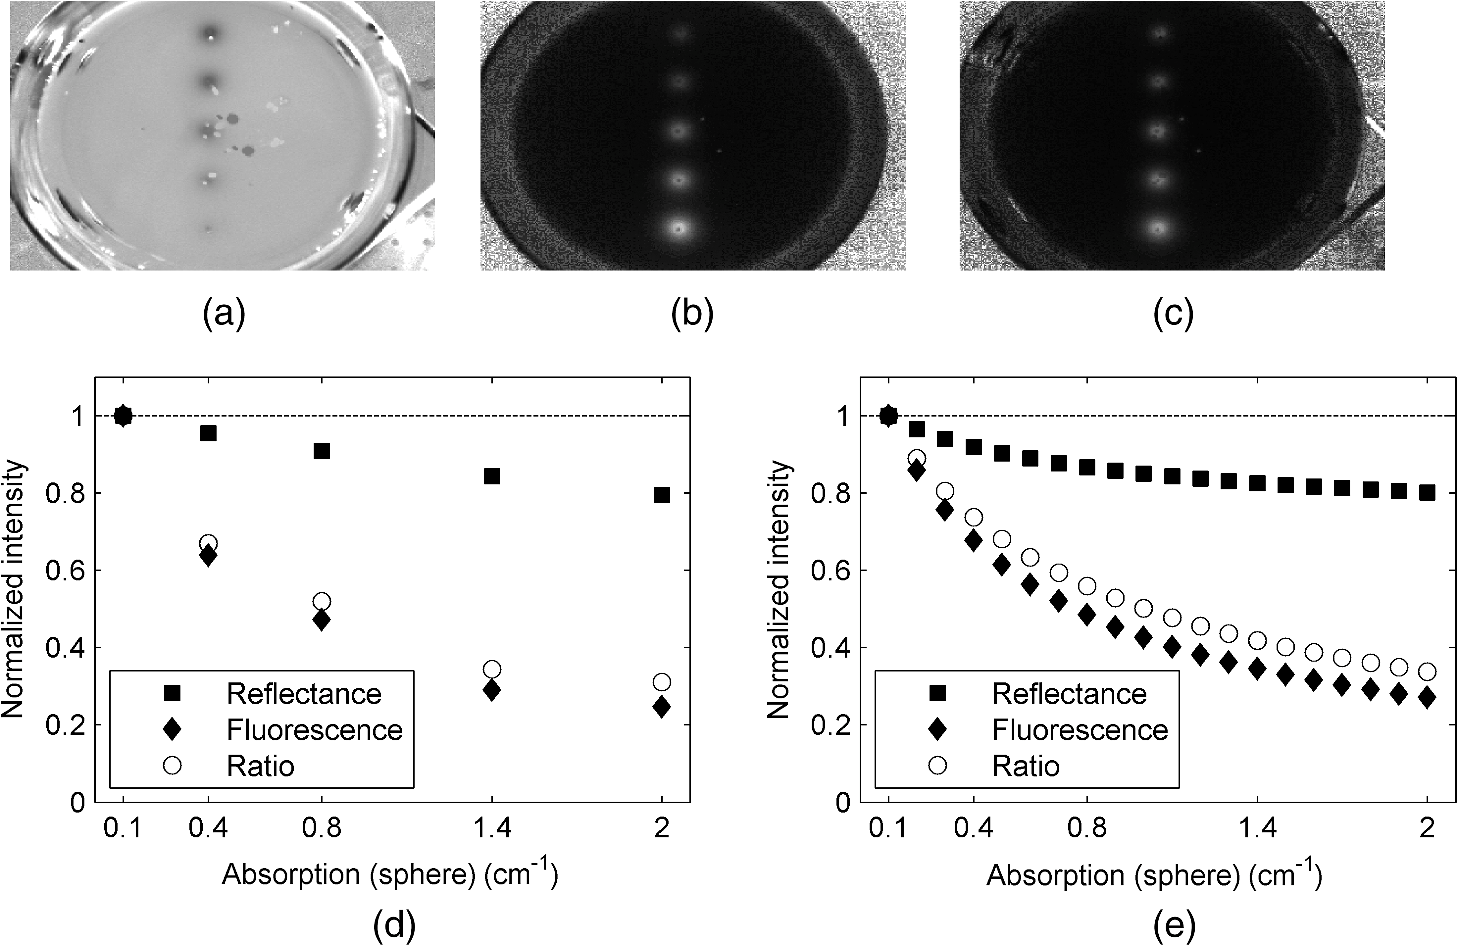 Figure 7(e) shows the theoretical results obtained from diffusion theory for the semi-infinite medium with a spherical inclusion. The volume of the spheres was set to match the volume of the double cones used in the experiment. The decrease of the simulated signals with increasing absorption of the object corresponds very well to the experimental results. Experiments and simulations were also performed for larger thicknesses of the covering fluid on top of the cones. The thickness does not essentially change the relative decrease of the fluorescence intensity visible from Figs. 7(d) and 7(e). In contrast, the reflected intensity becomes almost completely independent of the cone intrinsic absorption when the top layer thickness is larger than 4 mm. The absolute contrast was again better in the ratio images than in the fluorescence images. For the cones covered by 2 mm of tissue, the contrast was enhanced by 20%, 25%, 29%, 40%, and 47% for the cone absorption of , 0.4, 0.8, 1.4, and , respectively. 4.DiscussionThe measurements on diffusely scattering phantoms have shown that our device is capable of detecting fluorescence from objects with ICG concentrations as small as 200 nM even though covering tissues of a few millimeter thicknesses. The corresponding mass of dye in each double cone was about . In clinical studies on patients with breast cancer, the mass of the injected ICG for transcutaneous SLN mapping varied between and 11 mg.6,7,9,14 In a dose finding study on breast cancer, the best results were obtained with about of ICG injected with a concentration.9,42 For patients with vulva or cervix carcinoma where SLNs are detected intraoperatively, between 500 and of ICG have been used so far.25,43 It follows that we can expect a sufficient sensitivity for fluorescence lymph node detection with our low-cost handheld device. After injection of the dye in the vicinity of the tumor, the ICG molecules will be distributed in the lymphatic tissue. The estimation of the dye concentration, which will finally be present in the lymph nodes of interest, is not straightforward and depends on the cancer location and injection route. For example, in recently published studies on patients with gynecological malignancies, 0.5 to 1 ml of ICG was injected into submucosal stroma; the typical dye concentration in the syringe was between 0.5 and (0.65 to 1.61 mM).28,29 After interstitial injection, there is an immediate uptake into the lymphatics. Assuming the dye will be 100-fold diluted locally, the concentration of ICG in the lymph nodes will not be smaller than 6.5 to . ICG cannot be seen by the eye at these concentrations, but on the other hand, reabsorption of the emitted fluorescence (concentration quenching) by the dye itself becomes important, as is visible in Fig. 5. As a rule, all fluorophores exhibit fluorescence quenching if their concentration is high enough. At low concentrations, there is a linear relationship between fluorescence intensity and the concentration of the fluorophore. At higher concentrations, the geometries of the excitation and emission light paths used for measurement becomes important. Gioux et al.44 observed a shift of the quenching threshold (decrease in fluorescence intensity with increasing dye concentration) for ICG in serum from about (sharp maximum) when using 90-deg geometry to about (slow decline with concentration increase) when measured at 0-deg geometry. In perpendicular geometry, the emitted photons are more likely to be reabsorbed than in the 0-deg geometry, because of the longer distance they travel in tissue before reaching the sensor. Moreover, at very high concentrations, ICG (as well as other fluorophores) may form dimers or higher-order aggregates that do not show fluorescence at all or the fluorescence occurs at other (usually higher) wavelengths. Our measurements on lymph node phantoms filled with various dye concentrations (1 to ) clearly demonstrate how misleading the interpretation of the raw fluorescence image [Fig. 5(b)] could be. The fluorescence intensity of all phantoms is of similar magnitude despite substantial changes in dye concentration. In practice, this would hamper the discrimination of lymph nodes carrying higher ICG concentrations from tissue with lower but still high enough ICG concentrations. On the contrary, the ratio images [raw fluorescence signal divided by the reflectance (absorption) measured at 830 nm, Fig. 5(c)] of double cones filled with low ICG concentration appear darker than those filled with a higher dye concentration. As shown in Fig. 5(d), the normalization procedure improves the correlation between the signal intensity and the true dye concentration. The contrast, defined as the ratio of the lymph node fluorescence signal to the signal of surrounding tissue, was also substantially higher in the ratio images than in the raw fluorescence images. The improvement, which is dependent on ICG concentration, varied between 66% (for a cone filled with ICG) to 270% (for ). However, even in the ratio images, the cone with the highest concentration appears only four times brighter than the cone filled with a 16 times lower ICG concentration. When explaining this discrepancy, at least two phenomena have to be addressed. First of all, the camera records all the photons above 800 nm, including those reflected from the double-cone surface. Therefore, only a fraction of the light penetrates the walls of the phantom and probes the solution. Second, the and transition bands of ICG are changing their shape and frequency both in absorption and emission spectra when the concentration is varied. Such pronounced spectral changes demonstrate the alteration of the electronic structure of molecules and, if the concentration is high enough, also the formation of dimers and oligomers. Generally, the light intensity incident on the surface of human tissue is modulated by the tissue optical properties. Hence, the imaged fluorescence intensity can be distorted, obscuring the true fluorophore concentrations. Especially in case of the SLN biopsy procedure, it is important that the displayed fluorescence intensities at least qualitatively correspond to the true concentration of fluorescent dye in the lymph nodes as the surgeon decides to remove only “bright” nodes, i.e., SLNs showing a high enough fluorescence intensity to give a good contrast to the background. As it was shown in our measurements on lymph node phantoms, the fluorescence intensity measured in the reflection mode cannot be simply taken as a direct measure of the dye concentration. In order to retrieve the attenuation-corrected fluorescence information from the measurement, various algorithms based on photon migration theory have been proposed.45,46 Their translation to wide-field imaging has remained cumbersome as there were no techniques for reliable rapid measurement of tissue optical properties over a full image field. In 2011, Saager et al.47 presented an experimental method and instrumentation for spatial frequency-domain imaging (SFDI) capable of determining the tissue optical properties at both excitation and emission wavelengths across a field of view.47 Using an existing empirical Monte Carlo-based model, they were able to correct raw fluorescence signals by the intrinsic optical properties measured on a pixel-by-pixel basis quantifying in this type of protoporphyrin IX concentration in the skin. Recently, Yang et al.48 used a lookup table-based SFDI technique to measure the absorption and reduced scattering coefficients over the imaging field and applied the photon migration theory of Zhang et al.45 to calculate attenuation-corrected fluorescence. Both approaches, however, require a significant computational effort in image postprocessing and, as such, are not capable of providing real-time corrections for in vivo applications. Consequently, the ratio technique (F/R) remains the only method that has been employed in intraoperative fluorescence imaging systems. The measurements of uncovered double cones with different intrinsic absorption have shown that the ratio technique can only in part compensate for the variation in tissue absorption, which reduces the remitted fluorescence intensity. Our simulations using the solution of the diffusion equation for the homogeneous semi-infinite medium predict a better correction than was observed in the experiment. The corrected fluorescence intensity (F/R) should not fall below 75% of the value observed for the smallest intrinsic absorption of taken as a reference. As can be seen from Fig. 6(e), the deviation between simulation and experiment arises mainly from the incomplete description of the reflectance signal in the experiment. The main reason for this discrepancy is that our simple model does not take into account the presence of the wall material of the cones. The phantom walls work as an additional, low absorbing layer. Since the reflection measurement is highly sensitive to the most superficial part of the phantom, the reflectance image presents a weighted average of the absorption of the wall material and the absorption of the fluid in the cone. For the lowest ink concentration, the absorption of the fluid is not much higher than that of the wall material. In contrast, for higher ink concentrations, the effective absorption is considerably smaller than the absorption of the fluid in the cone and the reflection becomes larger than predicted by the model. On the other hand, fluorescence light can only be generated after penetration of the excitation light into the cones. Hence, the intensity of the fluorescence light is not affected by the walls of the lymph node phantom and the agreement between experimental and models is very good. When the cones are fully immersed in the background scattering fluid, the analytical solution of the diffusion theory for a semi-infinite medium containing a spherical object can be applied. As can be seen from Figs. 7(d) and 7(e), the model quantitatively describes the experimentally observed intensities quite well in these cases. Since the reflected intensity in Figs. 7(d) and 7(e) decreases only marginally despite the strong increase of the intrinsic cone absorption, the fluorescence ratio yields only a small correction. When the thickness of the layer covering the double cones is increased to more than 3 mm, the correction effect vanishes completely (not shown). As confirmed by the experiments, the object (e.g., lymph node) with an ICG concentration above cannot be distinguished from another object with a higher dye concentration on the basis of raw fluorescence images. On the other hand, this differentiation is clearly feasible if the ratio images are used for that purpose. These results demonstrate that using the ratio images instead of raw fluorescence images can be advantageous for intraoperative SLN detection in cases where micromolar concentrations of ICG are expected in the lymphatics after peritumoral injection. An improved correlation between the signal intensity and the dye concentration in the ratio images as well as associated contrast enhancement might improve the procedure of a fluorescence-guided SLN biopsy. In cases where the nodes are covered by a thin layer of the overlying tissue (peritoneum, visceral and retroperitoneal fat), the ratio approach is also advantageous due to the enhanced contrast. 5.ConclusionsWe have developed a handheld fluorescence imaging device for SLN mapping with the help of the contrast agent ICG. The system uses a compact 8-bit CCD camera in connection with LEDs emitting at 735 and 830 nm to concurrently record fluorescence and reflectance (anatomical grayscale) images. During software development, we focused on the intuitiveness of graphical interface, transparency in displaying various images, and image display with video-rate repetition rate. Our measurements on phantoms have demonstrated a great advantage of the real-time F/R correction method implemented in the device in cases where high concentrations (micromolar range) of the dye molecule are expected in lymph nodes after the peritumoral injections. Correction for the reabsorbed photons facilitates the detection of the SLN(s) and, as a consequence, can improve the medical procedure by increasing its sensitivity and reducing the time needed. However, the benefits of the F/R correction method are limited to superficially located lymph nodes. Our experimental results as well as theoretical simulations lead to the conclusion that the effect of a covering layer on the fluorescence intensity cannot sufficiently be corrected and hence, the concentration of the dye in the nodes cannot be better estimated by taking the diffuse reflectance from flat-field illumination imaging into account. Such a correction requires other experimental strategies such as point-like light sources resulting in photon bananas which sample the absorption in a particular depth of the tissue, or the advanced normalization approaches discussed in Sec. 4, which, however, do not work in real-time so far. On the other hand, the absolute contrast in the ratio images is also enhanced when compared with raw fluorescence signals in cases where the objects are covered by 2 mm of scattering and absorbing layers. Therefore, when focusing on a simple and easy-to-use handheld device, the flat field illumination in combination with real-time F/R correction is a good compromise. AcknowledgmentsThis work was supported by the German Ministry of Education and Research, Grant 03V0270. ReferencesD. N. Kraget al.,
“Technical outcomes of sentinel-lymph-node resection and conventional axillary-lymph-node dissection in patients with clinically node-negative breast cancer: results from the NSABP B-32 randomised phase III trial,”
Lancet Oncol., 8
(10), 881
–888
(2007). http://dx.doi.org/10.1016/S1470-2045(07)70278-4 LOANBN 1470-2045 Google Scholar
J. T. Alanderet al.,
“A review of indocyanine green fluorescent imaging in surgery,”
Int. J. Biomed. Imaging, 2012 940585
(2012). http://dx.doi.org/10.1155/2012/940585 IJBIBD 1687-4188 Google Scholar
R. Speichet al.,
“Anaphylactoid reactions after indocyanine-green administration,”
Ann. Intern. Med., 109
(4), 345
–346
(1988). http://dx.doi.org/10.7326/0003-4819-109-4-345_2 AIMEAS 0003-4819 Google Scholar
M. V. Marshallet al.,
“Near-infrared fluorescence imaging in humans with indocyanine green: a review and update,”
Open Surg. Oncol. J., 2
(2), 12
–25
(2010). http://dx.doi.org/10.2174/1876504101002020012 1876-5041 Google Scholar
B. E. Schaafsmaet al.,
“The clinical use of indocyanine green as a near-infrared fluorescent contrast agent for image-guided oncologic surgery,”
J. Surg. Oncol., 104
(3), 323
–332
(2011). http://dx.doi.org/10.1002/jso.v104.3 JSONAU 0022-4790 Google Scholar
S. L. Troyanet al.,
“The FLARE intraoperative near-infrared fluorescence imaging system: a first-in-human clinical trial in breast cancer sentinel lymph node mapping,”
Ann. Surg. Oncol., 16
(10), 2943
–2952
(2009). http://dx.doi.org/10.1245/s10434-009-0594-2 1068-9265 Google Scholar
C. Hircheet al.,
“ICG fluorescence-guided sentinel node biopsy for axillary nodal staging in breast cancer,”
Breast Cancer Res. Treat., 121
(2), 373
–378
(2010). http://dx.doi.org/10.1007/s10549-010-0760-z BCTRD6 Google Scholar
G. C. Wishartet al.,
“A feasibility study (ICG-10) of indocyanine green (ICG) fluorescence mapping for sentinel lymph node detection in early breast cancer,”
Eur. J. Surg. Oncol., 38
(8), 651
–656
(2012). http://dx.doi.org/10.1016/j.ejso.2012.05.007 0748-7983 Google Scholar
J. R. van der Vorstet al.,
“Randomized comparison of near-infrared fluorescence imaging using indocyanine green and 99(m) technetium with or without patent blue for the sentinel lymph node procedure in breast cancer patients,”
Ann. Surg. Oncol., 19
(13), 4104
–4111
(2012). http://dx.doi.org/10.1245/s10434-012-2466-4 1068-9265 Google Scholar
D. Murawaet al.,
“Sentinel lymph node biopsy in breast cancer guided by indocyanine green fluorescence,”
Br. J. Surg., 96
(11), 1289
–1294
(2009). http://dx.doi.org/10.1002/bjs.v96:11 BJSUAM 0007-1323 Google Scholar
T. Kitaiet al.,
“Fluorescence navigation with indocyanine green for detecting sentinel lymph nodes in breast cancer,”
Breast Cancer, 12
(3), 211
–215
(2005). http://dx.doi.org/10.2325/jbcs.12.211 BCATDJ 0161-0112 Google Scholar
T. Hojoet al.,
“Evaluation of sentinel node biopsy by combined fluorescent and dye method and lymph flow for breast cancer,”
Breast, 19
(3), 210
–213
(2010). http://dx.doi.org/10.1016/j.breast.2010.01.014 1475-3480 Google Scholar
Y. Ogasawaraet al.,
“Evaluation of breast lymphatic pathways with indocyanine green fluorescence imaging in patients with breast cancer,”
World J. Surg., 32
(9), 1924
–1929
(2008). http://dx.doi.org/10.1007/s00268-008-9519-7 WJSUDI 0364-2313 Google Scholar
E. M. Sevick-Muracaet al.,
“Imaging of lymph flow in breast cancer patients after microdose administration of a near-infrared fluorophore: feasibility study,”
Radiology, 246
(3), 734
–741
(2008). http://dx.doi.org/10.1148/radiol.2463070962 RADLAX 0033-8419 Google Scholar
T. Mizukamiet al.,
“Sentinel lymph node detection by indocyanine green fluorescence imaging in skin cancer patients: technical refinement,”
Open Surg. Oncol. J., 2 57
–61
(2010). Google Scholar
R. TanakaK. NakashimaW. Fujimoto,
“Sentinel lymph node detection in skin cancer using fluorescence navigation with indocyanine green,”
J. Dermatol., 36
(8), 468
–470
(2009). http://dx.doi.org/10.1111/jde.2009.36.issue-8 JDMYAG 0385-2407 Google Scholar
V. Jainet al.,
“Sentinel lymph node detection using laser-assisted indocyanine green dye lymphangiography in patients with melanoma,”
Int. J. Surg. Oncol., 2013 904214
(2013). http://dx.doi.org/10.1155/2013/904214 Google Scholar
I. Miyashiroet al.,
“Detection of sentinel node in gastric cancer surgery by indocyanine green fluorescence imaging: comparison with infrared imaging,”
Ann. Surg. Oncol., 15
(6), 1640
–1643
(2008). http://dx.doi.org/10.1245/s10434-008-9872-7 1068-9265 Google Scholar
Y. Tajimaet al.,
“Sentinel node mapping guided by indocyanine green fluorescence imaging in gastric cancer,”
Ann. Surg., 249
(1), 58
–62
(2009). http://dx.doi.org/10.1097/SLA.0b013e3181927267 ANSUA5 0003-4932 Google Scholar
M. Kusanoet al.,
“Sentinel node mapping guided by indocyanine green fluorescence imaging: a new method for sentinel node navigation surgery in gastrointestinal cancer,”
Dig. Surg., 25
(2), 103
–108
(2008). http://dx.doi.org/10.1159/000121905 DSIUAN 0253-4886 Google Scholar
N. Mitsumoriet al.,
“Sentinel lymph node navigation surgery for early stage gastric cancer,”
World J. Gastroenterol., 20
(19), 5685
–5693
(2014). http://dx.doi.org/10.3748/wjg.v20.i19.5685 WJGAF2 1007-9327 Google Scholar
S. Nouraet al.,
“Feasibility of a lateral region sentinel node biopsy of lower rectal cancer guided by indocyanine green using a near-infrared camera system,”
Ann. Surg. Oncol., 17
(1), 144
–151
(2010). http://dx.doi.org/10.1245/s10434-009-0711-2 1068-9265 Google Scholar
C. Hircheet al.,
“Ultrastaging of colon cancer by sentinel node biopsy using fluorescence navigation with indocyanine green,”
Int. J. Colorectal Dis., 27
(3), 319
–324
(2012). http://dx.doi.org/10.1007/s00384-011-1306-5 IJCDE6 1432-1262 Google Scholar
B. E. Schaafsmaet al.,
“Near-infrared fluorescence sentinel lymph node biopsy in vulvar cancer: a randomised comparison of lymphatic tracers,”
Int. J. Gynaecol. Obstet., 120
(6), 758
–764
(2013). http://dx.doi.org/10.1111/1471-0528.12173 IJGOAL 1470-0328 Google Scholar
L. M. A. Craneet al.,
“Intraoperative multispectral fluorescence imaging for the detection of the sentinel lymph node in cervical cancer: a novel concept,”
Mol. Imaging Biol., 13
(5), 1043
–1049
(2011). http://dx.doi.org/10.1007/s11307-010-0425-7 1536-1632 Google Scholar
M. HuttemanJ. R. van der VorstA. L. Vahrmeijer,
“Optimization of near-infrared fluorescent sentinel lymph node mapping for vulvar cancer,”
Am. J. Obstet. Gynecol., 206
(1), 1
–11
(2012). http://dx.doi.org/10.1016/j.ajog.2011.07.039 AJOGAH 0002-9378 Google Scholar
E. L. Jewellet al.,
“Detection of sentinel lymph nodes in minimally invasive surgery using indocyanine green and near-infrared fluorescence imaging for uterine and cervical malignancies,”
Gynecol. Oncol., 133 274
–277
(2014). http://dx.doi.org/10.1016/j.ygyno.2014.02.028 GYNOA3 0090-8258 Google Scholar
R. W. Hollowayet al.,
“Detection of sentinel lymph nodes in patients with endometrial cancer undergoing robotic-assisted staging: a comparison of colorimetric and fluorescence imaging,”
Gynecol. Oncol., 126 25
–29
(2012). http://dx.doi.org/10.1016/j.ygyno.2012.04.009 GYNOA3 0090-8258 Google Scholar
E. C. RossiA. IvanovaJ. F. Boggers,
“Robotically assisted fluorescence-guided lymph node mapping with ICG for gynecologic malignancies: a feasibility study,”
Gynecol. Oncol., 124 78
–82
(2012). http://dx.doi.org/10.1016/j.ygyno.2011.09.025 GYNOA3 0090-8258 Google Scholar
A. K. Sinnoet al.,
“A comparison of colorimetric versus fluorometric sentinel lymph node mapping during robotic surgery for endometrial cancer,”
Gynecol. Oncol., 134
(2), 281
–286
(2014). http://dx.doi.org/10.1016/j.ygyno.2014.05.022 GYNOA3 0090-8258 Google Scholar
L. M. A. Craneet al.,
“Intraoperative near-infrared fluorescence imaging for sentinel lymph node detection in vulvar cancer: first clinical results,”
Gynecol. Oncol., 120
(2), 291
–295
(2011). http://dx.doi.org/10.1016/j.ygyno.2010.10.009 GYNOA3 0090-8258 Google Scholar
Y. Fujisawaet al.,
“A custom-made, low-cost intraoperative fluorescence navigation system with indocyanine green for sentinel lymph node biopsy in skin cancer,”
Dermatology, 222
(3), 261
–268
(2011). http://dx.doi.org/10.1159/000327080 DERMEI 0742-3217 Google Scholar
E. M. Sevick-MuracaJ. C. Rasmussen,
“Molecular imaging with optics: primer and case for near-infrared fluorescence techniques in personalized medicine,”
J. Biomed. Opt., 13
(4), 1
–39
(2008). http://dx.doi.org/10.1117/1.2953185 JBOPFO 1083-3668 Google Scholar
C. Hircheet al.,
“An experimental study to evaluate the Fluobeam 800 imaging system for fluorescence-guided lymphatic imaging and sentinel node biopsy,”
Surg. Innovation, 20
(5), 516
–523
(2013). http://dx.doi.org/10.1177/1553350612468962 1553-3506 Google Scholar
P. B. A. A. van Drielet al.,
“Characterization and evaluation of the artemis camera for fluorescence-guided cancer surgery,”
Mol. Imaging Biol.,
(2014). http://dx.doi.org/10.1007/s11307-014-0799-z 1536-1632 Google Scholar
M. Solomonet al.,
“Video-rate fluorescence diffuse optical tomography for in vivo sentinel lymph node imaging,”
Biomed. Opt. Express, 2
(12), 3267
–3277
(2011). http://dx.doi.org/10.1364/BOE.2.003267 BOEICL 2156-7085 Google Scholar
K. Hwanget al.,
“Improved excitation light rejection enhances small-animal fluorescent optical imaging,”
Mol. Imaging, 4
(3), 194
–204
(2005). MIOMBP 1535-3508 Google Scholar
D. GrosenickH. WabnitzH. Rinneberg,
“Time-resolved imaging of solid phantoms for optical mammography,”
Appl. Opt., 36
(1), 221
–231
(1997). http://dx.doi.org/10.1364/AO.36.000221 APOPAI 0003-6935 Google Scholar
V. Ntziachristoset al.,
“Planar fluorescence imaging using normalized data,”
J. Biomed. Opt., 10
(6), 064007
(2005). http://dx.doi.org/10.1117/1.2136148 JBOPFO 1083-3668 Google Scholar
G. Themeliset al.,
“Real-time intraoperative fluorescence imaging system using light-absorption correction,”
J. Biomed. Opt., 14
(6), 064012
(2009). http://dx.doi.org/10.1117/1.3259362 JBOPFO 1083-3668 Google Scholar
X. D. Liet al.,
“Fluorescent diffuse photon density waves in homogeneous and heterogeneous turbid media: analytic solutions and applications,”
Appl. Opt., 35
(19), 3746
–3758
(1996). http://dx.doi.org/10.1364/AO.35.003746 APOPAI 0003-6935 Google Scholar
J. S. D. Mieoget al.,
“Toward optimization of imaging system and lymphatic tracer for near-infrared fluorescent sentinel lymph node mapping in breast cancer,”
Ann. Surg. Oncol., 18
(9), 2483
–2491
(2011). http://dx.doi.org/10.1245/s10434-011-1566-x 1068-9265 Google Scholar
L. M. A. Craneet al.,
“Multispectral real-time fluorescence imaging for intraoperative detection of the sentinel lymph node in gynecologic oncology,”
J. Visualized Exp.,
(44), e2225
(2010). http://dx.doi.org/10.3791/2225 JVEOA4 1940-087X Google Scholar
S. GiouxH. S. ChoiJ. V. Frangioni,
“Image-guided surgery using invisible near-infrared light: fundamentals of clinical translation,”
Mol. Imaging, 9
(5), 237
–255
(2010). MIOMBP 1535-3508 Google Scholar
Q. Zhanget al.,
“Turbidity-free fluorescence spectroscopy of biological tissue,”
Opt. Lett., 25
(19), 1451
–1453
(2000). http://dx.doi.org/10.1364/OL.25.001451 OPLEDP 0146-9592 Google Scholar
J. WuM. S. FeldR. P. Rava,
“Analytical model for extracting intrinsic fluorescence in turbid media,”
Appl. Opt., 32
(19), 3585
–3595
(1993). http://dx.doi.org/10.1364/AO.32.003585 APOPAI 0003-6935 Google Scholar
R. B. Saageret al.,
“Quantitative fluorescence imaging of protoporphyrin IX through determination of tissue optical properties in the spatial frequency domain,”
J. Biomed. Opt., 16
(12), 126013
(2011). http://dx.doi.org/10.1117/1.3665440 JBOPFO 1083-3668 Google Scholar
B. YangM. SharmaJ. W. Tunnell,
“Attenuation-corrected fluorescence extraction for image-guided surgery in spatial frequency domain,”
J. Biomed. Opt., 18
(8), 080503
(2013). http://dx.doi.org/10.1117/1.JBO.18.8.080503 JBOPFO 1083-3668 Google Scholar
BiographyŁukasz Szyc is a postdoctoral researcher at the Physikalisch-Technische Bundesanstalt in Berlin. After receiving his MS degree from University of Wrocław (Poland) in 2006, he joined the Max Born Institute in Berlin, where he investigated the ultrafast vibrational dynamics of biologically relevant hydrogen-bonded systems with Prof. T. Elsaesser. He completed his doctorate in experimental physics in 2011 at the Humboldt University in Berlin. His current research interests include tissue optics, fluorescence imaging, and time-resolved NIRS. |


