
|
|
1.IntroductionMalaria still remains the most devastating human disease that affects more than 500 million people and is responsible for 1 to 3 million deaths each year.1 In humans, malaria is caused by infection from plasmodium falciparum, malariae, ovale, vivax, and knowlesi.2,3 Plasmodium falciparum and vivax are the main causes of malarial infection in Pakistan, whereas falciparum accounts for the majority of worldwide deaths.4 Early and efficient diagnosis is necessary for treatment and disease management to avoid morbidity and mortality.5–8 The gold standard for clinical confirmation of the malaria infection is based upon white light microscopic examination of smeared blood slides.8 This requires an expert laboratory technician with training and experience, along with costly microscopes that cannot be obtained in many situations. An alternate method used for rapid diagnosis of malaria is known as the rapid diagnostic test (RDT);5,7,9 however, it suffers from the issues of false positive and negative results. In addition, a polymerase chain reaction (PCR) technique has also been used for diagnosis of a plasmodium genotype and its quantification,10 but it is costly and time consuming. In short, microscopy and RDTs both show adequate performance in the diagnosis of malaria in febrile patients;11 however, still there is a need for a fast, reliable, online, and efficient diagnostic tool for disease recognition at early stages and to monitor the biochemical changes associated with malaria infection. A malarial parasite inside RBC needs amino acids to increase its size as well as numbers. It may receive amino acids in three ways: biosynthesis from carbon sources, transportation through extracellular media, and digestion of hemoglobin.12,13 Hemoglobin comprises 95% of the cytosolic protein of RBC; therefore, during the intraerythrocytic cycle, host cell cytoplasm is consumed and 60%–80% of the hemoglobin is degraded;13 as a result, free-heme is released upon catabolism of the hemoglobin14 and is toxic for the malarial parasite.15 The parasite detoxifies heme by converting it into a dark brownish color product called hemozoin, also known as malaria pigment. Diagnosis of malarial infection is carried out through the examination of hemozoin in the smeared blood slide with a white light illuminated microscope. Digestion of hemoglobin produces amino acids13, which fills the entire RBC. As a result it bursts, and throws hemozoin, amino acid and hemoglobin into the extracellular media. During the preceding decades, Raman spectroscopy has been widely employed for the diagnosis and monitoring of biochemical/morphological changes associated with cancer,16–18 viral infections like dengue,19 measurement of hemoglobin,20,21 determination of oxygen saturation22,23 and hemoglobin-related blood disorders,24,25 as well as for the discriminative analysis of body fluids for forensic application.26 Raman spectroscopy has also been widely employed for the investigation of hemozoin that leads toward optical diagnosis of malarial infection.27–32 In addition, Raman spectroscopy of hemozoin has been studied extensively to explore the outcomes of antimalarial drugs in the progress of the disease.15,28,33 Recently, Wood et al.34 used tip-enhanced Raman scattering for the detection of drug binding to the hemozoin surface, Yuen and Liu35 utilized magnetic field enriched surface enhanced resonance Raman spectroscopy, and Hobro et al.36 investigated heme for early malarial diagnosis. In addition, Park et al.37 used a static and dynamic light scattering technique for differentiating healthy from the malaria-parasite invaded red blood cells (RBCs), and Orbán et al.38 employed the rotating-crystal magneto-optical (MO) diagnostic method for the detection of hemozoin for early disease detection. Similarly, Lee and Lu39 reported the detection of malaria-infected RBCs using backward elastic light scattering, and Lukianova-Hleb et al.40 used a picosecond laser for hemozoin-generated nanobubbles for the needle free detection of malaria. In this article, we are presenting Raman spectroscopic signatures of biochemical changes associated with the plasmodium vivax infection in the human plasma and its comparison with dengue infected samples. A multivariate model based on partial least square (PLS) regression engine and Raman spectra of clinically confirmed malaria, dengue virus infected, and healthy samples has been developed to predict the malarial infection. The multivariate model is blindly tested for 30 unknown suspected samples and was found to be 86% accurate as compared with clinical results. The inaccuracy is due to three samples which were found in the gray region that is defined by the limits between 0.2 and 0.8 of the predicted values. 2.Materials and Methods2.1.Sample PreparationBlood samples from 60 suspicious malaria and dengue infected individuals were collected by the pathology department at PAEC General Hospital Islamabad, Pakistan and 10 from healthy volunteers at our institute. The patients were referred from the out patient department of the hospital on different days. For diagnosis of the malarial infection, whole blood is required, therefore, blood samples were collected in ETDA-treated tubes (Hebei Xinle, Sci&Tech Co. Ltd., China) in order to prevent clotting. For confirmation of malaria, smeared slides were prepared from whole blood to examine the hemozoin in the RBC through a white light-illuminated microscope. Similarly, serum is required for the diagnosis of dengue virus infection through ELISA; therefore, for this test, blood samples were collected in tubes which contained a clot activator gel (Hebei Xinle, Sci&Tech Co. Ltd., China). Blood samples were taken from the large vein in cubital fossa. The selected site was first cleaned and disinfected by using 5% alcohol swab. After complete aseptic measures, 3 ml of venous blood was drawn with a disposable syringe. Safety precautions recommended by National Institute of Health (NIH)41 were followed from sample collection to obtain the Raman spectra. In order to proceed for Raman spectroscopic studies, plasma and serum were extracted with a centrifuge machine (D-7200, Hitachi, Japan) at 3500 rpm for 10 min. Both plasma and serum were extracted carefully from the blood samples as per standard procedure. Each sample of a drop was placed on a glass slide (Sail brand microscope slide 7101, China) and dried for 2 h at room temperature under a cover lid before obtaining the Raman spectra. Wet plasma samples introduce an intense fluorescence background which sometimes buries the Raman signal of solutes. Therefore, dried samples were chosen over wet, which increased the volume fraction of analytes and thus enhanced the signal strength of the Raman spectra. The drying process for samples produced in-homogeneities at the edges of the sample either through surface tension or molecular weight differences. However, the central part of the dried sample was of uniform42 thickness; therefore, it was chosen to acquire the Raman spectra. From the central part of the spot, three Raman spectra were acquired from slightly shifted focusing positions from the same sample and their average was further used in the analysis. 2.2.Acquiring Raman SpectraRaman spectra from the dried samples were obtained using a Raman spectrometer (Ramboss: Micro Raman measurement system, Dongwoo Optron Co. Ltd, Korea), which offered a resolution of . A diode laser at 532 nm was focused on the surface of the dry sample with a objective in the backscattering configuration. The laser power irradiation over the samples was 40 mW. Laser power was carefully optimized to avoid photodegradation of the samples,43,44 which was done through neutral density filters to record the Raman spectra from a healthy sample using different laser powers and spectral overlaying as a function of Raman shifts was found. Each Raman spectrum was recorded from 760 to with an exposure time of 8 s. Raman spectra of diseased samples were acquired at different times and days depending on their collection. Calibration of the Raman spectrometer is performed each time through recording the Raman spectrum of a silicon crystal wafer at . A glass slide produces fluorescence background while recording the Raman spectra of samples placed on it, however, its Raman spectrum was subtracted from all that were used in the development of the model and for the blind test. 2.3.Processing Raman SpectraAll the Raman spectra were analyzed using MATLAB (Release 2009; The Mathworks Inc., USA). First of all, the Raman spectra were denoised using a built-in “wden” function in MATLAB which is based on the wavelet decomposition and reconstruction method.45 Using wavelets, we decompose the spectrum into its component parts, called a set of wavelet coefficients, which represent the complete features of the spectrum. The spectrum can be completely reconstructed using all these wavelet coefficients. The denoising process proceeds in three steps: decomposition of spectrum in which an orthogonal wavelet of level 10 is selected, soft thresholding is used based on Stein’s principle of unbiased risk, and reconstruction of the spectrum using wavelet coefficients. Stein’s unbiased risk estimate is an unbiased estimator that provides the accuracy and the soft threshold is a preprocessing tool that reduces the background in the spectrum, so pixels with intensity values below the threshold are reduced. In the second step, Raman spectra were further smoothed using the “mssgolay” function in MATLAB, which applied a moving average Savitzky–Golay smoothing filter method46,47 over a span of nine points with a polynomial fitting of degree 4. In the third step, the fluorescence baseline in the Raman spectra was corrected using the “msbackadj” function in MATLAB.48,49 For each spectrum, the “msbackadj” function estimated a baseline within multiple shifted windows ( width) and regressed the baseline using spline approximation before subtracting it from the spectrum. In this way, all Raman features narrower than were preserved, while those that were wider are considered a product of background fluorescence and are removed. 3.Results and Discussions3.1.Spectral Recognition of Disease SignaturesMalaria and dengue virus infectious diseases appear almost at the same time of year and come out with fever symptoms. Clinically, both fever types cannot be differentiated in early days, which might result in a false diagnosis; therefore, a reliable, efficient, fast and early laboratory diagnostic test is very important for disease management. This article reports a comparison of Raman spectroscopic signatures of malaria and dengue virus infected samples19 with healthy ones. During the centrifugation of blood in the ETDA-treated tubes, fibrinogen rests inside plasma, and in the gel activated tubes, it is completely absent in the serum. In order to compare the similarities and differences in both samples, a Raman spectrum from each the healthy volunteers is recorded and is presented in Fig. 1. Both spectra show a similar trend except for a few Raman lines that appear due to fibrinogen, but these are of very low intensity. The spectral range from 760 to that was used in the development of the multivariate model contained only one Raman line at in the spectrum of the plasma. This line represents fibrinogen50,51 and is of very low intensity. Fig. 1Normalized Raman spectrum of a serum and plasma of a healthy volunteer illustrates their mutual differences and similarities. These Raman spectra are recorded from 760 to using a laser at 532 nm as the excitation source.  Out of 60 blood samples collected from the hospital, 20 were clinically confirmed for malaria infection and 10 for non-malaria but the patients were suffering from fever. Raman spectra of all the samples were acquired, processed, and plotted on the vertical axis in Fig. 2. The Raman spectra of the dengue-infected samples from six individuals from another location are also included in Fig. 2.19 This depicted a nice comparison between the biochemical changes associated with malaria infection (red/cyan color) from 20 samples, non-malaria but suffering from fever (pink color) and healthy (green color) ones each from 10 cases, and dengue infection (black color) from 06 samples. The overlapping of individual categories Raman spectra in all the cases shows the precision in the measurement. These Raman spectral peaks are listed in Table 1 to present a quantitative comparison between the spectral signatures of both diseases with healthy ones. Fig. 2Normalized Raman spectra of 20 malaria (plasmodium vivax) infected (red/cyan color), 10 non-malarial having fever (pink color), 10 healthy (green color), and 6 dengue-infected19 samples (black color) using a laser at 532 nm as an excitation source, it extends from 760 to spectral shift, which illustrated specific prominent peaks in each case.  Table 1This shows a quantitative comparison of Raman spectral peaks of malaria, dengue virus infected, non-malaria, and healthy plasma/sera samples (Raman lines are taken from the spectra shown in Fig. 2).
There are three prominent Raman lines at 1005, 1156, and that appeared in the healthy samples and which represent -carotenoids;53 however, the line at is also indicative for phenylalanine53 and IgG.52 This line is sharp in the case of healthy/non-malaria samples as compared with the malarial infected ones. It can be inferred that for healthy samples, its occurrence is mainly due to -carotenoids and Phenylalanine, however, its broadening in malaria samples is due to the rise of hemoglobin because a Raman line at representing hemoglobin20,21 is expected to be buried inside . The resolution of the Raman spectrometer used in the present studies cannot resolve the Raman line at from . Therefore, the presence of the Raman line at cannot be confirmed; however, if present, it will contribute to the broadening of the Raman line at in malaria samples. The appearance of in the dengue infected Raman spectra (top in Fig. 2) might be due to IgG,52 and is comparatively of low intensity which means that this line in malaria infection is mainly due to hemoglobin. Similarly, the Raman line at , appeared in all categories as shown in Fig. 2; however, its signal intensity is higher in healthy/non-malaria samples, and it reduces in strength in malaria and to a minimum level in dengue virus infected cases. The Raman line at is present in healthy/non-malaria at the highest level, whereas its intensity level decreases many times in the case of malaria and completely disappears in dengue-infected samples. -carotenoids are important antioxidants and play an important role in protecting the organism and immune system19,54 from free radicals and disappear or are reduced in the case of dengue virus infection.19 It is suggested that the monitoring of -carotenoids may help in better disease management. In Fig. 2, Raman lines at 835, 837 and , representing IgM52 appeared in the Raman spectra of non-malaria (pink color), malaria, and dengue infected samples, respectively. Both antibodies, IgM and IgG, are long chain molecular structures and different functional groups are attached to them. The above cited Raman peaks that represent IgM at three different shifted wavenumbers appear due to the vibrations of these functional groups in response to different infections. These shifts in the position of the Raman peaks play a significant role in the development of the PLS prediction model. The Raman line at , representing lipids,53 is present only in malaria and dengue infected samples, but it is more pronounced in the malarial cases. Similarly, the Raman line at is labeled for IgM52 and Porline53 (collagen assignment), and appeared only in the dengue infected samples. The Raman line at , representing hemoglobin,20,21 is present in malaria and non-malaria samples, but is more pronounced in malaria cases. The Raman line at , representing IgG,47 appeared only in the dengue infected samples, whereas the line at , representing hemoglobin20,21 and Palmitic/fatty acid,53 appeared in non-malaria and malaria cases; however, its level increases many times in malaria samples. In the non-malaria samples, this line may appear due to Palmitic/fatty acid. Raman lines at 1172 and , representing hemoglobin,20–23 appeared only in malaria infected samples. Hemoglobin comes out in the plasma due to the rupturing of the RBC wall during the plasmodium multiplication process. The Raman line at , representing IgM,52 is present both in malaria and dengue infected samples; however, its signal intensity is higher in malarial spectra. The Raman line at , representing tryptophan,53 IgG52 and hemoglobin,20–23 and lines at 1357 and , assigned for hemoglobin,19–22 are present only in the malaria infected samples. The Raman line at , assigned for IgG,52 is present in dengue, malaria and non-malaria samples and is absent in healthy ones. However, its intensity is higher in the case of the dengue virus infection as compared with malaria and non-malaria samples. There are two malaria-infected samples (cyan color), which show a Raman line at , different from the other malarial infected ones. It is assigned for (), observed in the spectra of human RBC,18–55 which were from the samples whose color was reddish rather than straw-yellow, the color of pure plasma; it means that it is mixed with RBC. However, this Raman line does not affect the prediction of malaria infection, which is due to distinct Raman signatures of malaria infection. It emphasizes the potential of Raman spectroscopy for predictive diagnosis of infectious diseases even if patients have more than one disease. The Raman line at , representing hemoglobin31,32 and tryptophan,53 appeared only in malaria infected samples, whereas at , assigned for phenylalanine,53 it showed its weak signatures in the non-malaria cases. Raman lines at 1586, 1603, and , assigned for hemoglobin,31,32 phenylalanine,53 and amide-I group,53 respectively, appeared only in malaria infected samples, however, at , representing cortisone, is responsible for stress in the body19 and is present only in the dengue virus infected cases. Figure 2 showed Raman spectra of three amino acids: tryptophan, tyrosine, and phenylalanine,56 their concentrations in healthy samples are low, it increases many times in malaria-infected samples, and they are completely absent in dengue-infected cases. These play an important role for the quality of health and the rise of their concentrations, particularly tryptophan,57–59 causes brain fatigue. Tryptophan is the precursor for neurotransmitter 5-hydroxytryptamine (5-HT), which is involved in fatigue and sleep.58 An increased level of tryptophan in plasma leads to a higher level of 5-HT, which is reported for central brain fatigue.59 In the case of malarial infection, patients usually feel a headache, stress, and exhaustion in their body, which is due to the increase of amino acids in the plasma. 3.2.Disease Prediction Model Based on Raman SpectraRaman spectra of body fluids are complex due to multiple background sources, which causes fluorescence and spectral overlapping; therefore, straightforward spectral analysis cannot be effectively used for accurate diagnosis. Multivariate analysis can facilitate this in such a way that it eliminates background interferences to make possible the prediction of viral infectious diseases like dengue.19,60 In this study, a multivariate model has been developed with a PLS regression engine NIPALS algorithm, a built-in routine written in the MATLAB environment (Release 2009; The Mathworks Inc., USA), with the Raman spectra of malaria, dengue virus infected, and healthy samples as the trainee data set. PLS regression offers the advantage of predicting the unknown by developing a proper model based on the known database.60 The benefit of PLS-based multivariate regression is that it takes the whole Raman spectra rather than prominent peaks and includes minute spectral variations for the prediction of diseases. This methodology supports the development of a multivariate database; it matches the spectral pattern of the unknown samples with the stored ones for disease prediction in the presence of multianalyte background sources.61,62 PLS uses loading vectors for principal component analysis that reflect the intrinsic features of the pure component spectra and we used four loading vectors for accurate prediction. PLS, a strong regression engine, enables the prediction of the analyte of interest without any information about interfering constituents. It achieves a prediction accuracy comparable to that of more explicit models requiring more information.60 In order to develop the multivariate model, Raman spectra of 20 malaria infected (red/cyan color), 10 non-malaria but suffering from fever (pink color), 10 healthy (green color) and 06 dengue infected samples (black color) were used as trainees to teach the model. In Sec. 3.1, it can be seen that there are 10 distinctive Raman peaks at 837, 1172, 1226, 1339, 1357, 1393, 1552, 1586, 1603 and , which are found only in the malaria infected plasma samples. These strong malaria Raman signatures played a significant part in the development of the statistical PLS model for the differentiation of malaria from dengue and healthy ones. In addition, blood samples from 30 suspicious cases were kept hidden for a blind test of the multivariate model by the pathology department of the hospital. During the development of the multivariate model, a leave-one-sample-out (LOO) cross validation method63 was employed for authenticating the model. The LOO cross validation process was repeated for all the samples used for training the model and then the left out sample was predicted. The process was repeated as for many times as s there were samples. The predicted values of the trainee spectra through the LOO cross validation process are shown in Fig. 3 with hollow red circles as a function of clinical results. It also showed a calibration curve that was produced by the multivariate model which fitted well with the LOO cross validated predicted values. The correlation coefficient between the LOO cross validated predicted and clinical results was found to be 0.981, which showed that the validation process is accurate.63,64 In addition, the root mean square error in cross validation (RMSECV) for the entire LOO cross validated predicted values was calculated to be 0.093, which showed that the multivariate model is authenticated.65 Fig. 3This shows the calibration curve that fit best on the predicted values of the trainee samples through the LOO cross validated process (red hollow circles) verses known clinical results. It also illustrated the predicted values of 22 unknown suspected samples (blue solid circles) verses clinical results that were kept hidden during a blind test of the model.  The multivariate model generated regression curve based on the Raman spectra of the trainee sample, called the beta vector, is shown in Fig. 4. It showed the spectral line shape of the beta vector (blue color) and the Raman spectra of trainee samples are used in the development of the model. When an unknown suspected Raman spectrum is loaded in the multivariate model, it is multiplied with the beta curve and produces a correlation factor , from which the disease is predicted. The PLS regression vector (blue color) takes positive values for unique Raman peaks that appeared only in the malaria infected samples (it overlaps the malaria infected Raman signatures) and changes its sign where non-malarial/healthy or dengue infected Raman peaks or both existed. The beta vector showed strong correlation/overlapping with the Raman peaks at 1131, 1172, 1226, 1339 and , which appear only in malaria infected samples. Fig. 4This shows the PLS generated regression vector (blue color), called a beta vector, along with the Raman spectra of trainee samples used in the multivariate model. The PLS regression vector (blue color) overlaps the unique Raman peaks that appeared only in malaria-infected samples and changes its sign where non-malaria/healthy Raman peaks or dengue virus infected Raman peaks or both are existed. 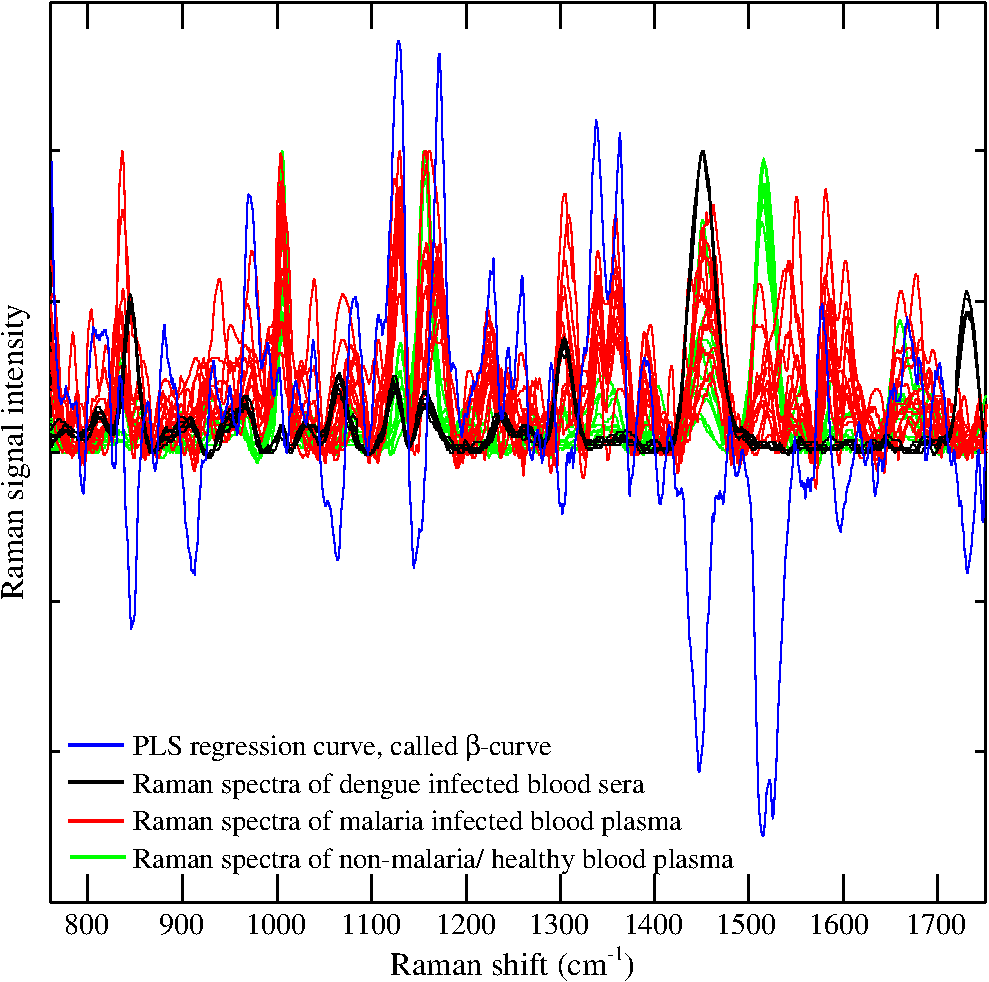 For further evaluation of the model, a blind test was performed using Raman spectra of 30 unknown suspected samples, which include malaria, dengue infected, non-malarial having fever, and healthy ones. These spectra were loaded by the model one by one to predict malaria infection. These predicted values are shown in Fig. 3 with solid circles (blue color) versus clinical results for a nice comparison. For these predicted values, root mean square error in prediction (RMSEP) was calculated to be 0.149, which showed accurate prediction of the multivariate model.63–65 Another important parameter, the standard deviation (SD) in error for 30 unknown predicted samples, was calculated to be 0.150, which is awarded the zero point score as per the scoring system of quality control for molecular diagnostics,66 therefore, these results are clinically accepted. It is evident from Fig. 3 that the prediction of malaria infection in unknown plasma/sera samples depends upon PLS prediction values. We fixed the lower limit as 0.2 for non-malaria and the upper limit as 0.8 for malaria infection. These limits were defined based on the predicted values of the trainee samples through the LOO cross validation procedure for the healthy and diseased cases. The region between both the limits is defined as a grey region. If the model predicted value of a sample lies in the grey region, it will be asked for a fresh test. The PLS predicted values between the cut off limits may have some relation with the development of disease and for that, PCR studies of disease evolution from initial to advance levels are imperative to develop a strong correlation between the plasmodium load and Raman signatures, which may be the topic of future research. The prediction accuracy of the multivariate model for unknown samples was 86% compared with the clinical results. The inaccuracy was due to the prediction of three samples in the grey region, i.e., their predicted values were found inside the limits from 0.2 to 0.8 that is defined for disease prediction. This may be due to the quality of samples and the method of obtaining the Raman spectra. Accuracy in the prediction can be increased by developing the model with a large number of samples, careful screening of blood samples through microscope for malaria confirmation, and detailed history of patients regarding their other diseases and medicines in use. Nevertheless, a lot of work is needed to put the technique into clinical practice. Comparison of the Raman spectrum of serum and plasma in Fig. 1 showed that both spectra differ for the peak at (of much lower intensity) for the spectral range of 760 to used in the development of the model, but the strong Raman signatures of malaria infection did not affect the predicted accuracy when using serum or plasma samples. Practically, we did not observe any dependence of plasma/sera samples on the prediction of malaria infection in the loaded spectrum. In the present studies, plasmodium vivax infected samples were used; therefore, the model will predict only this infection in patients. Other types of infections may induce some different biochemical changes; therefore, further studies are needed for the development of relevant model. 4.ConclusionIn conclusion, 10 distinctive Raman peaks at 837, 1172, 1226, 1339, 1357, 1393, 1552, 1586, 1603, and were found only in the malaria-infected plasma samples. The Raman peaks at 1172, 1226, 1357, are associated only with hemoglobin that is released in the extracellular media during plasmodium multiplication in RBC, whereas other Raman peaks at 1339, 1552, 1586, are associated with hemoglobin as well as amino acids that include tryptophan, tyrosine, and phenylalanine, for antibody IgM and for amide-I group, and their presence was shown only in the malaria-infected samples. These Raman lines are the outcomes of biochemical and morphological changes associated with the plasmodium vivax infection and can be used for the disease recognition. These spectral signatures may be used as biomarkers for the diagnosis of plasmodium vivax malaria infection in human plasma/sera. In addition, a multivariate model based on PLS regression is developed that utilized the Raman spectra of the malaria, dengue infected and healthy samples for the optical diagnosis of disease and was found to be 86% accurate as compared with clinical results. The inaccuracy is due to the samples that were predicted in the gray region. The results are encouraging and further rigorous research may help to include this technique in clinical discipline as an efficient, cost effective and online diagnostic tool for malaria and other infectious diseases. AcknowledgmentsM. Bilal is obliged to HEC Islamabad for providing PhD fellowship under the 5000 Scholars-Phase II scheme. We are also thankful to Mr. Saeed-ul-Hassan, laboratory assistant, for helping in sample preparation at NILOP. ReferencesWHO World malaria report, 2011, available at www.who.int/malaria/world_malaria_report_2011/en/ Google Scholar
B. Nadjm and R. H. Behrens,
“Malaria: an update for physicians,”
Infect. Dis. Clin. North Am., 26 243
–259
(2012). http://dx.doi.org/10.1016/j.idc.2012.03.010 IDCAEN 0891-5520 Google Scholar
P. K. Sarkar et al.,
“Critical care aspects of malaria,”
J. Intensive Care Med., 25 93
–103
(2010). http://dx.doi.org/10.1177/0885066609356052 0885-0666 Google Scholar
J. C. Mouatcho and J. P. Goldring,
“Malaria rapid diagnostic tests: challenges and prospects,”
J. Med. Microbiol., 62 1491
–1505
(2013). http://dx.doi.org/10.1099/jmm.0.052506-0 JMMIAV 0022-2615 Google Scholar
A. Moody,
“Rapid diagnostic tests for malaria parasites,”
Clin. Microbiol. Rev., 15 66
–78
(2002). http://dx.doi.org/10.1128/CMR.15.1.66-78.2002 CMIREX 0893-8512 Google Scholar
WHO Universal access to malaria diagnostic testing: an operational manual, 2011, available at whqlibdoc.who.int/publications/2011/9789241502092_eng.pdf Google Scholar
F. J. Lopez-Antunano,
“Microscopic diagnosis of malaria parasites in the blood,”
Diagnosis of Malaria, 37
–47 Pan American Health Organization, Washington
(1990). Google Scholar
C. Beadle et al.,
“Diagnosis of malaria by detection of Plasmodium falciparum HRP-2 antigen with a rapid dipstick antigen-capture assay,”
Lancet, 343 564
–568
(1994). http://dx.doi.org/10.1016/S0140-6736(94)91520-2 LANCAO 0140-6736 Google Scholar
J. B. Weiss,
“DNA probes and PCR for diagnosis of parasitic infections,”
Clin. Microbiol. Rev., 8 113
–130
(1995). CMIREX 0893-8512 Google Scholar
WHO technical consultation: “Parasitological confirmation of malaria diagnosis,”
http://whqlibdoc.who.int/publications/2010/9789241599412_eng.pdf Google Scholar
S. E. Francis, D. J. SullivanJr. and D. E. Goldberg,
“Hemoglobin metabolism in the malaria parasite plasmodium falciparum,”
Annu. Rev. Microbiol., 51 97
–123
(1997). http://dx.doi.org/10.1146/annurev.micro.51.1.97 ARMIAZ 0066-4227 Google Scholar
I. W. Sherman,
“Amino acid metabolism and protein synthesis in malarial parasites,”
Bull. W. H. O., 55 265
–276
(1977). Google Scholar
P. J. Rosenthal and S. R. Meshnick,
“Hemoglobin catabolism and iron utilization by malaria parasites,”
Mol. Biochem. Parasitol., 83 131
–139
(1996). http://dx.doi.org/10.1016/S0166-6851(96)02763-6 MBIPDP 0166-6851 Google Scholar
T. J. Egan, D. C. Rossa and P. A. Adams,
“Quinoline anti-malarial drugs inhibit spontaneous formation of -haematin (malaria pigment),”
FEBS Lett., 352 54
–57
(1994). http://dx.doi.org/10.1016/0014-5793(94)00921-X FEBLAL 0014-5793 Google Scholar
N. Stone et al.,
“Raman spectroscopy for identification of epithelial cancers,”
Faraday Discuss, 126 141
–57
(2004). http://dx.doi.org/10.1039/b304992b FDISE6 0301-7249 Google Scholar
N. Stone et al.,
“Near-infrared Raman spectroscopy for the classification of epithelial pre-cancers and cancers,”
J. Raman Spectrosc., 33 564
–573
(2002). http://dx.doi.org/10.1002/(ISSN)1097-4555 JRSPAF 0377-0486 Google Scholar
Z. Huang et al.,
“Near infrared Raman spectroscopy for optical diagnosis of lungs cancer,”
Int. J. Cancer, 107 1047
–1052
(2003). http://dx.doi.org/10.1002/(ISSN)1097-0215 IJCNAW 1097-0215 Google Scholar
M. Saleem et al.,
“Optical diagnosis of dengue virus infection in human blood serum using Raman spectroscopy,”
Laser Phys. Lett., 10 035602
(2013). http://dx.doi.org/10.1088/1612-2011/10/3/035602 1612-2011 Google Scholar
M. Asghari-Khiavi et al.,
“A resonance Raman spectroscopic investigation into the effects of fixation and dehydration on heme environment of hemoglobin,”
J. Raman Spectrosc., 40 1668
–1674
(2009). http://dx.doi.org/10.1002/jrs.v40:11 JRSPAF 0377-0486 Google Scholar
B. R. Wood et al.,
“Resonance Raman spectroscopy of red blood cells using near-infrared laser excitation,”
Anal. Bioanal. Chem., 387 1691
–1703
(2007). http://dx.doi.org/10.1007/s00216-006-0881-8 ABCNBP 1618-2642 Google Scholar
I. P. T. Filho et al.,
“Measurement of hemoglobin oxygen saturation using Raman microspectroscopy and 532-nm excitation,”
J. Appl. Physiol., 104 1809
–17
(2008). http://dx.doi.org/10.1152/japplphysiol.00025.2008 JAPYAA 0021-8987 Google Scholar
K. R. Ward et al.,
“Oxygenation monitoring of tissue vasculature by resonance Raman spectroscopy,”
Anal. Chem., 79 1514
–1518
(2007). http://dx.doi.org/10.1021/ac061072x ANCHAM 0003-2700 Google Scholar
G. Rusciano et al.,
“Raman tweezers as a diagnostic tool of hemoglobin-related blood disorders,”
Sensors, 8 7818
–7832
(2008). http://dx.doi.org/10.3390/s8127818 SNSRES 0746-9462 Google Scholar
A. C. De Luca et al.,
“Spectroscopical and mechanical characterization of normal and thalassemic red blood cells by Raman tweezers,”
Opt. Express, 16 7943
–7957
(2008). http://dx.doi.org/10.1364/OE.16.007943 OPEXFF 1094-4087 Google Scholar
V. Sikirzhytski, K. Virkler and I. K. Lednev,
“Discriminant analysis of Raman spectra for body fluid identification for forensic purposes,”
Sensors, 10 2869
–2884
(2010). http://dx.doi.org/10.3390/s100402869 SNSRES 0746-9462 Google Scholar
B. R. Wood and D. McNaughton,
“Resonance Raman spectroscopy in malaria research,”
Expert Rev. Proteomics, 3 525
–544
(2006). http://dx.doi.org/10.1586/14789450.3.5.525 ERPXA3 1478-9450 Google Scholar
G. T. Webster et al.,
“Resonance Raman spectroscopy can detect structural changes in haemozoin (malaria pigment) following incubation with chloroquine in infected erythrocytes,”
FEBS Lett., 582 1087
–1092
(2008). http://dx.doi.org/10.1016/j.febslet.2008.02.062 FEBLAL 0014-5793 Google Scholar
B. R. Wood et al.,
“Raman imaging of hemozoin within the food vacuole of Plasmodium falciparum trophozoites,”
FEBS Lett., 554 247
–252
(2003). http://dx.doi.org/10.1016/S0014-5793(03)00975-X FEBLAL 0014-5793 Google Scholar
D. S. Bohle et al.,
“Structural and spectroscopic studies of -haematin (the haem coordination polymer in malaria pigment),”
Inorganic and Organometallic Polymers II: Advanced Materials and Intermediates, 497
–515 American Chemical Society(1994). Google Scholar
T. Frosch et al.,
“In situ localization and structural analysis of the malaria pigment hemozoin,”
J. Phys. Chem. B, 111 11047
–11056
(2007). http://dx.doi.org/10.1021/jp071788b JPCBFK 1520-6106 Google Scholar
T. Frosch et al.,
“Morphology sensitive Raman modes of the malaria pigment hemozoin,”
Analyst, 134 1126
–1132
(2009). http://dx.doi.org/10.1039/b821705j ANLYAG 0365-4885 Google Scholar
W. Asawamahasakda et al.,
“Effects of antimalarials and protease inhibitors on plasmodial hemozoin production,”
Mol. Biochem. Parasitol., 67 183
–191
(1994). http://dx.doi.org/10.1016/0166-6851(94)00128-6 MBIPDP 0166-6851 Google Scholar
B. R. Wood et al.,
“Tip-enhanced Raman scattering (TERS) from hemozoin crystals within a sectioned erythrocyte,”
Nano Lett., 11 1868
–1873
(2011). http://dx.doi.org/10.1021/nl103004n NALEFD 1530-6984 Google Scholar
C. Yuen and Q. Liu,
“Magnetic field enriched surface enhanced resonance Raman spectroscopy for early malaria diagnosis,”
J. Biomed. Opt., 17 017005
(2012). http://dx.doi.org/10.1117/1.JBO.17.1.017005 JBOPFO 1083-3668 Google Scholar
A. J. Hobro et al.,
“Raman spectroscopic analysis of malaria disease progression via blood and plasma samples,”
Analyst, 138 3927
–3933
(2013). http://dx.doi.org/10.1039/c3an00255a ANLYAG 0365-4885 Google Scholar
Y. Park et al.,
“Static and dynamic light scattering of healthy and malaria-parasite invaded red blood cells,”
J. Biomed. Opt., 15
(2), 020506
(2010). http://dx.doi.org/10.1117/1.3369966 JBOPFO 1083-3668 Google Scholar
A. Orbán et al.,
“Evaluation of a novel magneto-optical method for the detection of malaria parasites,”
PloS One, 9 e96981
(2014). http://dx.doi.org/10.1371/journal.pone.0096981 1932-6203 Google Scholar
S. Lee and W. Lu,
“Backward elastic light scattering of malaria infected red blood cells,”
Appl. Phys. Lett., 99
(7), 073704
(2011). http://dx.doi.org/10.1063/1.3627173 APPLAB 0003-6951 Google Scholar
E. Y. Lukianova-Hleb et al.,
“Hemozoin-generated vapor nanobubbles for transdermal reagent- and needle-free detection of malaria,”
Proc. Natl. Acad. Sci., 111 900
–905
(2014). http://dx.doi.org/10.1073/pnas.1316253111 PMASAX 0096-9206 Google Scholar
Biosafety in Microbiological and Biomedical Laboratories, 21
–1112 5th ed.2009). Google Scholar
K. W. Poon et al.,
“Quantitative reagent free detection of fibrinogen levels in human blood plasma using Raman spectroscopy,”
Analyst, 137 1807
–1814
(2012). http://dx.doi.org/10.1039/c2an35042d ANLYAG 0365-4885 Google Scholar
J. L. Pichardo-Molina et al.,
“Raman spectroscopy and multivariate analysis of serum samples from breast cancer patients,”
Lasers Med. Sci., 22 229
–236
(2007). http://dx.doi.org/10.1007/s10103-006-0432-8 LMSCEZ 1435-604X Google Scholar
A. Rygula et al.,
“Raman spectroscopy of proteins: a review,”
J. Raman Spectrosc., 44 1061
–1076
(2013). http://dx.doi.org/10.1002/jrs.v44.8 JRSPAF 0377-0486 Google Scholar
L. Pasti et al.,
“Optimization of signal denoising in discrete wavelet transform,”
Chemom. Intell. Lab. Syst., 48 21
–34
(1999). http://dx.doi.org/10.1016/S0169-7439(99)00002-7 CILSEN 0169-7439 Google Scholar
Q. Wang,
“Raman spectroscopic characterization and analysis of agricultural and biological systems,”
Iowa State University,
(2013). http://lib.dr.iastate.edu/etd/13019 Google Scholar
P. Lasch,
“Spectral pre-processing for biomedical vibrational spectroscopy and microspectroscopic imaging,”
Chemom. Intell. Lab. Syst., 117 100
–114
(2012). http://dx.doi.org/10.1016/j.chemolab.2012.03.011 CILSEN 0169-7439 Google Scholar
S. Ruberto,
“Raman spectroscopic investigation of chondroitinase ABC treatment after spinal cord injury in an organotypic model,”
Syracuse University,
(2013). http://surface.syr.edu/thesis/10 Google Scholar
R. Galli et al.,
“Effects of tissue fixation on coherent anti-Stokes Raman scattering images of brain,”
J. Biomed. Opt., 19
(7), 071402
(2014). http://dx.doi.org/10.1117/1.JBO.19.7.071402 JBOPFO 1083-3668 Google Scholar
S. Keskin et al.,
“Label-free detection of proteins in ternary mixtures using surface-enhanced Raman scattering and protein melting profiles,”
J. Biomed. Opt., 18 037007
(2013). http://dx.doi.org/10.1117/1.JBO.18.3.037007 JBOPFO 1083-3668 Google Scholar
M. Culha and S. Keskin,
“Surface enhanced Raman scattering for label-free protein detection and identification,”
Proc. SPIE, 8234 823407
(2012). http://dx.doi.org/10.1117/12.906897 PSISDG 0277-786X Google Scholar
P. C. Painter and J. L. Koenig,
“Raman spectroscopic study of the structure of antibodies,”
Biopolymers, 14 457
–468
(1975). http://dx.doi.org/10.1002/(ISSN)1097-0282 BIPMAA 0006-3525 Google Scholar
Z. Movasaghi, S. Rehman and I. U. Rehman,
“Raman Spectroscopy of Biological Tissues,”
Appl. Spectros. Rev., 42 493
–541
(2007). http://dx.doi.org/10.1080/05704920701551530 APSRBB 0570-4928 Google Scholar
D. A. Hughes,
“Effects of carotenoids on human immune function,”
Proc. Nutr. Soc., 58 713
–718
(1999). http://dx.doi.org/10.1017/S0029665199000932 0029-6651 Google Scholar
W. R. Premasiri, J. C. Lee and L. D. Ziegler,
“Surface enhanced Raman scattering of whole human blood, blood plasma and red blood cells: cellular processes and bioanalytical sensing,”
J. Phys. Chem. B, 116 9376
–9386
(2012). http://dx.doi.org/10.1021/jp304932g JPCBFK 1520-6106 Google Scholar
M. Cansev and R. J. Wurtman,
“Aromatic amino acids in the brain,”
Handbook of Neurochemistry and Molecular Neurobiology, 59
–97 3rd ed.Springer-Verlag, Berlin, Heidelberg
(2007). Google Scholar
E. Blomstrand,
“Amino acids and central fatigue,”
Amino Acids, 20 25
–34
(2001). http://dx.doi.org/10.1007/s007260170063 AACIE6 0939-4451 Google Scholar
L. M. Castell et al.,
“The role of tryptophan in fatigue in different conditions of stress,”
Adv. Exp. Med. Biol., 467 697
–704
(1999). http://dx.doi.org/10.1007/978-1-4615-4709-9 AEMBAP 0065-2598 Google Scholar
T. Yamamoto, H. Azechi and M. Board,
“Essential role of excessive tryptophan and its neurometabolites in fatigue,”
Can. J. Neurol. Sci., 39 40
–47
(2012). http://dx.doi.org/10.1017/S031716710001266X CJNSA2 0317-1671 Google Scholar
E. V. Thomas and D. M. Haaland,
“Comparison of multivariate calibration methods for quantitative spectral analysis,”
Anal. Chem., 62 1091
–1099
(1990). http://dx.doi.org/10.1021/ac00209a024 ANCHAM 0003-2700 Google Scholar
A. J. Berger, I. Itzkan and M. S. Feld,
“Feasibility of measuring blood glucose concentration by near-infrared Raman spectroscopy,”
Spectrochim. Acta A: Mol. Biomol. Spectrosc., 53 287
–292
(1997). http://dx.doi.org/10.1016/S1386-1425(96)01779-9 SAMCAS 1386-1425 Google Scholar
A. M. K. Enejder et al.,
“Blood analysis by Raman spectroscopy,”
Opt. Lett., 27 2004
–2006
(2002). http://dx.doi.org/10.1364/OL.27.002004 OPLEDP 0146-9592 Google Scholar
H. Martens and T. Naes, Multivariate Calibration, Wiley, New York
(1989). Google Scholar
J. B. Henry,
“Clinical diagnosis and management by laboratory methods,”
19th ed.Saunders, Philadelphia
(1996). Google Scholar
C. W. Anderson and S. A. Rounds,
“Use of continuous monitors and autosamplers to predict unmeasured water quality constituents in tributaries of the Tualatin River, Oregon,”
(2010). Google Scholar
H. J. Staines et al.,
“Monitoring performance of nucleic acid-based diagnostic measurement system users by EQA,”
Accred. Qual. Assur., 14 243
–252
(2009). http://dx.doi.org/10.1007/s00769-009-0510-2 AQASF3 0949-1775 Google Scholar
BiographyMuhammad Bilal received his MSc in physics from Allama Iqbal Open University, Islamabad, Pakistan, in 2002. He got his MEng. in nuclear power from NED University, Karachi, Pakistan, in 2007. He joined the biophotonics group at the National Institute of Lasers and Optronics, Islamabad, Pakistan, in 2011 and is working on the Raman spectroscopic studies of infectious diseases. Currently he is a PhD student from PIEAS, Islamabad, Pakistan. Muhammad Saleem received his PhD in atomic physics from QAU Islamabad, Pakistan, in 2007. In 2011, he was on postdoc with the biophotonics group at the Atomic Physics Division, Lund University, Sweden, working on the development of photon time of flight spectroscopic technique for optical mammography. Currently, he is leading a research group the Agri. & Biophotonics research group at the National Institute of Lasers and Optronics, Islamabad, Pakistan. He is the author of 19 research papers. Samina Tufail Amanat is a consultant hematologist at PAEC General Hospital Islamabad, Pakistan. She did her MBBS in 1985 from F.J.M.C. Lahore, diploma in blood transfusion in 1998 from Punjab University, Lahore, and F.C.P.S. in hematology in 1999. She was on WFH fellowship in hemostasis at Sheffield, UK in 2006. Currently, she is supervising 8 post-graduate trainee doctors and several research projects. Huma Abdul Shakoor is a senior medical officer of the Pathology Department of PAEC General Hospital Islamabad, Pakistan. She did her MBBS in 2005 from Rawalpindi Medical College and F.C.P.S in hematology in 2013. At present she is working at PAEC General Hospital. Rashad Rashid obtained his MSc degree in physics from the University of Punjab Lahore and MPhil from PIEAS in 2009. Currently, he is working as senior scientist at the National Institute of Laser and Optronics (NILOP) Islamabad. His area of research is semiconductor thin film synthesis and characterization. He is author of four international publications. Arshad Mahmood received his MSc and MPhil degree from Quaid-e-Azam University, Islamabad. He earned his PhD in materials science from Autonomous University of Mexico in 2000. Currently he is working as HOD of the material science division at NILOP. The main emphasis of his group is to develop blue laser diodes. He supervised several MS and PhD students and is the author of more than 60 international publications. Mushtaq Ahmed received his PhD degree in atomic physics from Quaid-i-Azam University, Islamabad, Pakistan, in 1997. He was on postdoc at the University of Sao Paulo Brazil in 2007, working on cesium atomic beam clock. Currently, he is officiating as director of the National Institute of Lasers and Optronics, Islamabad, Pakistan. His research areas are agriculture, biophotonics, laser spectroscopy, laser cooling and trapping, and thin film growth. He is the author of 25 research papers. |


