
|
|
1.IntroductionChronic wounds have been a major public health problem that greatly diminish patients’ quality of life and cost hundreds of billions of dollars for treatment.1 Generally, a regular wound healing process involves the reparative phases of inflammation, proliferation, and remodeling.2 Diseases such as diabetes may interrupt the regular healing phases and result in chronically unhealed wounds, amputation, or even patient death. Quantitative assessment of wound tissue ischemia, perfusion, and inflammation provides critical information for appropriate detection, staging, and treatment of chronic wounds. Emerging optical imaging tools are able to characterize tissue properties of a large wound area in a rapid, reliable, cost effective, and noninvasive fashion. In the past years, many portable optical imaging systems, such as multispectral imaging, laser speckle imaging, and thermography, have been developed for the noninvasive assessment of wound functional characteristics. Wound spectroscopic imaging captures the diffuse reflectance at different wavelengths and reconstructs critical tissue parameters such as oxygen saturation ().3–7 Several multispectral image systems have been successfully applied to assess skin diseases8,9 and wound healing.10–12 In addition to oxygen saturation, blood vessel evolution is also involved in different phases of wound healing for continuous supply of oxygen and nutrition.2 In this regard, laser speckle imaging provides a high resolution optical method for monitoring tissue hemodynamics and vessel redistribution.13–16 A laser speckle imaging system acquires the mutual interference of a set of wave fronts formed by a laser light casting on tissue and reconstructs the blood perfusion characteristics by laser speckle contrast analysis (LASCA). Thermographic imaging provides indirect information associated with tissue inflammation. Inflammation is an initial response of the body to harmful stimuli and is the first phase induced in a wound healing process. During this phase, the increased movement of plasma and leukocytes from the blood into the injured tissues followed by a cascade of inflammatory responses may bring the change of heat emission. Inflammation is a potential marker of diabetic foot ulcers that can be identified by temperature assessments of the affected limbs.17,18 Thermography has been used to identify latent inflammation in diabetic feet and pressure ulcers where the higher temperature in the wound site may imply the presence of inflammation, critical colonization, or other factors which disturb the wound healing.18,19 Although various thermological techniques have been used to detect temperature distribution and thermal properties of biologic tissue,20,21 it is still difficult to quantitatively correlate wound tissue temperature change with inflammation because other pathophysiologic conditions, such as perfusion, infection, and metabolism, also contribute to tissue temperature fluctuations. In summary, oxygen saturation, perfusion, and inflammation are important tissue parameters associated with successful wound healing. Various methods, such as multispectral imaging, laser speckle imaging, and thermographic imaging, have been used for quantitative assessment of wound tissue oxygenation, perfusion, and inflammation. However, these important tissue parameters cannot be detected simultaneously in a single setting. We have integrated hyperspectral, laser speckle, and thermographic imaging modalities in a single-experimental setup for multimodal assessment of wound healing. The multimodal imaging system was validated in an occlusion experiment where oxygenation, perfusion, and heat emission of a healthy subject’s upper extremity were continuously monitored and compared with standard measurements during a postocclusive reactive hyperemia (PORH) procedure. The imaging system was further used to monitor the wound healing process in a clinical trial approved by Institutional Review Board (IRB) of The Ohio State University (IRB No: 2011H0286). A wound of 3 mm in diameter was introduced on a healthy subject’s lower extremity and the healing process was continuously monitored by the multimodal imaging setup. This clinical trial demonstrated the clinical usability of multimodal imaging in wound healing assessment. 2.Materials and Methods2.1.Experimental SetupAs shown in Fig. 1, the integrated multimodal wound imaging system consists of a hyperspectral imaging module, a laser speckle imaging module, and a thermographic imaging module. The hyperspectral imaging module consists of a PIKA II hyperspectral line scan imager (Resonon, Bozeman, Montana) operated in a wavelength range from 400 to 900 nm, with a spectral resolution of 2 nm and a linear resolution of 640 pixels. The imager was driven by a motorized stage to scan along one direction at a designated step size and speed so that a two-dimensional hyperspectral image can be acquired within a specific field-of-view. A broad band halogen lighting system (Resonon) provided stable illumination during scanning. Before image acquisition, the system was calibrated following a standard procedure of setting exposure time, adjusting focal plane, compensating for dark current, and spectral response correction. For spectral response correction, a Fluorilon reflectance standard (Avian Technologies, LLC, Sunapee, New Hampshire) with the highest diffuse reflectance was used. To minimize the measurement bias caused by illumination condition variations, a National Institute of Standards and Technology (NIST) traceable diffuse reflectance standard was placed next to the region of interest (ROI) during hyperspectral imaging. Cutaneous tissue oxygenation maps were then reconstructed by spectral analysis of the hyperspectral data cube. A PeriCam PSI laser speckle system (Perimed Inc., Ardmore, Pennsylvania) was used to acquire the intensity fluctuations of the speckle pattern and converted them into blood perfusion characteristics using LASCA. A ThermalVision A40 infrared camera (FLIR Systems, Boston, Massachusetts) with a spatial resolution of 1.3 mrad and thermal sensitivity of 0.08°C was used to monitor thermal emissivity of the tissue surface relevant to inflammation, perfusion, and fat components. The above three imaging modalities were mounted on two orthogonally motorized linear stages and driven by a Labview program so that the field-of-view of each imaging modality can fit in the same ROI. The imaging system was mounted on a motorized table and its height is adjustable for appropriate field-of-views in biological tissues. Fig. 1Schematic diagram of the integrated multimodal imaging system. The system consists of a hyperspectral linear scan imager, a thermographic imager and a laser speckle imager, two motorized linear stages, a broad band light source, a National Institute of Standards and Technology (NIST) traceable white diffuser, and an operating computer.  2.2.Occlusion ExperimentThe multimodal imaging system was validated in an occlusion experiment where noncontact images of a healthy subject’s upper extremity were compared with concurrent measurements by standard contact sensors, as illustrated in Fig. 2(a). The standard sensors consisted of two PF5040 units and a PF5010 unit of a PeriFlux system 5000 (Perimed, Kings Park, New York). The PF5040 units (including two electrodes) measured transcutaneous tissue oxygen tension (). The PF5010 unit (including a 404 probe) was used for laser Doppler perfusion monitoring (LDPM). A pressure cuff was used to occlude the subject’s upper extremity. A PeriSoft software package was used to collect the measurement data. Before measurement, the subject was asked to relax in the test room for at least 30 min in order to stabilize the physiologic rhythms and reduce the temperature difference between the subject and the room. The subject’s upper arm was gently placed on the operating bed and kept steady. A probe 404 of the PF5010 unit and a electrode of the PF5040 unit were attached side by side on the subject’s forearm skin for continuous monitoring of blood perfusion and oxygen partial pressure, respectively. The measurement of oxygen partial pressure was used to validate the multispectral oximetry technique because of an approximately linear correlation between oxygen saturation and oxygen tension in an oxygen saturation range from 20% to 80%.22 The focus points and the fields-of-view of the individual modalities in the multimodal imaging system were finely tuned so that the tissue ROIs defined within a square fiducial marker were imaged. Figure 2(b) shows the probes and the fiducial marker placed on the upper extremity of the subject. Before the experiment, a pressure cuff was placed around the upper arm of the subject and the baseline tissue parameters were monitored by the PeriFlux system 5000 and compared with that by the multimodal imaging system. After 2 min of baseline measurement, the upper arm was occluded by the pressure cuff at above for another 2 min. Then, the cuff was released for 2 min of reactive hyperemia. During the above process, dynamic changes of the tissue parameters were monitored by the multimodal imaging system and compared with the standard measurements. 2.3.Wound Healing MonitoringTissue parameter changes during the wound healing process were continuously monitored by the multimodal imaging system in a clinical trial following an IRB approved test protocol. A healthy subject rested in a test bed for 30 min with a fiducial marker of square frame placed on the lower extremity. A cutaneous wound of 3 mm in diameter was introduced by a biopsy punch at the center of the fiducial marker. Multimodal images were acquired before and after biopsy using hyperspectral, laser speckle, and thermographic imaging modalities. The healing of the wound was monitored by successive imaging sessions on the designated days for 1 month after biopsy. In each imaging session, the fiducial marker was placed on the wounded skin with its center aligned to the center of the wound. The position and the orientation of the fiducial marker remained consistent for different imaging modalities and during individual image sessions. 2.4.Imaging AlgorithmsImaging algorithms in the integrated multimodal imaging system were developed to accomplish the following two primary tasks: (1) quantitative assessment of tissue oxygen and tissue perfusion, and (2) coregistration of the images acquired by different modalities and in different imaging sessions. Many conventional hyperspectral imaging systems provide only relative assessment of tissue oxygenation because of the measurement artifacts induced by skin pigmentation, scattering, and background absorption. We have previously proposed a multispectral imaging algorithm that uses the wide gap second-derivative reflectance spectra for quantitative assessment of tissue oxygenation.23 This algorithm simulated the reflectance spectra of multilayered skin tissue at different oxygen saturation, blood, tissue scattering, and melanin levels using an empirical model calibrated by Monte Carlo simulation. Based on the simulation results, a second derivative ratio parameter was derived and optimized for multispectral reconstruction of tissue oxygenation regardless of variations in tissue conditions. Previous experiments have demonstrated that the proposed multispectral imaging algorithm was able to monitor cutaneous tissue oxygenation with minimal artifacts at different tissue conditions.24 In this paper, a modified hyperspectral imaging algorithm was adopted for in vivo imaging of wound tissue oxygenation based on the wavelength range and the high resolution of the hyperspectral imager. The algorithm treated the apparent absorption of skin tissue from 520 to 585 nm as a linear combination of oxy-hemoglobin, deoxy-hemoglobin, and a linear function modulated by background scattering and melanin concentration.22 Diffuse reflectance at the designated wavelengths was calculated by taking the ratio between the acquired image intensity and the intensity of a National Institute of Standard and Technology (NIST) traceable reflectance standard. Hyperspectral tissue absorption spectrum was calculated by . The artifacts of scattering and melanin were corrected by assuming a linear contribution () to the absorption spectrum. Therefore, , where is the contribution from melanin and scattering, is the total hemoglobin concentration and is extinction coefficient of four isosbestic points where are 530, 545, 570, and 584 nm. and can be obtained by a linear fitting method. Then the corrected absorption spectrum is the absorption only from hemoglobin. Thus, , where and are the concentrations of oxy- and deoxy-hemoglobin, extinction coefficient of oxy- and deoxy-hemoglobin, respectively. In order to obtain and , the linear fitting method Levenberg–Marquardt algorithm was used to minimize the mean square error. Therefore, the oxygen saturation is . For an ROI around the wound tissue, we averaged oxygen saturation of all points in the ROI and took the average value as the oxygen saturation of the ROI. Perfusion characteristics of wound tissue were acquired with an LASCA method. Illuminating biologic tissue by coherent and monochromatic laser light produces an interference pattern (i.e., a speckle pattern) on the tissue surface. The intensity fluctuations of the speckle pattern were recorded by the laser speckle imaging module. By analyzing these intensity fluctuations, the perfusion characteristics of the tissue could be obtained. In LASCA, spatial contrast was defined as the standard deviation of the intensity fluctuations divided by their mean intensity, in a small region of the image. To calculate the contrast from intensity and variance pairs, the following equation should be used: , where is the spatial contrast, and denote the variance and the intensity, respectively, and is the coherence factor that is determined by a calibrate experiment. The perfusion was calculated from the contrast as follows: , where is the perfusion of the small region of the image and is the signal gain factor. The signal gain factor was calibrated to ensure the designated perfusion values on a flux standard just as the coherence factor was. Figure 3(a) shows the hyperspectral, thermographic, and laser speckle images of the same wound tissue on different days before and after skin biopsy. These images were acquired by different modalities with different focus lengths, orientations, and fields-of-view. Therefore, priori coregistration of the selected ROIs was necessary. Considering that the fiducial marker remained stationary on the subject’s lower extremity throughout each imaging session, it was rational to use the geometric features on the fiducial marker for coregistration of the multimodal images in each session. In this regard, four points at the inner corners of the fiducial marker were selected as the control points. As shown in Fig. 3(a), the control points were determined by calculating the intersection of two perpendicular lines that represented the inner edges of the fiducial markers. Once the corresponding control points in the multimodal images acquired in the same image session were identified and paired, coregistration of these images was achieved by applying a transform matrix that translated and rescaled each image for identical matching of the control points. Fig. 3Image coregistration in wound healing monitoring, (a) images from different imaging sessions and different imaging modalities; (b) selecting corresponding pores as control point pairs; (c) fusion result of the images from the hyperspectral imager at different imaging sessions; (d) fusion result of the images from the three modalities at the same imaging session. 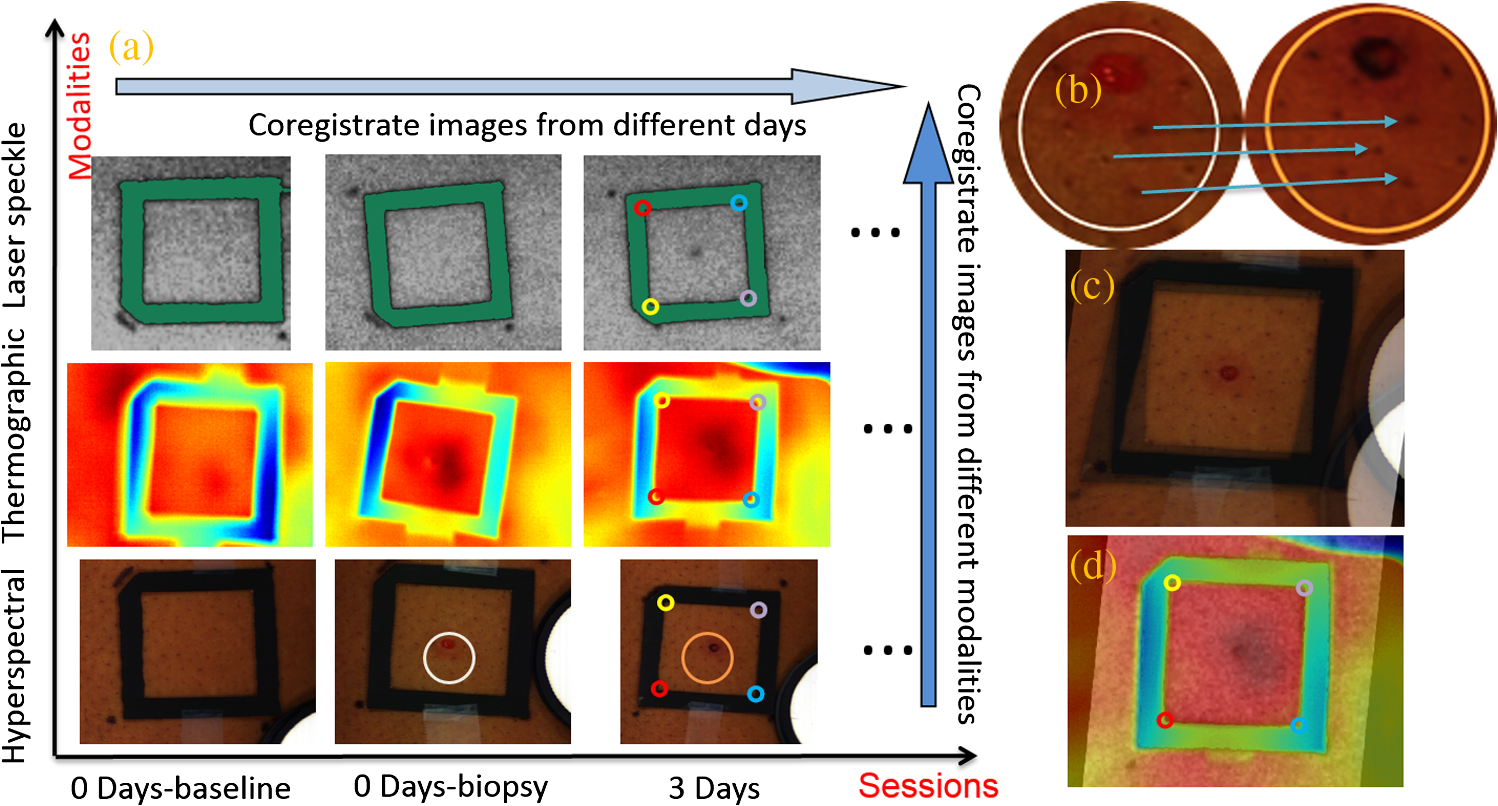 The fiducial marker method was not appropriate for coregistering multimodal images acquired on different days during the wound healing procedure because the position and the orientation of the fiducial marker cannot be kept consistent in different imaging sessions. To overcome this problem, we used pores in the test subject’s skin as a natural marker for coregistration. These biologic features were intrinsic and did not change dramatically during the wound healing process. To implement the coregistration algorithm, we first defined an ROI within the hyperspectral images acquired in different imaging sessions. Then, we identified three or more characteristic pores within the ROI, found their counterparts in the individual hyperspectral images, and calculated their weighted centers. The accurate positions of these pores in different imaging sessions were determined and the coordinates of the corresponding control points were calculated, as exemplified in Fig. 3(b). Once three or more pairs of control points were determined between two un-registered images, a spatial transformation matrix could be derived by an affine transformation method. In affine transformation, the planar feature of the multimodal images might be translated, scaled, or sheared independently: , where and denote the coordinates of the control points in two images, respectively; is a matrix that contains six unknown elements, thus at least three control point pairs were needed to solve . If more control point pairs were selected, a least-square solution was utilized to enhance the accuracy. After the spatial transform was obtained, the image can be transformed according to and can be registered to a single fusion image. Figures 3(c) and 3(d) display the fusion result of the images from different modalities and different imaging sessions, respectively. Image coregistration based on the intrinsic biologic features such as pores is a new method that provides tissue information within a consistent ROI on different days of the wound healing procedure. In order to evaluate the accuracy of this coregistration method, we placed four round objects on the subject’s skin within the ROI to simulate different skin geometric features. Hyperspectral images were acquired from different points of view and different fields-of-view, simulating the scenario of different imaging sessions, as shown in Figs. 4(a)–4(c). Figures 4(d) and 4(e) show the corresponding images after pore-based coregistration. According to the figures, appropriate coregistration is achieved for not only the pores but also the round objects placed within the ROI. Quantitative analysis of the coregistrated round objects acquired in different imaging sessions yields an overall overlapping rate of above 95%, indicating the technical feasibility for tracing the same ROI with accuracy in different imaging sessions of the wound healing process. Fig. 4Coregistration results based on pores. (a–c) three hyperspectral images from various sessions, three circles (blue, green, and red) on the images denote the pores selected for coregistration. Numbers 1 to 4 denote the four round objects utilized to check the coregistration accuracy, respectively; (d) image fusion between (a) and (b) after pore-based coregistration; (e) image fusion between (a) and (c) after pore-based coregistration; (f) overlapping rates of the objects in different imaging sessions after pore-based coregistration. The averaged overlapping rate between images (a) and (b) is 97.3%, while that of (a) and (c) is 98.9%.  3.Results and Discussion3.1.Occlusion DynamicsWith the above experimental setup and algorithm development, the dynamics of the functional characteristics of the tissue were acquired and analyzed. Figure 5 shows the dynamic changes of tissue functional parameters during a PORH process that involves successive stages of baseline, occlusion, and recovery. Figure 5 plots, from top down, the dynamic changes of the transcutaneous tissue oxygen partial pressure (, monitored by PF5040), tissue perfusion (measured by LDPM), tissue (reconstructed from the acquired hyperspectral images), tissue perfusion (reconstructed from the acquired laser speckle images), and thermographic measurement of heat emission. According to the figure, all the above tissue parameters demonstrate the corresponding dynamics in response to three stages of the PORH process. However, their response rates are different, as shown in Fig. 5. Unlike the perfusion and the oxygen saturation profiles that show agile responses to vessel occlusion and recovery, the dynamics of and thermal emission are relatively lagged and slow. The retarded may be explained by slow diffusion and transport of oxygen from capillary blood to red blood cells in response to tissue metabolic changes.25,26 In addition, the electrode placed on the surface of the skin tissue also contributes to the delayed response. The retarded thermographic response is associated with the convective heat transfer by the capillary blood flow, the conduction of heat from capillary blood to skin tissue, and the heat dissipation to the surrounding environment.27 At the normal physiologic condition, a relatively constant skin temperature is maintained by keeping a balance between heat transfer from capillary blood to surrounding tissue and heat dissipation from skin tissue to environment. In the case of vascular occlusion where blood perfusion is inhibited, the rate of heat transfer from vascular blood to skin tissue is significantly reduced, whereas heat dissipation from skin tissue to environment remains similar, leading to a decreased skin temperature profile as plotted in Fig. 5(e). Considering the time for heat transfer from capillary blood to skin surface and the thermal inertia of the skin tissue, the thermographic measurements are relatively slow in response to vascular occlusion and recovery. The above experiment results have verified the capability of our multimodal imaging system for simultaneous monitoring of multiple tissue parameters in a noninvasive and quantitative fashion. Further analysis of these tissue parameters and their responses to a dynamic process such as PORH may help us to establish a mathematical model of tissue perfusion and metabolism for quantitative identification of tissue anomalies. Fig. 5Occlusion dynamics during the postocclusive reactive hyperemia process. Blue lines denote and tissue perfusion measured by the standard contact sensors, respectively, (a and b); while red lines denote , perfusion, and heat emission of the tissue obtained from the integrated multimodal imaging system, respectively (c–e).  3.2.Wound Healing ProcessAfter the multimodal images were acquired and coregistered throughout the whole wound healing process, the dynamic changes of tissue functional parameters within the specific ROIs can be reconstructed and analyzed. For this purpose, eight ROIs were selected on the wound tissue and the tissue parameters were averaged within each ROI. ROI #1 represented the area that exactly covered the introduced wound, whereas ROIs #2 to #8 denoted the adjacent torus areas from the wound center to surrounding tissue, respectively. Figures 6(a), 6(b), and 6(c) display dynamic changes of oxygen saturation, perfusion and heat emission of wound tissue and surrounding tissue during the healing process according to ROIs, respectively. It is observed from the baseline hyperspectral images that the oxygen saturation levels are even before the introduction of a cutaneous wound. As the wound is introduced through biopsy, oxygen saturation levels decrease gradually from the center of the wound to the outside areas regardless of the date of the healing process. The only exception is that the oxygen saturation of ROI #1 (i.e., the center of the wound) is lower. The reduced oxygenation at the center of the wound is due to coagulation and scar formation within 2 weeks after biopsy. The oxygen saturation of ROI #1 increases in the last two imaging sessions of the healing process as the scar drops off and the new skin tissue is exposed. For the assessment of the whole wound tissue, oxygen saturation increases rapidly immediately after biopsy, followed by a slow decrease until it reaches the lowest point on Day 7. After Day 7, the oxygen saturation levels in the most of the ROIs increase until they reach the levels similar to that of the baseline before biopsy. Fig. 6Results of wound healing monitoring. (a), (b), and (c) represent the dynamics of , perfusion, and heat emission of regions of interest (ROIs) around wound tissue in the wound healing process, respectively.  Similar to oxygen saturation, the perfusion in different ROIs is evenly distributed before the introduction of the cutaneous wound. After biopsy, the perfusion dynamics of different ROIs vary significantly. However, the averaged perfusion level over all the ROIs increases immediately after biopsy for 3 days, fluctuates for 2 weeks, and sharply decreases on Day 16. Such a dynamic change of the vascular perfusion may be associated with the tissue proliferation and vascular remodeling of the wound healing process. The perfusion levels within various ROIs finally converge to that of the baseline before biopsy. Similar to the case of oxygen saturation, the perfusion levels of the ROIs around the wound decrease from the center of the wound to the surrounding tissue, indicating the increased delivery of oxygen and nutrition to facilitate wound healing. The thermographic images are also analyzed to reveal the heat emission changes during the wound healing process. To overcome the measurement deviation due to the room temperature fluctuation in different imaging sessions, we set the thermo graphic measurement in ROI #8 as a reference point to calculate the relative thermal emissions of other ROIs, as plotted in Fig. 6(c). It can be seen from the figure that the relative heat emission of the tissue decreases from the center of the wound to the edge immediately after biopsy till Day 9. However, this distribution is reversed after Day 14. This phenomenon implies that inflammation may spread from the center of the wound to the boundary. With dynamic imaging of tissue oxygenation, perfusion, and thermal emission, it is possible to identify different phases of the wound healing process and provide quantitative guidance for different therapeutic options. However, the functional dynamics of these tissue parameters do not follow the coincident pattern, making it important to adopt the proposed multimodal imaging system for appropriate detection of chronic wounds and optimal design of the compatible therapy. 4.Conclusions and PerspectivesWe proposed an integrated multimodal imaging system for noninvasive monitoring of tissue oxygenation, perfusion, and thermal emission during the wound healing process. The integrated multimodal imaging system has been developed and validated in an in vivo experiment following the PORH procedure. In addition to wound healing, the proposed multimodal imaging technique may also be used in many other applications, such as skin grafting assessment and image-guided amputation. As the future work, we will develop and clinically validate a low cost and portable multimodal imaging system for rapid assessment of tissue functional parameters. AcknowledgmentsThis research was sponsored by National Institute of Standards and Technology (60NANB10D184), US Army Medical Research Acquisition Act (W81XWH-11-2-0142) and National Science Foundation of China (81271527, 81327803). This study was supported in part by the NIH R01 grants GM069589, GM077185, and NR013898 to CKS and in part by NIH DK076566 to SR. ReferencesC. K. Senet al.,
“Human skin wounds: a major and snowballing threat to public health and the economy,”
Wound Repair Regen., 17
(6), 763
–771
(2009). http://dx.doi.org/10.1111/wrr.2009.17.issue-6 WREREU 1067-1927 Google Scholar
A. J. SingerR. A. Clark,
“Cutaneous wound healing,”
N. Engl. J. Med., 341
(10), 738
–746
(1999). http://dx.doi.org/10.1056/NEJM199909023411006 NEJMAG 0028-4793 Google Scholar
F. Gottrup,
“Oxygen in wound healing and infection,”
World J. Surg., 28
(3), 312
–315
(2004). http://dx.doi.org/10.1007/s00268-003-7398-5 WJSUDI 0364-2313 Google Scholar
J. R. Weberet al.,
“Multispectral imaging of tissue absorption and scattering using spatial frequency domain imaging and a computed-tomography imaging spectrometer,”
J. Biomed. Opt., 16
(1), 011015
(2011). http://dx.doi.org/10.1117/1.3528628 JBOPFO 1083-3668 Google Scholar
A. Mazharet al.,
“Wavelength optimization for rapid chromophore mapping using spatial frequency domain imaging,”
J. Biomed. Opt., 15
(6), 061716
(2010). http://dx.doi.org/10.1117/1.3523373 JBOPFO 1083-3668 Google Scholar
D. E. Myerset al.,
“Noninvasive method for measuring local hemoglobin oxygen saturation in tissue using wide gap second derivative near-infrared spectroscopy,”
J. Biomed. Opt., 10
(3), 034017
(2005). http://dx.doi.org/10.1117/1.1925250 JBOPFO 1083-3668 Google Scholar
S. A. Shahet al.,
“Cutaneous wound analysis using hyperspectral imaging,”
Biotechniques, 34
(2), 408
–413
(2003). BTNQDO 0736-6205 Google Scholar
K. J. Zuzaket al.,
“Active DLP hyperspectral illumination: a noninvasive, in vivo system characterization visualizing tissue oxygenation at near video rates,”
Anal. Chem., 83
(19), 7424
–7430
(2011). http://dx.doi.org/10.1021/ac201467v ANCHAM 0003-2700 Google Scholar
D. JakovelsJ. Spigulis,
“2-D mapping of skin chromophores in the spectral range 500–700 nm,”
J. Biophotonics, 3
(3), 125
–129
(2010). http://dx.doi.org/10.1002/jbio.v3:3 JBOIBX 1864-063X Google Scholar
A. Basiriet al.,
“Use of a multi-spectral camera in the characterization of skin wounds,”
Opt. Express, 18
(4), 3244
–3257 http://dx.doi.org/10.1364/OE.18.003244 OPEXFF 1094-4087 Google Scholar
E. P. Michaelet al.,
“Measurement of optical properties to quantify healing of chronic diabetic wounds,”
Wound Repair Regen., 14
(3), 364
–370
(2006). http://dx.doi.org/10.1111/wrr.2006.14.issue-3 WREREU 1067-1927 Google Scholar
D. YudovskyA. NouvongL. Pilon,
“Hyperspectral imaging in diabetic foot wound care,”
J. Diabetes Sci. Technol., 4
(5), 1099
–1113
(2010). http://dx.doi.org/10.1177/193229681000400508 1932-2968 Google Scholar
A. Regeet al.,
“In vivo laser speckle imaging reveals microvascular remodeling and hemodynamic changes during wound healing angiogenesis,”
Angiogenesis, 15
(1), 87
–98
(2012). http://dx.doi.org/10.1007/s10456-011-9245-x 0969-6970. Google Scholar
S. H. Tsenget al.,
“Chromophore concentrations, absorption and scattering properties of human skin in-vivo,”
Opt. Express, 17
(17), 14599
–14617
(2009). http://dx.doi.org/10.1364/OE.17.014599 OPEXFF 1094-4087 Google Scholar
D. A. BoasA. K. Dunn,
“Laser speckle contrast imaging in biomedical optics,”
J. Biomed. Opt., 15
(1), 011109
(2010). http://dx.doi.org/10.1117/1.3285504 JBOPFO 1083-3668 Google Scholar
D. Briers,
“Laser speckle contrast analysis (LASCA) for measuring blood flow,”
Microcirculation Imaging, Wiley-VCH Verlag GmbH & Co. KGaA, Weinheim, Germany
(2012). Google Scholar
M. Bhararaet al.,
“Wound inflammatory index: a “proof of concept” study to assess wound healing trajectory,”
J. Diabetes Sci. Technol., 4
(4), 773
–779
(2010). http://dx.doi.org/10.1177/193229681000400402 1932-2968 Google Scholar
K. Nishideet al.,
“Ultrasonographic and thermographic screening for latent inflammation in diabetic foot callus,”
Diabetes Res. Clin. Pract., 85
(3), 304
–309
(2009). http://dx.doi.org/10.1016/j.diabres.2009.05.018 DRCPE9 0168-8227 Google Scholar
G. Nakagamiet al.,
“Predicting delayed pressure ulcer healing using thermography: a prospective cohort study,”
J. Wound Care, 19
(11), 465
–466
(2010). http://dx.doi.org/10.12968/jowc.2010.19.11.79695 0969-0700 Google Scholar
M. HorzicD. BunozaK. Maric,
“Three-dimensional observation of wound temperature in primary healing,”
Ostomy Wound Manage., 42
(8), 38
–40
(1996). Google Scholar
P. A. Patelet al.,
“A self-heated thermistor technique to measure effective thermal properties from the tissue surface,”
J. Biomech. Eng., 109
(4), 330
–335
(1987). http://dx.doi.org/10.1115/1.3138689 JBENDY 0148-0731 Google Scholar
A. N. Bashkatovet al.,
“Optical properties of human skin, subcutaneous and mucous tissues in the wavelength range from 400 to 2000 nm,”
J. Phys. D: Appl. Phys., 38 2543
(2005). http://dx.doi.org/10.1088/0022-3727/38/15/004 JPAPBE 0022-3727 Google Scholar
J. Huang,
“Multispectral imaging of skin oxygenation,”
The Ohio State University,
(2012). Google Scholar
R. X. Xuet al.,
“Dual-mode imaging of cutaneous tissue oxygenation and vascular thermal reactivity,”
J. Vis. Exp.,
(46), e2095
(2010). http://dx.doi.org/10.3791/2095 JVEOA4 1940-087X Google Scholar
R. M. LeachD. F. Treacher,
“Oxygen transport-2. Tissue hypoxia,”
BMJ, 317
(7169), 1370
–1373
(1998). http://dx.doi.org/10.1136/bmj.317.7169.1370 BMJOAE 0007-1447 Google Scholar
D. F. TreacherR. M. Leach,
“Oxygen transport-1. Basic principles,”
BMJ, 317
(7168), 1302
–1306
(1998). http://dx.doi.org/10.1136/bmj.317.7168.1302 BMJOAE 0007-1447 Google Scholar
J. W. Valvano,
“The use of thermal diffusivity to quantify tissue perfusion,”
Massachusetts Institute of Technology,
(1981). Google Scholar
|


