|
|
1.IntroductionGastric cancer is the second most frequent cause of cancer-related deaths globally,1 and 60% of these deaths occur in East Asia, which includes Japan.2 Esophagogastroduodenoscopy (EGD) is widely used for the screening of gastric cancer in Japan3; however, the reported miss rate for gastric cancers is .4 The detection rate for gastric cancer is greatly influenced by the examiner’s skills. Therefore, development of an endoscopy system is required that can accurately detect gastric cancer regardless of the examiner’s skill. Currently, various image-enhanced endoscopy systems are being developed5,6; however, they are not sufficient to improve the detection rate of gastric cancers. We are working to apply hyperspectral imaging (HSI) technology to the development of a new diagnostic method for gastric cancer.7 HSI represents a hybrid modality of optical diagnostics that obtains spectroscopic information and renders it in image form.8 This technology has been used in the field of remote sensing. The HSC1701 hyperspectral camera (HSC) (EBA JAPAN Co., Tokyo, Japan) incorporates HSI technology, and in images captured using the HSC each pixel contains the spectral reflectance (SR) from 81 bands in the 400 to 800-nm wavelength range, with each band 5 nm wide. When using the HSC, it is possible to identify slight changes in color tone with a high degree of accuracy.9 To create a highly accurate gastric cancer detection system, we used the HSC to capture images of gastric tumors immediately after endoscopic resection and investigated the resulting SR obtained. Our purpose was to examine spectra data of gastric tumors and to clinically apply HSI to detect gastric tumors with high accuracy. 2.Materials and Methods2.1.Patients and MaterialsThe subject specimens of this study were 104 gastric tumors resected from 96 patients who had undergone endoscopic submucosal dissection (ESD) at Yamaguchi University Hospital between April 2010 and August 2012 (Table 1). Histopathological diagnosis of the specimens following ESD included differentiated cancer in 87, undifferentiated cancer in 3, and adenoma in 14. Table 1Clinicopathological characteristics of the 104 lesions treated by endoscopic submucosal dissection.
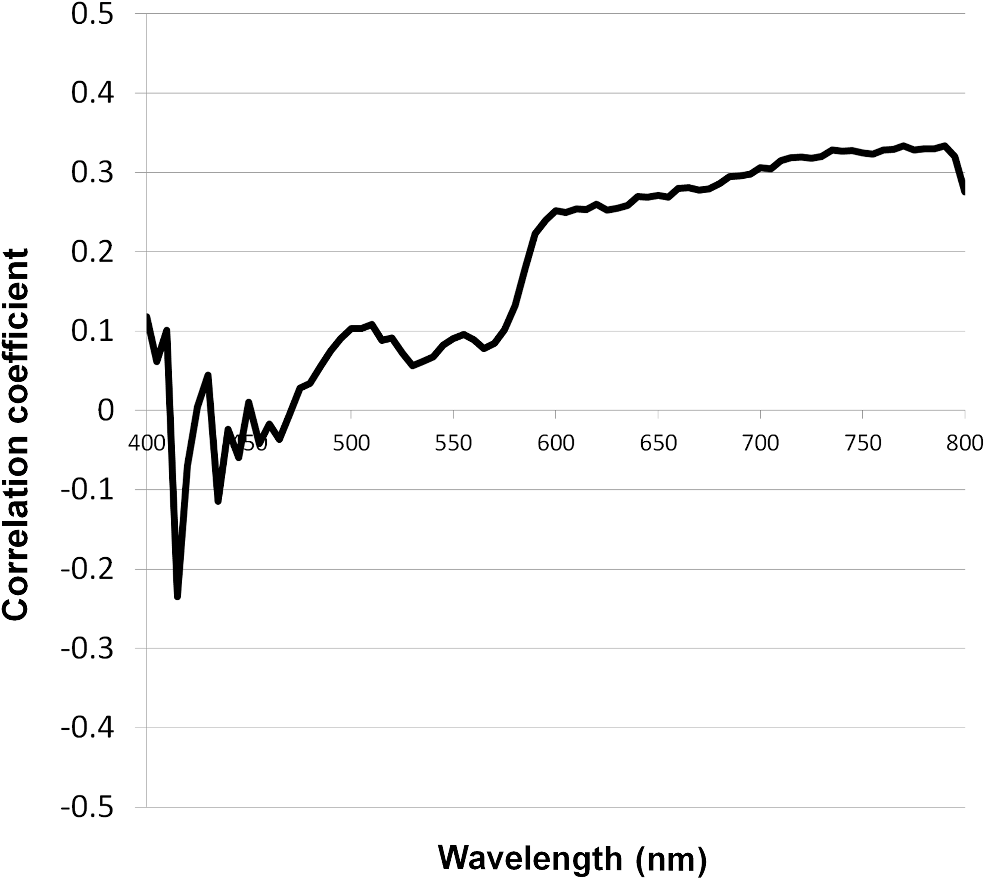
2.2.HSC Imaging ProcedureAfter mucus was removed from the resected specimen with buffered saline, it was fixed to a blackboard using pins and HSC images were taken immediately. The specimen was placed in a diffuser box and illuminated from three directions with 250-W halogen lamps to allow light to hit the specimen in a uniform manner. Resolution of the HSC image was , and we could obtain the SR from each pixel. The obtained SR is normalized to one on the basis of white reference data. 2.3.Histopathological DiagnosisAfter images were captured by the HSC, each resected specimen was then fixed in 10% formalin, thin sections were created at 2-mm intervals, and these were stained with hematoxylin–eosin. The tissue structure of the tumor and the boundary between the tumor and surrounding normal mucosa were determined histopathologically. 2.4.Method of Analysis of HSC ImagesThe procedure shown in Fig. 1 was used to determine the optimal wavelength and the reflectance cut-off value at that wavelength. The 104 tumors were divided into 54 training cases and 50 test cases. The training group was used to select the wavelength most suitable for discriminating tumors from normal mucosa. In each of the 54 training cases, we measured the SR in both areas of the tumor and in normal mucosa that were determined histopathologically. Because the tissue type, shape, and color of gastric tumors vary, SR is not always uniform even in tumor sites. Thus, 10 points were obtained from the tumor regions and the normal sites, respectively, and measured. The 10 points were chosen so that they were uniformly dispersed throughout the tumor as much as possible. Fig. 1Flowchart of the analysis of spectral reflectance. SR, spectral reflectance; cSR, corrected spectral reflectance. 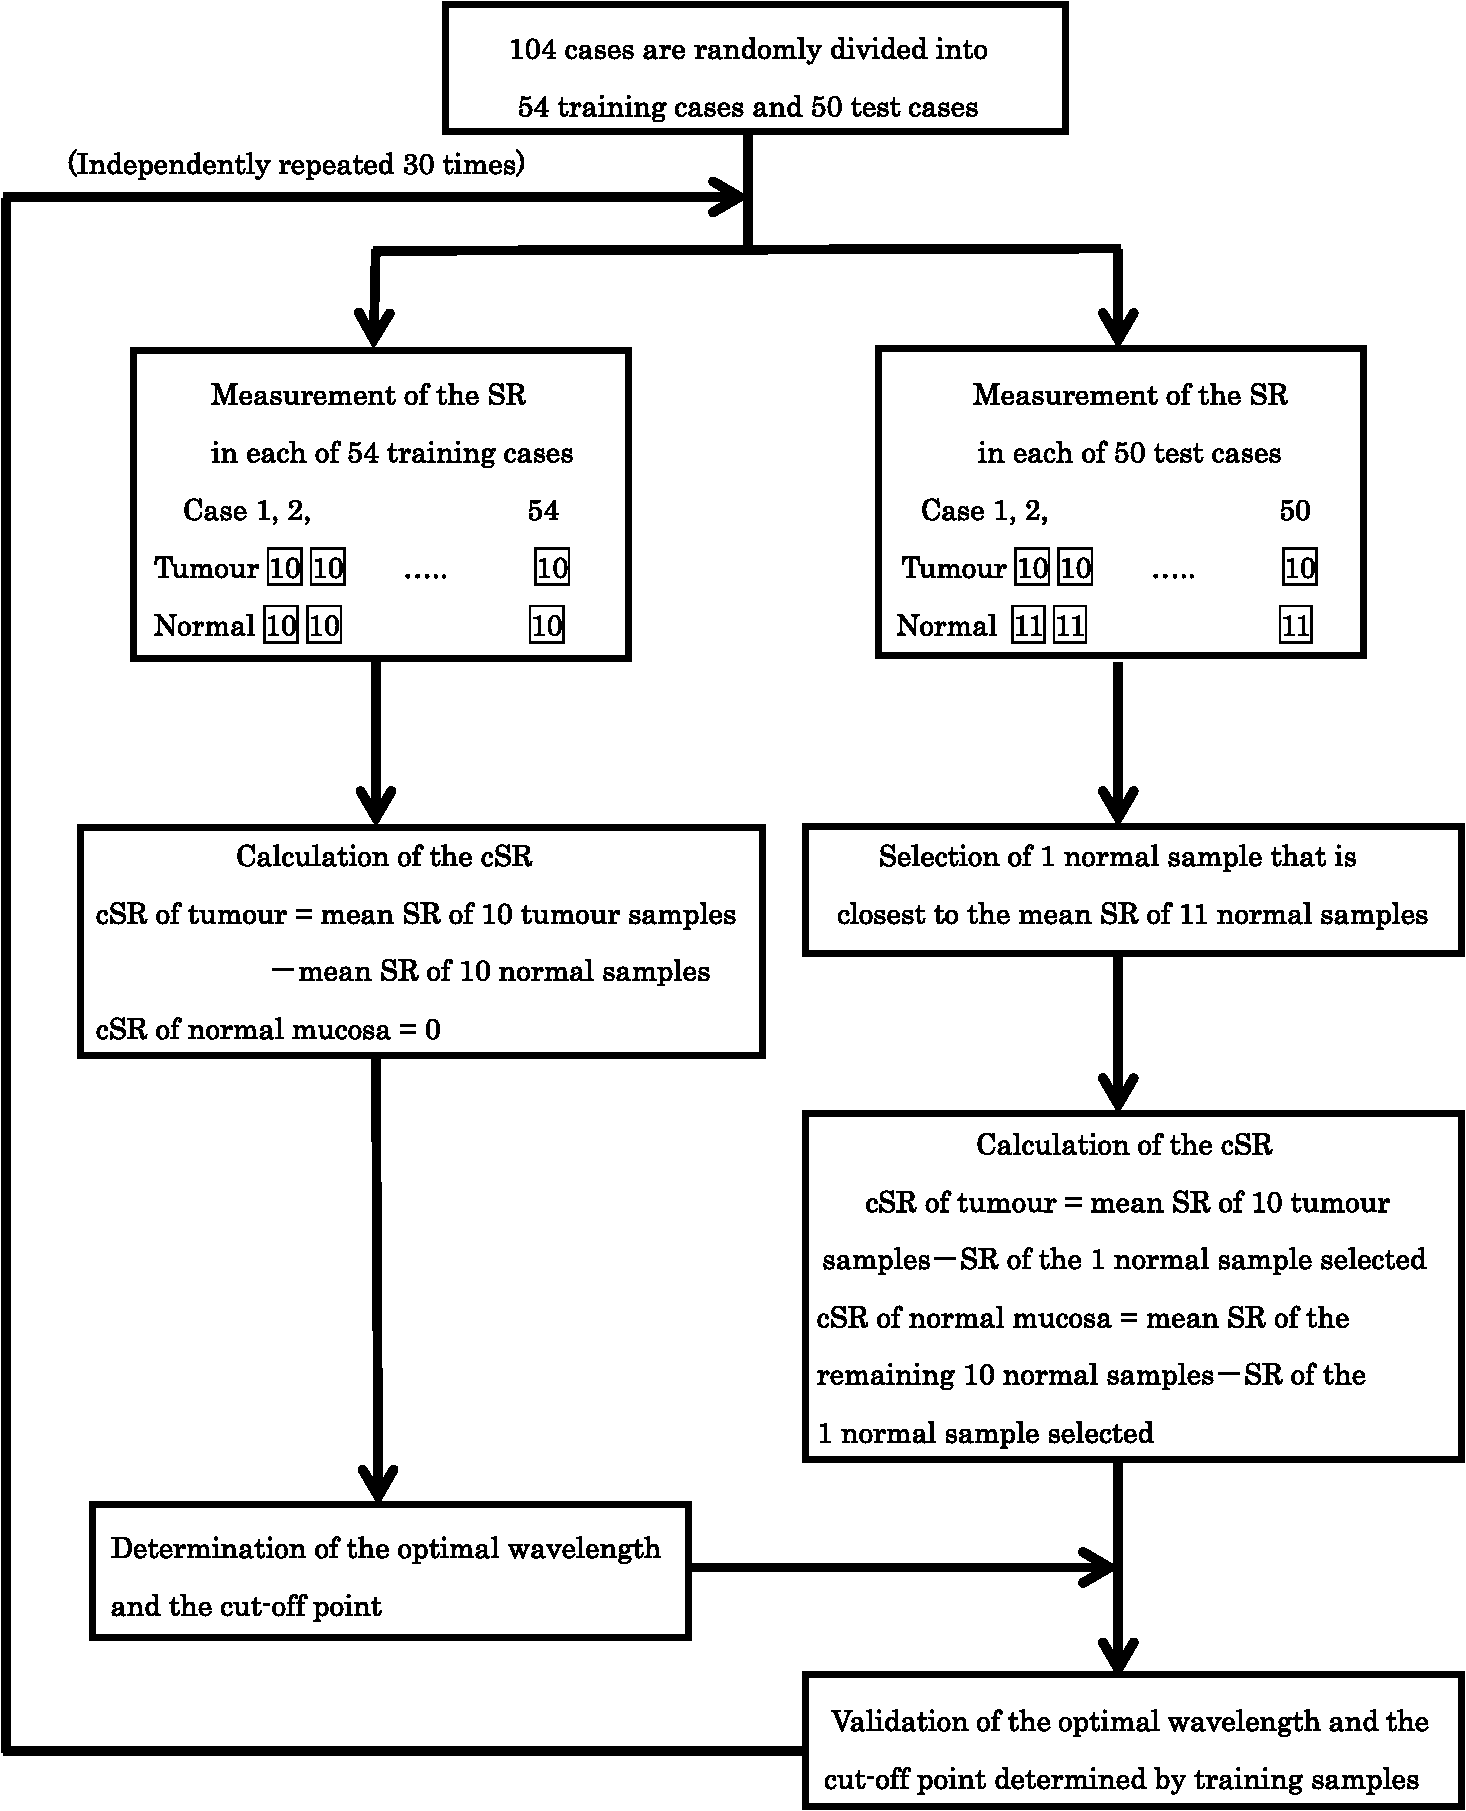 The absolute values of SR vary from case to case, thus, we cannot differentiate between normal and tumor sites by applying the same cut-off value of SR to all patients. Therefore, the corrected SR of the tumor was obtained by subtracting the average SR of the normal mucosa from the average SR of the tumor. Accordingly, the corrected SR in the normal mucosa was zero. The Mahalanobis distance of corrected SR between the tumorous and normal mucosa was used to determine the optimal wavelength. The wavelength at which the Mahalanobis distance was greatest between the two regions was designated as the optimal wavelength. The 54 training cases were further divided into a sub-training group of 27 cases and a sub-test group of 27 cases, and the cut-off value was determined. We selected the cut-off value at which the sensitivity was greatest provided that the specificity was . Because tumors are localized in the stomach, most of the stomach wall is normal. Therefore, specificity was set at a higher level to reduce the false positives, and under these conditions, the cut-off value was set so that the sensitivity was at the highest level. It is possible to assess each pixel unit during the diagnosis of gastric cancer using the HSC. If 70% of the tumor pixels were enhanced and depicted, we considered that it was possible to diagnose the presence of a tumor (Fig. 2). The method of choosing a parameter to determine cut-off values is as follows: the cut-off value was defined as the average corrected SR at the optimal wavelength in the 27 sub-training . To precisely investigate the vicinity of the optimal solution at which sensitivity was at the highest level with a specificity of 99% or more in our preliminary experiment, , , , , , , and were defined as candidate parameters. We calculated the sensitivity and specificity for each of the seven candidate parameters, which are used to determine cut-off values in the sub-test group of 27 cases. Fig. 2HSC image at sensitivities of 100% and 70%. If 70% of the tumor pixels were enhanced and depicted, we considered that it was possible to diagnose the presence of a tumor. 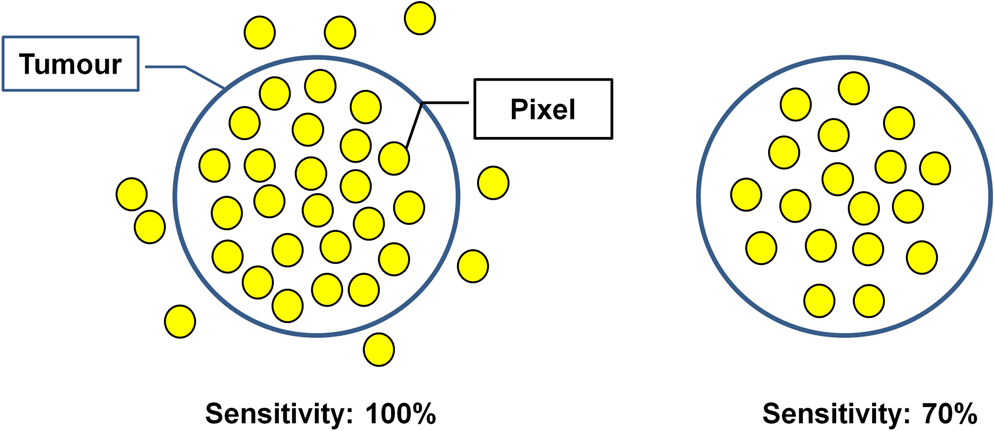 Next, to investigate the generalization ability of our diagnostic support system, we independently evaluated the diagnostic capability of the system in the 50 test cases from those of the training cases. It was impossible to use the SR of the normal mucosa in the test cases for correction because the diagnostic support system does not know whether the normal mucosa is a tumor region or normal region. We established the following hypothesis to address this problem. When there is actual endoscopic examination of the stomach, most of the regions in the image are considered to represent normal mucosa outside the tumor. Accordingly, during the practical use of the diagnostic support system, most of the regions that are considered to be normal are captured first, and the SR of a pixel randomly selected from the captured region is used for correction. In this study, the point that most closely resembled the average SR of 11 points in the normal mucosa of the test cases was selected and its SR was used for correction. The corrected SR of the normal mucosa was the value obtained when the SR of the point selected for correction was subtracted from the average SR of the remaining 10 points. Similarly, the corrected SR of the tumor was the value obtained when the SR of the point selected for correction was subtracted from the average SR of the remaining 10 points in the tumor. 2.5.Image EnhancementOn the basis of the algorithm we created, we performed investigations after processing the obtained HSC images. With respect to image enhancement techniques, HSD Analysizer (EBA Japan Co.), an HSC analysis software program, has a function to display only highlighted pixels with an SR exceeding a threshold value set at a specific wavelength. Image enhancement was made based on the reflectance spectra data and the cut-off value of the optimal wavelength. 2.6.Histopathological InvestigationsHistopathological investigations were conducted to elucidate the mechanism of the discrepancies in the SR data between the tumors and normal mucosa. Immunological staining in all 104 tumors was performed using the vascular endothelial cell marker CD34, and the microvessel density (MVD) between the tumors and the normal mucosa was compared. We selected areas of high vascular density from three microscopic fields of the tumor and three of the normal mucosa at magnification and calculated the average number of microvessels. We also analyzed the correlation coefficient of the difference in MVD between tumors and normal mucosa and corrected the SR for each wavelength. 3.ResultsRepresentative data of the average SR obtained from 10 points each in the tumor region and in the surrounding normal mucosa are shown in Fig. 3. The SR in the tumors tended to be high in wavelength bands above 600 nm. Fig. 3Image of a resected specimen obtained with the HSC and a graph showing spectral reflectances of the tumor and normal mucosa in the wavelength range of 400 to 800 nm.  After the processing was independently conducted 30 times, 770 nm was selected most frequently (11 times) and was thus designated as the optimal wavelength. The cut-off value obtained by multiplying the average value of the corrected SR of the tumor by the parameter was selected most frequently (15 times) and was thus defined as the optimal cut-off value. The 50 test cases were diagnosed using a cut-off value that was of the average value of the corrected SR at 770 nm in the tumors of the training cases. When diagnostic capability was evaluated 30 times in the 50 test cases using this diagnostic support system, the average rates of sensitivity, specificity, and accuracy were 71%, 98%, and 85%, respectively. Image enhancement was performed based on the SR data at the optimal wavelength of 770 nm using the cut-off value, which was of the average value of the corrected SR at 770 nm in the tumor and the HSD Analysizer. The case of a 15-mm gastric adenoma on the anterior antral wall is shown in Fig. 4(a). The tumor was the same color as the surrounding mucosa, and the boundary between the tumor and the normal mucosa was indistinct. Images of the resected specimen were captured using the HSC after ESD [Fig. 4(b)]. Dual-tone image processing was conducted using HSD Analysizer [Fig. 4(c)], in which each pixel was represented in black or white if the corresponding corrected SR at 770 nm was lower or higher, respectively, than the cut-off value. This image revealed a clear boundary between the tumor and the normal mucosa, and it was possible to highlight the tumor. The tumor-emphasized areas and the histopathologically determined tumors areas were almost identical. In addition, as shown in Fig. 4(d), it was possible to enhance the images by processing the SR at 770 nm using a 20-tone color gradation. Fig. 4Image processing by HSC. (a) Esophagogastroduodenoscopic image of a gastric adenoma in the anterior wall of the antrum. Tumor is indicated by yellow arrows. (b) HSC image before image processing. (c) Image processed on the basis of the spectral reflectance (SR) at the 770-nm wavelength with a two-color gradation. Each pixel of the image is displayed in black if the SR of the pixel falls below the cut-off point and in white if it exceeds the cut-off point. (d) Image processed on the basis of the SR at the 770-nm wavelength with a 20-color gradation by HSD Analysizer. Each pixel of the image is displayed in blue if the SR of the pixel is low and in red if it is high.  Immunological staining was performed using CD34, and the MVD between the tumors and the normal mucosa was compared. The mean MVD in the tumor and the normal mucosa was and , respectively, showing a significantly higher MVD value in the tumor than in the normal mucosa (t-test, ). The difference in MVD between tumors and normal mucosa correlated positively with the corrected SR, with a correlation coefficient of 0.3338 at 770 nm (Fig. 5). 4.DiscussionFrom the analysis of the training samples, the 770-nm wavelength and cut-off value of the corrected SR were selected as the optimal wavelength and cut-off value, respectively. The average rates of sensitivity, specificity, and accuracy of the algorithm’s diagnostic capability in the test samples were 71%, 98%, and 85%, respectively. These results indicated that the establishment of a highly accurate diagnostic support system for gastric cancer is possible if HSC examination is performed in accordance with the algorithm developed in this study. The results of immunological staining suggested a relation between the 770-nm wavelength and MVD. The absorption band of hemoglobin is between 700 and 900 nm,10 thus we considered that the vascular density in the tumor or an increased hemoglobin concentration might influence the reflectance at the wavelength of 770 nm. Akbari et al. used HSI to conduct infrared light analysis at 1000 to 2500 nm.11 They used gastric tumors obtained after gastrectomy to show that infrared light in the wavelength ranges of 1226 to 1251 nm and 1288 to 1370 nm was useful for detecting gastric tumor and for determining tumor extent. In addition, Wong et al. successfully detected esophageal cancers by using near-infrared fluorescent imaging to visualize the protein periostin, which is expressed in esophageal cancer, showing that near-infrared light is useful for tumor diagnosis.12 Currently, near-infrared light is not available from the light source used during EGD, which operates at wavelengths of . The use of near-infrared light is expected to facilitate the detection of tumors that are currently difficult to detect. A limitation of this study was the use of resected specimens. Blood flow and oxygen saturation in the tumor may have differed from those observed in vivo. Future research will involve conducting in vivo examinations using HSC to determine whether the results are similar to those obtained with the algorithm developed in this study. Furthermore, the setting of the parameter to determine the cut-off value is peculiar to the hyperspectral camera and the experimental procedure used in this study. Actually, the parameter differs depending on the data, and was not the optimal value for all 30 processing times. We proposed one way of determining the cut-off value. When using a different sensor or experimental procedure, the cut-off value must be optimized according to that sensor and procedure. This is a limitation, but we intend to make use of this result in future studies. 5.ConclusionsThis study demonstrated that HSI can be used to measure the SR in gastric tumors and to differentiate between tumors and normal mucosa. When considering the HSC for the use in endoscopic screening, computer-aided diagnosis should be developed first that alerts the physician to areas that deviate to a certain extent from what is routinely diagnosed as a tumor, followed by the development of a highly accurate diagnostic support system for gastric cancer as the next step. AcknowledgmentsThis study was partially supported by the Adaptable and Seamless Technology Transfer Program (ASTEP) of the Japan Science and Technology Agency. ReferencesK. D. CrewA. I. Neugut,
“Epidemiology of gastric cancer,”
World J. Gastroenterol., 12
(3), 354
–362
(2006). WJGAF2 1007-9327 Google Scholar
D. M. Parkinet al.,
“Global cancer statistics, 2002,”
CA Cancer. J. Clin., 55
(2), 74
–108
(2005). http://dx.doi.org/10.3322/canjclin.55.2.74 CAMCAM 0007-9235 Google Scholar
C. Hamashimaet al.,
“The Japanese guidelines for gastric cancer screening,”
Jpn. J. Clin. Oncol., 38
(4), 259
–267
(2008). http://dx.doi.org/10.1093/jjco/hyn017 JJCOAC 0368-2811 Google Scholar
K. Aidaet al.,
“Clinicopathological features of gastric cancer detected by endoscopy as part of annual health checkup,”
J. Gastroenterol. Hepatol., 23
(4), 632
–637
(2008). http://dx.doi.org/10.1111/j.1440-1746.2008.05346.x JGHEEO 1440-1746 Google Scholar
K. Gonoet al.,
“Appearance of enhanced tissue features in narrow-band endoscopic imaging,”
J. Biomed. Opt., 9
(3), 568
–577
(2004). http://dx.doi.org/10.1117/1.1695563 JBOPFO 1083-3668 Google Scholar
J. Pohlet al.,
“Computed virtual chromoendoscopy: a new tool for enhancing tissue surface structures,”
Endoscopy, 39
(1), 80
–83
(2007). http://dx.doi.org/10.1055/s-2006-945045 ENDCAM 0013-726X Google Scholar
S. Kiyotokiet al.,
“New method for detection of gastric cancer by hyperspectral imaging: a pilot study,”
J. Biomed. Opt., 18
(2), 026010
(2013). http://dx.doi.org/10.1117/1.JBO.18.2.026010 JBOPFO 1083-3668 Google Scholar
T. Vo-Dinhet al.,
“A hyperspectral imaging system for in vivo optical diagnostics. Hyperspectral imaging basic principles, instrumental systems, and applications of biomedical interest,”
IEEE Eng. Med. Biol. Mag., 23
(5), 40
–49
(2004). http://dx.doi.org/10.1109/MEMB.2004.1360407 IEMBDE 0739-5175 Google Scholar
S. Satoriet al.,
“Hyperspectral sensor HSC3000 for Nano-satellite ‘TAIKI’,”
Proc. SPIE, 7149 71490M
(2008). http://dx.doi.org/10.1117/12.804898 PSISDG 0277-786X Google Scholar
W. G. ZijlstraA. BuursmaW. P. Meeuwsen-van der Roest,
“Absorption spectra of human fetal and adult oxyhemoglobin, de-oxyhemoglobin, carboxyhemoglobin, and methemoglobin,”
Clin. Chem., 37
(9), 1633
–1638
(1991). CLCHAU 0009-9147 Google Scholar
H. Akbariet al.,
“Cancer detection using infrared hyperspectral imaging,”
Cancer. Sci., 102
(4), 852
–857
(2011). http://dx.doi.org/10.1111/cas.2011.102.issue-4 CSACCM 1347-9032 Google Scholar
G. S. Wonget al.,
“Optical imaging of periostin enables early endoscopic detection and characterization of esophageal cancer in mice,”
Gastroenterology, 144
(2), 294
–297
(2013). http://dx.doi.org/10.1053/j.gastro.2012.10.030 GASTAB 0016-5085 Google Scholar
BiographyAtsushi Goto is a postgraduate student in the Department of Gastroenterology and Hepatology at Yamaguchi University Hospital. His research interests include gastrointestinal endoscopy. Jun Nishikawa is an associate professor in the Department of Gastroenterology and Hepatology at Yamaguchi University Hospital. He is a certificated member of the Japan Gastroenterological Endoscopy Society. His research interests include gastrointestinal endoscopy and gastric carcinogenesis. Shu Kiyotoki is a postgraduate student in the Department of Gastroenterology and Hepatology at Yamaguchi University Hospital. His research interests include gastrointestinal endoscopy. Munetaka Nakamura is a graduate student in the Department of Gastroenterology and Hepatology at Yamaguchi University Hospital. His research interests include gastrointestinal endoscopy and gastric carcinogenesis. Junichi Nishimura is a graduate student in the Department of Gastroenterology and Hepatology at Yamaguchi University Hospital. His research interests include gastrointestinal endoscopy. Takeshi Okamoto is an associate professor in the Department of Gastroenterology and Hepatology at Yamaguchi University Hospital. He is a certificated member of the Japan Gastroenterological Endoscopy Society. His research interests include gastrointestinal endoscopy. Hiroyuki Ogihara is a graduate student in the Department of Biomolecular Engineering at Yamaguchi University Graduate School of Medicine. His research interests include education and pattern recognition. Yusuke Fujita is an associate professor in the Department of Biomolecular Engineering at Yamaguchi University Graduate School of Medicine. His research interests include education and pattern recognition. |