

|
|
1.IntroductionMonte Carlo (MC) technique is increasingly popular for the modeling of light transport in strongly scattering biological tissues. The approach is very versatile, amenable to speeding up by massive parallelization, and is known to produce sufficiently accurate results. Consequently, it was applied for various tasks in biomedical optics, e.g., to simulate energy deposition in skin during various light treatments1–7 and tissue fluorescence,8–10 to model laser-Doppler measurements of perfusion,11 to determine scientifically or clinically relevant tissue properties from different measurements,12 and so on. Treatment of such effects in structurally heterogeneous biological organs requires the application of the MC technique in three dimensions (3-D). In its simplest and thus most common implementation, the volume of interest (VOI) is divided into optically homogeneous cuboid elements (voxels) by a rectangular grid. Consequently, the round or oblique boundaries between neighboring tissues are approximated by serrated surfaces. Until recently, researchers in the field of biomedical optics were not too concerned with the potential adverse effects of such an approximation, perhaps sharing an implicit notion that any related artifacts were negligible and/or could be eliminated by applying sufficiently fine spatial discretization. In 2008, however, Binzoni et al.13 showed that the numerically predicted diffuse reflectance of a semi-infinite homogeneous tissue varies considerably with the orientation of the Cartesian discretization grid. In the present study, we investigate whether the described approach to 3-D MC modeling can also lead to significant artifacts in MC simulations of energy deposition upon irradiation of heterogeneous tissue structures due to inaccurate treatment of reflection and refraction at such serrated surfaces. To that end, we compare the predictions of the customary MC model (as outlined above) with an augmented implementation, where reflection and refraction of light at curved boundaries between different tissues are treated rigorously. For a few model geometries, mimicking cutaneous blood vessels irradiated with laser beams of finite diameters, we compare the spatial distributions of the absorbed energy and energy uptake by the target vessel as predicted using the two 3-D MC approaches. The results demonstrate that the customary approach suffers from considerable inconsistencies upon variation of the spatial discretization step and repositioning of the computational grid and artifacts which do not disappear with ever finer discretization. 2.Methodology2.1.Optical Transport ModelOur simulation of light transport in skin utilizes the well-established weighted-photon MC technique.14 In this approach, a large number of energy packets (“photons”) propagate through the tissue and deposit fractions of their energy into specific volume elements, according to local absorption properties. Probabilistic relations are used to compute each photon trajectory, based on the macroscopic laws of light scattering, reflection, and refraction. These relations involve optical properties such as absorption coefficient (), scattering coefficient (), anisotropy coefficient (), and index of refraction () of the involved tissues. With an increasing number of simulated photons and ever finer spatial discretization of the treated volume, the resulting energy deposition maps converge toward a realistic spatial distribution of light absorption in the modeled organ. Our implementation of the MC code is an extrapolation of the popular multilayer MC model (MCML)14 to three spatial dimensions. This allows treatment of skin inclusions of arbitrary shape, position, and orientation, as well as irradiation with spatially nonuniform light beams.1 We have implemented two versions of the 3-D MC code, differing only in the treatment of curved boundaries between neighboring tissues. In the customary version of the code, tissue geometry is represented within the confines of the Cartesian discretization grid. Each voxel is assigned to a single tissue and thus obtains a uniform set of optical parameters (, , , and ). Consequently, boundaries of anatomical structures are approximated by flat or serrated surfaces pinned to the corners of the discretization grid. In the following, we refer to this approach as “model D.” In order to avoid the potential deficiencies of the above approach, we have implemented an augmented MC model which utilizes analytically defined tissue borders (“model G”), e.g., a blood vessel is represented by a cylinder with a perfectly smooth surface (Fig. 1). The cuboid voxel structure is retained to store the 3-D energy deposition data for subsequent rendering and analysis. However, individual voxels do not necessarily contain only one tissue type. Voxels which include a boundary between neighboring tissues thus accumulate the laser energy absorbed on both sides of the boundary. Fig. 1Our main model geometry includes a superficial epidermal layer and semi-infinite dermis with a horizontal blood vessel (red). The green circle marks the perimeter of the incident laser beam, and black cube indicates the computational volume of interest (VOI). 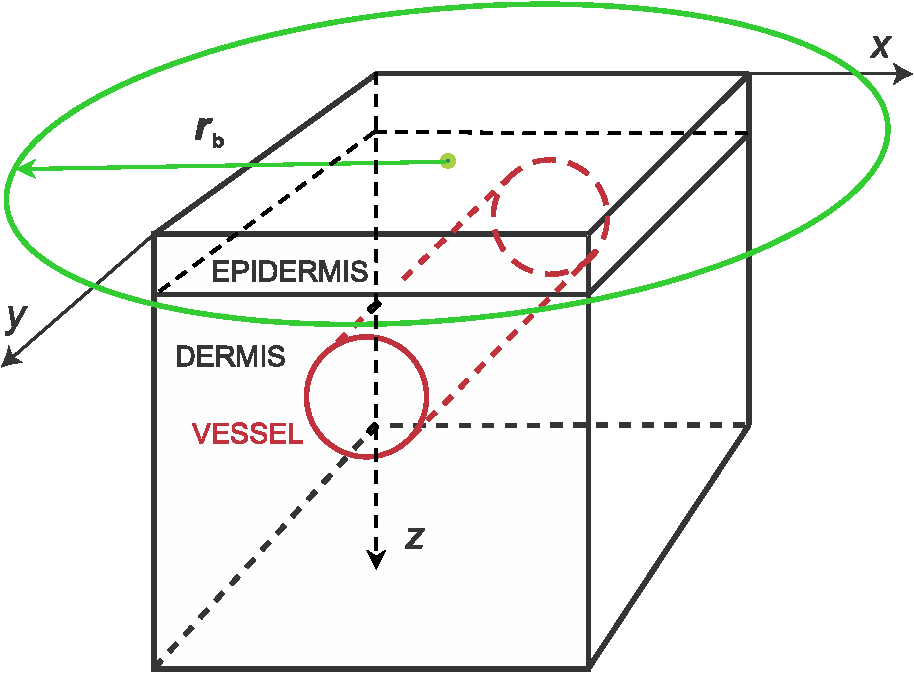 In terms of basic light transport, our model G proceeds along the same MC simulation steps as model D (i.e., photon generation, relocation, absorption, and scattering). The only difference between the two versions is in the treatment of light reflection and refraction at curved boundaries between different tissues, as illustrated in Fig. 2. Fig. 2Reflection and refraction of light at the vessel boundary in MC model with (a) tissue boundaries pinned to the Cartesian grid and (b) analytically defined tissue boundaries.  In short, when a propagating photon packet crosses a tissue boundary, the normal unity vector at the intersection point, , is calculated. The cosine of the incidence angle () is then computed as the dot product between and the current photon direction, . If is smaller than the critical angle for total internal reflection, , and a random-number generator is applied to determine whether the photon will be reflected or refracted based on the reflectivity value calculated using the Fresnel’s equation. Detailed expressions and their derivations are presented in the Appendix. In both implementations (models D and G), special attention is devoted to treatment of the VOI side boundaries. As pointed out before, neither an “escape” nor “mirror” (insulating) boundary condition is appropriate for high-resolution treatment of small volumes in human skin irradiated with significantly larger yet spatially confined laser beams.6 One prominent example is the cutaneous vascular lesions called port-wine-stains (PWS). These lesions contain blood vessels with diameters of 20 to and are commonly treated with lasers beams of several millimeters in diameter. Under such conditions, the most common solution—i.e., to control edge-related artifacts by moving the “escape” or “mirror” VOI boundaries sufficiently far from all relevant structures—becomes prohibitively memory demanding and time consuming.6 Our approach to the above problem, called “extended layers,” is to also propagate the photons outside of the VOI in laterally infinite tissue layers, until they lose most of their energy or escape into the air. Optical properties of these layers are inherited from the border VOI elements at the respective depths, and the majority rules when they do not represent the same tissue type. Most importantly, the energy deposition outside of the VOI is not recorded. This keeps the memory requirements and/or the number of hard drive read/write operations at a manageable level and thus reduces the computation time by several orders of magnitude.6 The same principle is also applied at the bottom boundary of the VOI. Specifically, the entire semispace below the VOI bottom boundary inherits the optical properties of the dermis. Both versions of the MC code were implemented in Visual C++ 2010 (Microsoft, Redmond, Washington) with utilization of multithreading to help speed up the computations. 2.2.Model Geometry and Optical ParametersOur main test geometry consists of two laterally infinite layers, representing the superficial epidermal layer (thickness ) and semi-infinite dermis underneath. Energy deposition is recorded within the VOI with dimensions . A single horizontal blood vessel has its axis located at depth and laterally at (see Fig. 1). Vessel diameters of 30 and will be considered, representing small and large PWS vessels, respectively. The photon-launching pattern imitates a perpendicularly incident laser beam with a top-hat intensity profile, centered above the blood vessel. Irradiation with a narrow (diameter ) and a wider laser beam () will be discussed. All tissue optical parameters correspond to the wavelength of 532 nm (Table 1).6,7 Melanin is assumed to be homogenously distributed within the epidermis. The blood absorption coefficient corresponds to a hematocrit of 40% and an oxygen saturation level of 70%. Table 1Absorption coefficient (μa), scattering coefficient (μs), anisotropy factor (g), and refractive index (n) values used in our Monte Carlo model of optical transport (λ=532 nm). The μa value for blood corresponds to hematocrit Ht=40% and oxygenation level of 70%, and the scattering properties were determined for Ht=33%.
3.Results3.1.Laser Energy Deposition in a 30 VesselFigure 3 presents the spatial distribution of the energy deposited in a vessel geometry upon irradiation with a 1.2-mm diameter laser beam, as obtained using the MC model D. The indicated energy deposition values, , correspond to a laser radiant exposure of . The number of incident “photons” was and the spatial discretization step in the cross-sectional plane () equals . Fig. 3Cross-sectional maps of energy deposition in our model geometry with a blood vessel irradiated with a 1.2-mm diameter hat-top laser beam: (a) in the central plane perpendicular to the vessel axis (); and (b) in the vertical plane containing the vessel axis ().  As expected, the energy deposition values are largest within the blood vessel, significantly lower in the epidermis, and minimal in the dermis. Energy deposition within the vessel lumen is nonuniform, with the largest values indicated along its top boundary [Fig. 3(a)]. An energy deposition map in the vertical plane containing the vessel axis [Fig. 3(b)] demonstrates the absence of considerable edge artifacts. In Fig. 4, we compare the spatial distributions of laser energy deposition within the blood vessel lumen and nearby dermis as obtained using our two simulation models. The differences are evident, especially along the vessel border. In the results of model D [Fig. 4(a)], the energy deposition region is sharply demarcated by the serrated vessel boundary. In Fig. 4(b), in contrast, the transition between the vessel and nearby dermis is blurred due to specific treatment of the tissue boundaries in model G. Here, the border voxels accumulate energy deposited in both blood and dermis on either side of the vessel boundary. Fig. 4Energy distribution within the vessel of diameter and in the nearby dermis obtained by the MC models D (a) and G (b).  For quantitative analysis of the related effects, we assess the relative differences between the energy depositions as predicted by models D and G for each VOI voxel (marked with matrix indices , and ): The superscripts D and G refer to the respective MC models.Because the test geometry is uniform along the -axis, we control the inevitable noise in the MC results by using significantly coarser discretization in this direction [; see Fig. 3(b)]. In addition, we can average the results over a certain number of () slices near the VOI center, where the light fluence is practically constant along the direction. This leads to the noise-reduced version of Eq. (1): where marks the number of slices over which the averaging is performed.Based on the analysis of the data in Fig. 3(b), in the following we apply averaging over the central 16 slices. The remaining part of the VOI (i.e., the last 0.14 mm on either side) features a small decrease in energy deposition, resulting from the relatively narrow laser beam used in this example (see Fig. 1). The obtained map of values is presented in Fig. 5. In accordance with the above discussion of Fig. 4, a systematic and thus rather symmetrical pattern is evident along the vessel border. Individual values of are either positive (yellow to red colors) or negative (blue), depending on whether the respective voxel is assigned to the inside or outside of the vessel in model D. In some of these voxels, the amplitudes approach 100%. Fig. 5Relative difference of the energy deposition values in MC models D and G, [Eq. (2)] for the diameter vessel. Red circle indicates the vessel boundary.  However, we are interested in systematic differences between the two implementation models beyond such inevitable effects in the border voxels. We can expect the latter to largely average out and lose relative importance when applying sufficiently fine spatial discretization. To that end, let us consider the vertical profile of through the vessel center, as presented in Fig. 6 (solid line). The value is positive throughout the vessel lumen, increasing from at its top to 6% at the bottom. In contrast, in the epidermis is mostly negative and amounts to . The second effect is in good agreement with the first. Namely, as more energy is absorbed in the vessel in model D as compared with model G, fewer photons are scattered back toward the epidermis, thus reducing the fluence and energy deposition in the latter. Fig. 6Vertical profile of [Eq. (2)] through the center of the diameter vessel (; dark blue line). Standard deviation and standard error of the mean are indicated with thin lines (red) and shaded band (light blue), respectively. Vertical lines indicate the boundaries of the epidermis and blood vessel.  In order to test the significance of these effects, we compute the standard deviation of values at each location (): Since numerical noise in different voxels is uncorrelated, we can also assess the standard error of to indicate the region of trust around the values in Fig. 6 (light blue band). The result confirms that the above-mentioned differences in the vessel and epidermis are significant.For further analysis, we consider the energy uptake by the blood vessel per unit of length, . For a selected cross-sectional plane (i.e., slice ), this quantity can be computed by summing up the energy deposition contributions, , across the vessel lumen: where and mark the discretization steps in the respective directions. Analogous to Eq. (2), we again reduce the numerical noise by averaging the values over 16 central slices.In Fig. 7, we compare such linear energy deposition values, , as obtained using our two MC models with the lateral discretization step () varied between 1 and . The values obtained with model D (open circles) evidently feature the significant and rather erratic variations with the discretization step. In contrast, no such unphysical behavior is observed in the results of our augmented model G (solid squares). Fig. 7Linear energy deposition, [Eq. (5)] as a function of the spatial discretization step () for model D (open circles) and model G (solid squares).  Our analysis shows that model D mostly overestimates absorption of laser light by the blood vessel. However, the opposite effect can be seen at . The relative difference of linear energy depositions between the two models, thus assumes a wide range of values from to .At finer spatial discretization, assumes exclusively positive and somewhat smaller values, below 8% at . However, the values do not show any tendency to converge toward zero, but rather stabilize at 4% to 5%. This points to a fundamental difference in interaction of incident light with the model vessel, as predicted by our two MC models. 3.1.1.Shifting of discretization gridIn model D, the approximated shape of the model vessel depends not only on the discretization step, but also on location of the origin of the computational grid. In Fig. 8, we illustrate the latter effect for the diameter vessel (at ). In Fig. 8(a), the vessel axis coincides with the center of the border between two neighboring voxels. This was the case in the example discussed thus far (Figs. 3–7) and is referred to as the “original grid” in the following. In Fig. 8(b), the discretization grid is shifted in the direction by , such that the vessel axis passes through the voxel center (“shifted grid”). As is evident from Fig. 8, this results in a considerable change of the vessel’s cross section in model D. Fig. 8Transversal cross section of the energy deposition in the diameter vessel centered (a) at the boundary between two voxels, and (b) at the voxel center. Result of model D. 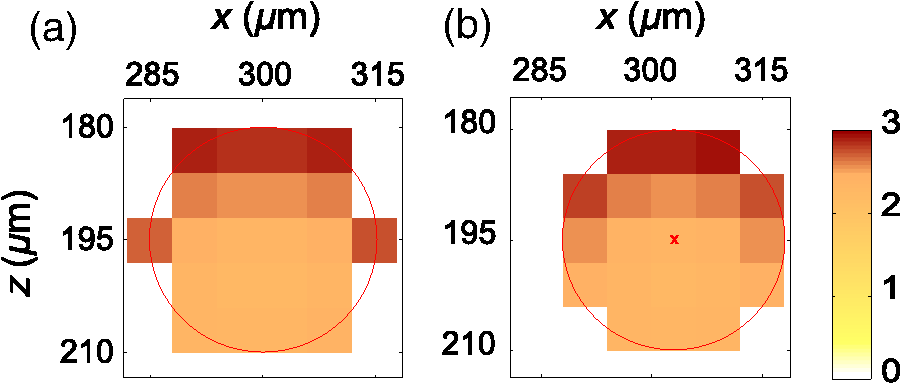 When using the augmented model G, we do not see any influence of the grid positioning (or ) on the linear density of energy absorbed in the vessel, [Eq. (5)]. Therefore, we compare in Fig. 9(a) only the relative deviations [Eq. (6)] as assessed for both grid positions and varying discretization steps. Fig. 9(a) Relative difference of the linear energy depositions, , and (b) relative error of the cross-sectional area in model D () as a function of discretization step () for the original (open circles) and shifted computational grids (solid, red).  For most small discretization steps (i.e., ), considerably smaller deviations are indicated when using the shifted grid (solid circles; red) as compared with the original one (open circles). Similarly, assumes significantly lower values (below 2%) than with the original grid at the finest discretizations under test. This likely reflects the fact that with the shifted grid, the vessel cross section in model D always features a fourfold rotational symmetry and thus more closely resembles the actual shape of the vessel lumen (see Fig. 8). At the larger discretization steps (), the shifted grid yields somewhat larger mismatches than the original grid. We consider this effect to be incidental and attribute it to the increasingly deteriorating representation of the vessel cross section at larger , which dominates over the influence of grid positioning. For the present analysis, it is also important to note that the vessel’s cross-sectional area in model D () can differ from its actual value () and can also vary with both and grid positioning. In Fig. 9(b), we plot the relative mismatch, , for the involved discretization steps and both grid positions. A close similarity between the behavior of and that of [see Fig. 9(a)] is evident for the original grid (open circles). For the shifted grid (solid circles), the similarity is less apparent and limited to smaller discretization steps (). 3.2.Energy Deposition in a 150-μm VesselOur next example involves a larger blood vessel (diameter ), irradiated with the same laser beam as above (). A cross-sectional map of the relative differences between the energy depositions obtained using the two MC models, [Eq. (2)], is presented in Fig. 10. Apart from the trivial discrepancies evident in the border voxels, energy deposition in most of the vessel lumen is indicated to be somewhat larger in model D as compared with model G. Similar to the vessel (Figs. 5 and 6), the largest deviations are observed in the bottom part of the vessel lumen. The values of here approach 10%, which is considerably more than in the previous example. This is somewhat counter-intuitive because, at the same discretization step of , the boundary of the vessel appears much better approximated than that of the five times smaller vessel [see Fig. 4(a)]. Fig. 10Transversal cross section of the skin model involving the vessel, indicating the average relative difference of energy deposition between the MC models D and G, . 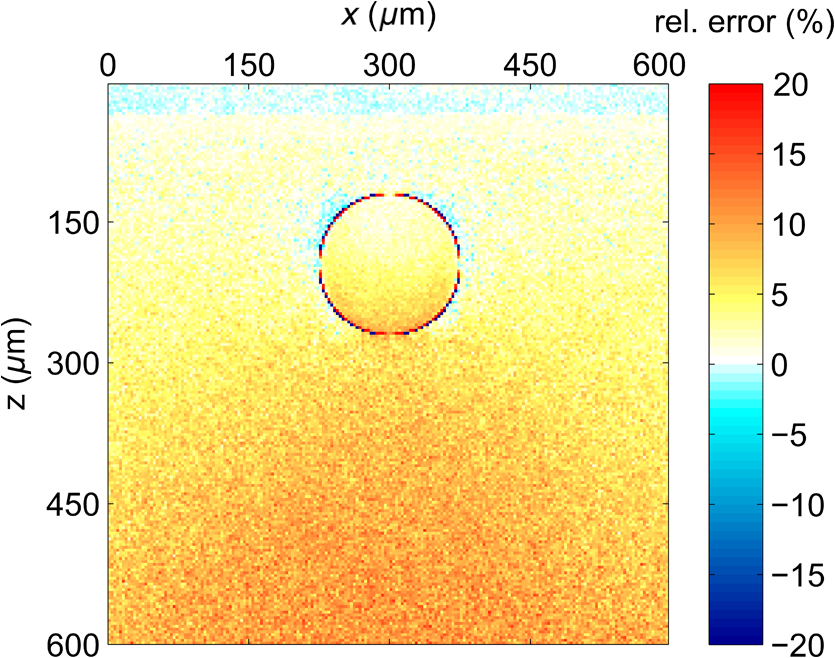 A large area of positive values is also evident in the dermis below the vessel. The discrepancies here amount to 8% to 18%, which is more than that within the vessel. We also find it interesting that the affected region does not shrink with subsurface depth. Moreover, as evidenced by the vertical profile in Fig. 11, the values there do not decrease with depth but rather tend to increase toward the bottom of the VOI. Fig. 11Average relative difference of deposited energy profile through the axis of a vessel with a diameter of (blue line). Standard deviation and standard error of the average value are presented with thin lines (red) and shaded band (light blue), respectively. Boundaries of the epidermis and vessel are indicated by vertical lines. 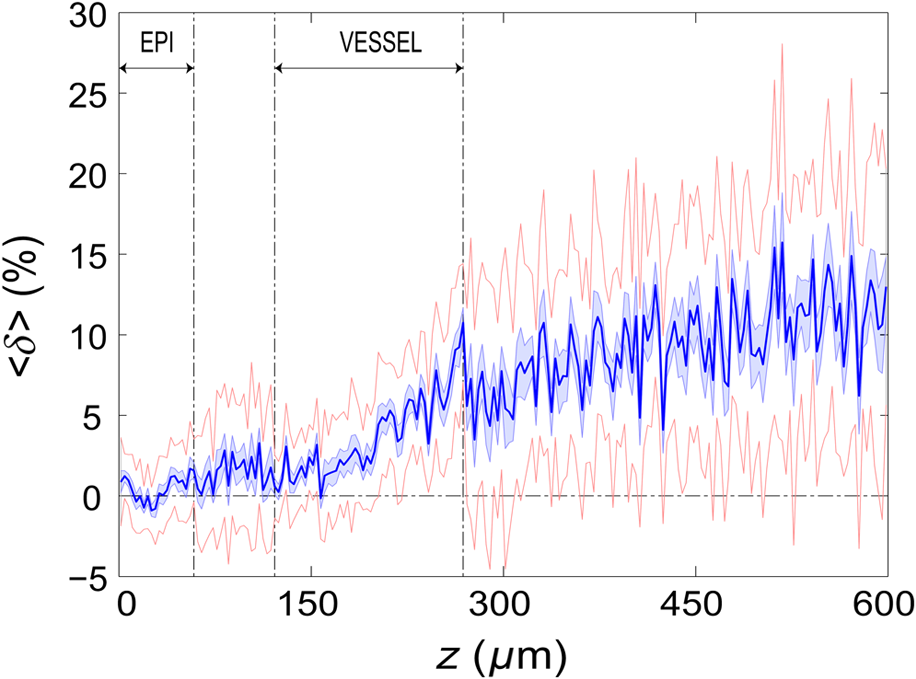 In contrast, small negative values of are apparent throughout the epidermis and in the dermis laterally to the vessel border. As will be discussed further below, these discrepancies are mutually consistent and can be linked to the inaccurate treatment of light reflection and refraction at the vessel boundary in MC model D. The influences of discretization step and grid positioning for this test geometry are presented in Fig. 12. In the original grid (open circles), the values of are nearly independent of and stabilize around 6% at sufficiently fine discretization (). With the shifted grid, in contrast, varies much more (solid circles; red) and increases nearly monotonically from approximately –5% at to at the smallest discretization step under test. Fig. 12(a) Relative difference of the linear energy depositions, , and (b) relative error of surface area () as a function of discretization step () for the diameter vessel in the original (crosses) and shifted grids (squares).  Note that the shape of the diameter vessel in model D is represented rather accurately at the involved discretization steps. For both grid positions under test, the relative error of its cross-sectional area [; Fig. 12(b)] practically vanishes for and thus has a negligible influence on the observed behavior of at the smallest . This strongly suggests that the latter results from an inherent deficiency in the treatment of light reflection and refraction in model D. 3.3.Laser Beam Diameter of 5 mmThe same analysis as presented above is performed next for irradiation with a 5.0-mm diameter hat-top laser beam. For these examples, we apply the “mirror” boundary condition at the VOI side boundaries. This is based on our earlier observation that the effect of a 5-mm laser beam on shallow blood vessels practically matches that of an infinitely wide incident wave.6 Because the photons are now launched only within the VOI top surface, a smaller number of them (i.e., ) provide the same incident photon flux and thus a comparable level of numerical noise to that seen in the former results. This approach thus speeds up the modeling process considerably while yielding sufficiently accurate results, as was verified by direct comparisons with the more versatile extended-layer approach. For the blood vessel, the energy uptake per unit of length, , is 2.9 times higher than with the 1.2-mm beam if the same radiant exposure of is considered (see Table 2). However, the differences between the results from our two MC models are qualitatively and quantitatively very similar to those obtained with the 1.2-mm laser beam (Figs. 4–9) and are, therefore, not presented. For example, the relative difference between the linear energy deposition values at the finest discretization equals , which is the same as that obtained for the narrow laser beam [see Fig. 9(a)]. Table 2Linear density of energy deposition, 〈aL〉 (in J/mm), in blood vessels with diameters of 30 and 150 μm irradiated with hat-top laser beams with diameters of 1.2 and 5.0 mm. Results from MC model G for radiant exposure of 10 J/cm2.
For the larger blood vessel (), the increase in associated with switching to the larger beam diameter is 2.5-fold (Table 2). In this case, the MC model D predicts a somewhat higher energy deposition as compared with model G in most of the blood vessel (Fig. 13). In contrast to the result obtained for the 1.2-mm laser beam, however, the effect is now most prominent in the lateral parts of the vessel lumen (yellow/orange hues), while no significant difference is indicated near the vertical symmetry plane. The values do not exceed 2%, which is considerably less than in the former example. Fig. 13Transversal cross section of the skin model involving a vessel irradiated by a 5.0-mm diameter beam, showing average relative difference of the energy deposition between the models D and G. 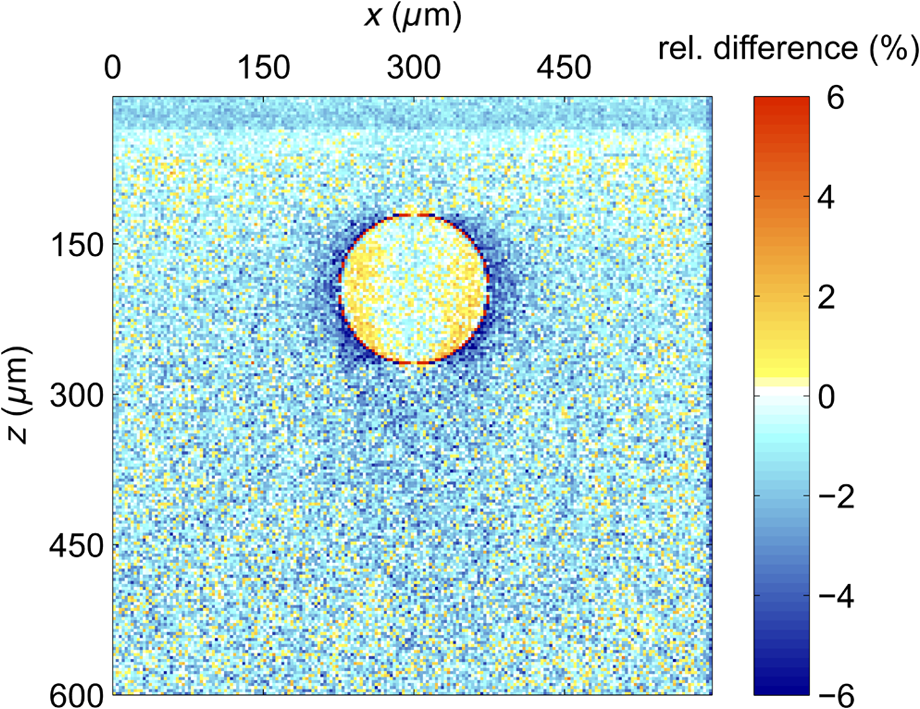 Negative values of (blue) reaching up to can be observed in the dermis lateral to the vessel boundary. The underestimation of energy deposition in this area by model D is significantly more pronounced as compared to irradiation with the narrower laser beam (see Fig. 10). Another evident difference with the former result is the absence of positive values underneath the blood vessel. In the epidermis, amounts to approximately . In Fig. 14, we compare the linear energy deposition values, , obtained with the two MC models and by varying the discretization step. Just as seen above for the narrow-beam irradiation (Fig. 7), the values from our augmented model G (solid squares) are practically constant. Meanwhile, the results from model D (open circles) feature an apparently erratic variation with , which turns out to be closely correlated with the error of the vessel’s cross-sectional area, [see Fig. 12(b)]. Fig. 14Linear energy deposition, [Eq. (5)] in the diameter vessel irradiated with 5-mm laser beam, as a function of the spatial discretization step () for models D (open circles) and G (solid squares).  The relative difference between the two linear energy deposition values, [Eq. (6)], is in the range of 0% to 2% and stabilizes around with the finest discretizations. This value is markedly smaller than that obtained for the narrow laser beam [Fig. 12(a)]. Nevertheless, it is undoubtedly different from zero and positive, which is the same qualitative effect as seen in all the above examples. Shifting of the computational grid by did not have any appreciable effect on the predictions of integral physical quantities such as at sufficiently fine spatial discretization and is, therefore, not documented. 3.4.Undulating Epidermal–Dermal BoundaryIn the test geometries analyzed above, the boundary between the epidermis and dermis was modeled as a flat surface (Fig. 1). In this way, we could isolate the effects resulting from different treatments of light reflection and refraction at the curved boundary between the blood vessel and dermis in two implementations of the 3-D MC modeling approach (i.e., models D and G). Interaction of model photons with the flat epidermal–dermal (ED) boundary was identical (and physically correct) in both models. In reality, the ED boundary in human skin is strongly undulating. In addition, the respective refractive indices differ even more than those of blood and dermis, versus (see Table 1). It is, therefore, of interest to check to what extent the above simplification might have affected the modeling results, and in particular our provisional conclusions regarding the deficiency of the approach implemented in model D. To this effect, we model the ED boundary with a periodically undulating function: For its parameters, we choose the mean epidermal thickness (), undulation amplitude (), and characteristic lateral dimension () typical for human skin. In MC model D, the ED boundary is approximated by a serrated surface, similar to the boundary between the vessel and dermis. Apart from this change of sample geometry, the modeling process follows identical steps as in previous examples. In the augmented model G, however, each photon relocation now requires additional testing of whether it has crossed the ED boundary defined by Eq. (7). If so, the first crossing point (in the direction of photon travel) is determined by solving an implicit equation. After computing the unity normal vector () at the intersection point, modeling proceeds in the same manner as at the vessel–dermis boundary (see Appendix). We will present here only one example, the physically and clinically most relevant case involving the blood vessel irradiated with the wide laser beam (). Because the test geometry does not possess the same symmetry as before, the “mirror” boundary condition at the side VOI boundaries is no longer appropriate. However, the commensurability between the periodicity of the ED boundary () and the VOI dimension () allows us to apply the so-called periodic boundary condition. Whenever a photon crosses the VOI side boundary, it is translated to the opposite side of the VOI with the same direction vector, . 3.4.1.Differences between the MC Models D and GFigure 15 presents the relative differences between the energy deposition values as obtained using our two MC models, [Eq. (1)], in cross-sectional planes perpendicular to the vessel axis (left panel) and along the same (right). The results were computed with spatial discretization of and incident photons. Fig. 15Relative difference of the linear energy deposition as a function of discretization step size for the diameter vessel and 5.0-mm diameter laser beam.  The relatively high noise level in the image reflects the fact that, due to lower symmetry of the model geometry, we could not average the results from multiple central slices (). Nevertheless, the periodicity of [Eq. (7)] allows us to average the data from four identical blocks of thickness . Consequently, Fig. 15 presents the values along the direction for only one such segment. The result clearly indicates that the energy deposition in MC model D exceeds that predicted by the augmented model G in the dermis under the “peaks” of the ED boundary. At the same time, it underestimates energy deposition in epidermal “troughs” (pockets) and the dermis just below them. The relative deviations in these areas reach values of and , respectively. The differences within the dermis decrease with depth due to the increasing influence of light scattering. Nevertheless, positive and negative deviations of energy deposition, spatially correlated with undulations of the ED boundary in both the and directions, are also evident inside the blood vessel. However, the predicted energy uptake by the vessel, (from model G), is practically identical to the value obtained with the flat ED boundary (Table 2). The deviation in model D is also the same as seen in the former case at similar spatial discretization steps, . Similarly, the assessed values for total reflectance of the modeled geometry amount to 24.5% and 24.6% from models D and G, respectively, and do not differ significantly from the values obtained when considering the flat ED boundary. 4.DiscussionOur study demonstrates an intrinsic deficiency of the common approach to 3-D MC modeling of light transport in biological tissues and organs, involving the discretization of space by a Cartesian grid. Spatial distributions of energy deposition in subsurface blood vessels as predicted by such an approach (implemented in our model D) in general display physically plausible effects, in good correspondence with earlier published results. For example, for irradiation with a narrow laser beam, the energy deposition peaks at the top of the vessel lumen due to a considerable amount of nonscattered or single-scattered incident photons (Figs. 3 and 4).1,4–6 However, our systematic analysis reveals significant inconsistencies of the above approach when the model geometry involves round or oblique boundaries between different tissues. Most notably, the linear density of energy deposition inside the blood vessel, [Eq. (5)], which is a highly relevant integral quantity, varies considerably and erratically with the grid discretization step (Figs. 7 and 14). The same quantity and its dependence on are also strongly affected by minute lateral shifting of the computational grid [Figs. 9(a) and 12(a)]. In contrast, the augmented implementation (model G), which involves rigorous treatment of reflection and refraction at the analytically defined vessel boundary, is completely free from such artifacts (Figs. 7 and 14). With the latter, more trustworthy approach used as a reference, we show that the deviations of the results obtained using model D can be considerable. For the PWS vessel irradiated with a laser beam of finite diameter (), e.g., the relative discrepancies lie anywhere between and , depending on (Fig. 9). For the larger blood vessel (), these values are somewhat smaller but still vary between and (Fig. 12). A certain part of these discrepancies and their apparently erratic behavior can be linked to the vessel’s cross-sectional area in model D, which in general differs from its geometrically correct value and also varies with both and grid positioning [Figs. 9(b) and 12(b)]. However, the above discrepancies (unlike ) do not disappear with ever finer spatial discretization. Instead, at sufficiently small discretization steps, the values of invariably converge toward finite positive values, depending on the vessel size: 2% to 5% for the small and 5% to 6% for the larger blood vessel [Figs. 9(a) and 12(a), respectively]. This residual artifact reveals the inherent inaccuracy of the MC model D, which results from inappropriate treatment of light reflection and refraction at the curved vessel boundary. Such interpretation is also supported by analysis of the observed differences between the spatial distributions of deposited laser energy, as predicted by the two versions of the 3-D MC code. These are evident in particular but not exclusively near the curved boundaries between different tissues. The key difference between the two approaches is that in model D, all unscattered incident photons impinge on the approximated vessel–dermis boundary at a normal angle, irrespective of the spatial discretization step [see Fig. 2(a)]. According to Fresnel’s equation, these photons experience very low reflectivity of this interface (; Fig. 16). Considering the rather large scattering anisotropy factor of the epidermis and dermis (), most single-scattered photons will also hit the interface at rather small incidence angles (), where the reflectivity is still very low. Fig. 16Reflectivity for nonpolarized light incident on the blood vessel boundary with dermis at different angles, . Total internal reflection occurs for larger than .  In our model G, in contrast, the incidence angle of nonscattered photons varies with lateral position of the photon [Fig. 2(b)]. Specifically, increases with distance from the vessel axis, leading to progressively larger reflectivity (Fig. 16). Moreover, approximately 3% of the unscattered photons impinging on the model vessel will undergo internal total reflection as exceeds the critical angle, . Since this effect is not accounted for in model D, it leads to excess light fluence and thus an overestimation of energy deposition inside the vessel in comparison with the more accurate model G. The largest deviations are observed near the bottom of the vessel lumen and amount to in the smaller (Fig. 6) and in the larger blood vessels (Figs. 10 and 11). For the very same reason, most vertically impinging photons (apart from those absorbed inside the vessel) also pass through the vessel’s bottom boundary in model D, thus causing the overestimated deposition of energy in the dermis underneath it (Fig. 10). At the same time, photons that are reflected away by the round vessel–dermis boundary (in model G) can contribute to energy deposition in the nearby dermis. The absence of this effect in model D features as the halo of small negative values of in the dermis laterally to the blood vessel (Fig. 10). Upon multiple scattering events in the dermis, some of these photons may reach the epidermis, so the above effect also translates to small negative values of in this layer. The situation is not as transparent in the case of irradiation with the wider laser beam (). It is plausible, however, that the increased role of photons impinging on the vessel boundary at oblique angles helps to reduce the deficiency of model D. The unphysical variation of with and its residual deviation at the smallest (Fig. 14) are both significantly smaller than that observed for irradiation with the narrower laser beam. Also, the influence of numerous photons reflected away from the vessel (in model G), which may consequently cross the VOI boundary and thus not contribute to energy deposition within it (featuring as predominantly positive values in most of the VOI in Fig. 10), is now largely compensated by the photons entering the VOI from the surrounding irradiated tissue. Nevertheless, the halo of negative values, amounting to a few percent, persists near the vessel boundary (Fig. 13). The results obtained for the case of an undulating boundary between the epidermis and dermis show that the simplified MC approach (model D) underestimates energy deposition in the deepest pockets of the epidermis (Fig. 15). Due to high melanin concentration near the ED junction, such an artifact could result in underestimation of nonselective energy deposition in a hypothetical treatment planning, potentially leading to overheating of the ED junction with consequent adverse side effects. However, the amplitudes of these deviations in our example do not exceed , which is likely below the absolute accuracy of any such modeling attempt. On the other hand, such small deviations (together with negligible differences between the values for total reflectance predicted by our models D and G) could result from the rather small inclination of the ED junction in our analytical description (maximum up to 51.5 deg). This could change with deeper and/or narrower undulations, not uncommon in human skin. The pattern of positive and negative deviations of energy deposition in model D, spatially correlated with undulations of the ED boundary, is also evident inside the subsurface blood vessel (Fig. 15). However, the predicted energy uptake by the vessel as a whole is nearly identical to the value obtained for the flat ED boundary. In view of the evident advantages of the augmented 3-D MC modeling implemented in our model G, it is important to note that we did not find it any more computationally demanding than the customary approach (model D). On the contrary, at the finest spatial discretization () and with photons, typical computation times on a modest personal computer (Core 2 Duo E8400 processor by Intel, 4 GB of 800 MHz RAM) amounted to 180 min for model G, versus 200 min for model D. Moreover, if one is primarily interested in physically relevant integral quantities, such as , rather than detailed spatial distributions of deposited energy, model G allows the use of much coarser discretization grids without a significant loss of accuracy (Figs. 7 and 14), thereby enabling considerably shorter computation times. In summary, our study demonstrates that in addition to matching model representations to realistic shapes of organ structures, it is also very important to account for inclinations of boundaries between tissues with different refractive indices. While perfectly cuboid inclusions (which are hardly realistic to begin with) could be treated accurately using the customary approach (model D), this holds only as long as all their sides coincide with the Cartesian computational grid. Any deformation of such a shape, or even rotation along any axis, will inevitably introduce oblique or round surfaces where reflection and refraction of incident collimated laser beam will be very different from predictions for a segmented object surface composed from exclusively horizontal and vertical elements (see Fig. 2). Ultimately, as soon as the actual geometry deviates from flat and parallel tissue layers, the traditional approach should not be trusted a priori. It is fair to admit that accounting for very complex tissue structures by using the advocated approach (model G) could become impractical. More advanced, recently introduced techniques, e.g., using tetrahedron-based meshing15 or generic finite-element methods, possibly based on actual anatomy16 may have to be adopted for such highly realistic modeling. However, these approaches can be very complex for implementation and introduce significant computational loads for generation of the non-Cartesian mesh adapted to specific object geometry, as well as postprocessing of the results for rendering and analysis.17 3-D MC modeling in a Cartesian computational grid will, therefore, likely remain relevant for smaller proof-of-concept and/or parametric studies involving moderately complex models of tissue structures. Within this framework, physically correct treatment of light reflection and refraction at analytically defined tissue boundaries allows one to avoid the quantitative inconsistencies and residual artifacts intrinsic to the traditional approach (model D), with only a moderate investment in augmentation of the modeling code. 5.ConclusionsPerformance of a common 3-D MC approach involving a division of tissue geometry into optically homogeneous cuboid voxels, was compared against an augmented modeling approach where reflection and refraction at analytically defined tissue boundaries are treated in a rigorous manner. The results show that the first approach suffers from systematic artifacts, both in spatial distribution of the energy deposition as well as linear density of energy uptake by the blood vessels. The artifacts are significant in amplitude, vary erratically with the spatial discretization step and minute shifting of the computational grid and do not disappear with ever finer spatial discretization. The augmented approach to 3-D MC modeling avoids such artifacts arising from inappropriate treatment of light reflection and refraction at round tissue boundaries, with only a moderate investment in the implementation of the modeling code. AppendicesAppendixWe derive here the relations governing reflection and refraction of MC photons at the curved vessel boundary. In the interest of space, presentation is limited to photons incident onto the vessel boundary from the dermis side. Treatment of photons incident from the vessel side follows the same steps as described below.18 Two local coordinate systems are introduced, with the -axis coinciding with the vessel axis (Fig. 17). One has the axes and parallel to the respective axes of the “global” coordinate system (solid lines), and the second is rotated such that its -axis is collinear with the normal to the vessel boundary at the point of photon incidence (dashed, labeled ). Fig. 17Illustration for derivations of refraction and reflection relations for a MC photon incident on the vessel boundary from the dermal side.  Transformation from the first to the second local system is represented by the rotation matrix: and the rotation angle can be assessed from where is the vessel radius, and () and () mark the coordinates of the photon incidence point and vessel axis, respectively, in the global coordinate system.Direction vector of the incident photon, , is thus expressed in the rotated coordinate system as The direction vector after reflection from the boundary, , is now obtained simply by changing the sign of component . Upon transformation back to the global coordinate system (by multiplying with the inverse of matrix ), we obtain The explicit expression for the reflected direction vector can be obtained by substitution of the three components of from Eq. (10), which results in Refraction at the vessel boundary can be described in the rotated coordinate system as follows:14 where and represent the refractive indices of the first and the second tissues, respectively, is the refraction angle, and marks the sign function. The refracted direction vector expressed in the global coordinate system is then obtained analogously to the above:The explicit expression can again be obtained by substituting the components of from their expressions given in Eq. (10). ReferencesG. W. Lucassenet al.,
“Light distributions in a port wine stain model containing multiple cylindrical and curved blood vessels,”
Laser Surg. Med., 18 345
–357
(1996). http://dx.doi.org/10.1002/(ISSN)1096-9101 LSMEDI 0196-8092 Google Scholar
A. J. WelchC. M. Gardner,
“Monte Carlo model for determination of the role of heat generation in laser-irradiated tissue,”
J. Biomech. Eng., 119
(4), 489
–495
(1997). http://dx.doi.org/10.1115/1.2798298 JBENDY 0148-0731 Google Scholar
T. J. Pfeferet al.,
“Modeling laser treatment of port wine stains with a computer-reconstructed biopsy,”
Laser Surg. Med., 24 151
–166
(1999). http://dx.doi.org/10.1002/(ISSN)1096-9101 LSMEDI 0196-8092 Google Scholar
J. W. TunnellL. V. WangB. Anvari,
“Optimum pulse duration and radiant exposure for vascular laser therapy of dark port-wine skin: a theoretical study,”
Appl. Opt., 42
(7), 1367
–1378
(2003). http://dx.doi.org/10.1364/AO.42.001367 APOPAI 0003-6935 Google Scholar
E. V. RossY. Domankevitz,
“Laser treatment of leg veins: physical mechanisms and theoretical considerations,”
Lasers Surg. Med., 36 105
–116
(2005). http://dx.doi.org/10.1002/(ISSN)1096-9101 LSMEDI 0196-8092 Google Scholar
M. MilaničB. Majaron,
“Three-dimensional Monte Carlo model of pulsed laser treatment of cutaneous vascular lesions,”
J. Biomed. Opt., 16
(12), 128002
(2011). http://dx.doi.org/10.1117/1.3659205 JBOPFO 1083-3668 Google Scholar
M. Milaničet al.,
“Numerical optimization of sequential cryogen spray cooling and laser irradiation for improved therapy of port wine stain,”
Laser Surg. Med., 43 164
–175
(2011). http://dx.doi.org/10.1002/lsm.v43.2 LSMEDI 0196-8092 Google Scholar
S. K. Changet al.,
“Analytical model to describe fluorescence spectra of normal and preneoplastic epithelial tissue: comparison with Monte Carlo simulations and clinical measurements,”
J. Biomed. Opt., 9
(3), 511
–522
(2004). http://dx.doi.org/10.1117/1.1695559 JBOPFO 1083-3668 Google Scholar
D. Y. Churmakovet al.,
“Analysis of skin tissues spatial fluorescence distribution by the Monte Carlo simulation,”
J. Phys. D: Appl. Phys., 36 1722
–17728
(2003). http://dx.doi.org/10.1088/0022-3727/36/14/311 JPAPBE 0022-3727 Google Scholar
R. H. Wilsonet al.,
“Mesh-based Monte Carlo code for fluorescence modeling in complex tissues with irregular boundaries,”
Proc. SPIE, 8090 80900E
(2011). http://dx.doi.org/10.1117/12.889718 PSISDG 0277-786X Google Scholar
H. W. Jentinket al.,
“Monte Carlo simulations of laser Doppler blood flow measurements in tissue,”
Appl. Opt., 29
(16), 2371
–2381
(1990). http://dx.doi.org/10.1364/AO.29.002371 APOPAI 0003-6935 Google Scholar
C. R. Simpsonet al.,
“Near-infrared optical properties of ex vivo human skin and subcutaneous tissues measured using the Monte Carlo inversion technique,”
Phys. Med. Biol., 43
(9), 2465
–2478
(1998). http://dx.doi.org/10.1088/0031-9155/43/9/003 PHMBA7 0031-9155 Google Scholar
T. Binzoniet al.,
“Light transport in tissue by 3D Monte Carlo: influence of boundary voxelization,”
Comput. Methods Programs Biomed., 89
(1), 14
–23
(2008). http://dx.doi.org/10.1016/j.cmpb.2007.10.008 CMPBEK 0169-2607 Google Scholar
L. WangS. L. JacquesL. Zheng,
“MCML—Monte Carlo modeling of light transport in multi-layered tissues,”
Comput. Methods Programs Biomed., 47
(2), 131
–146
(1995). http://dx.doi.org/10.1016/0169-2607(95)01640-F CMPBEK 0169-2607 Google Scholar
H. ShenG. Wang,
“A tetrahedron-based inhomogeneous Monte Carlo optical simulator,”
Phys. Med. Biol., 55
(4), 947
–962
(2010). http://dx.doi.org/10.1088/0031-9155/55/4/003 PHMBA7 0031-9155 Google Scholar
H. Liet al.,
“A mouse optical simulation environment (MOSE) to investigate bioluminescent phenomena in the living mouse with the Monte Carlo method,”
Acad. Radiol., 11
(9), 1029
–1038
(2004). http://dx.doi.org/10.1016/j.acra.2004.05.021 1076-6332 Google Scholar
V. PeriyasamyM. Pramanik,
“Monte Carlo simulation of light transport in turbid medium with embedded object—spherical, cylindrical, ellipsoidal, or cuboidal objects embedded within multilayered tissues,”
J. Biomed. Opt., 19
(4), 045003
(2014). http://dx.doi.org/10.1117/1.JBO.19.4.045003 JBOPFO 1083-3668 Google Scholar
J. Premru,
“Numerical simulation of radiation transfer in biological tissues using Monte Carlo technique with geometrically correct treatment of tissue boundaries,”
University of Ljubljana,
(2012). Google Scholar
BiographyBoris Majaron is a senior scientific associate at Jožef Stefan Institute in Ljubljana, Slovenia. After having obtained his PhD degree in physics from University of Ljubljana in 1993, his research interests have gradually shifted from laser physics and spectroscopy of solid-state laser materials to biomedical optics, specifically laser ablation and characterization of biological tissues using pulsed photothermal radiometry and diffuse reflectance spectroscopy. He is an editorial board member for Lasers in Surgery and Medicine. Matija Milanič received his PhD degree in physics from the University of Ljubljana in 2008. Since 2003, he has worked as a research assistant at Jožef Stefan Institute, Slovenia. Principal topics of his research involve interaction of light with biological tissues, from photothermal radiometry, spectroscopy, and imaging to numerical simulations. He is currently undergoing postdoctoral training at Norwegian University of Science and Technology in Trondheim. |
|||||||||||||||||||||||||||||||


