
|
|
1.IntroductionStem cells can differentiate into diverse specialized cell types and self-renew to produce additional stem cells that possess potential in regenerative medicine and tissue engineering. For such applications, stem cells can be proliferated indefinitely and subsequently become progenies of different cellular types. In such cases, the ability to identify stem cell varieties, proliferation efficiency, and differentiation potential is of immense importance. In the past decade, progress has been made to improve the verification of stem cells by specific surface markers1 or gene expression patterns.2 In these techniques, either the physical destruction or labeling with fluorescence dyes render these approaches inapplicable in the clinical setting. Therefore, the development of label-free, noninvasive techniques in the characterization of stem cells is becoming increasingly more popular. Specifically, label-free techniques based on the dielectric properties of stem cells3 or chemical analysis by Raman spectroscopy4,5 have been developed to identify stem cells from their differentiated progenies. Recently, numerous studies focus on the metabolic state or metabolic pathway of stem cell as means of indicating their differentiation potentials.6 Embryonic stem cells have been found to remain in anaerobic or glycolytic metabolism when they are in the undifferentiated state, and it was found that an upregulation of mitochondrial function is essential for their successful differentiation.7,8 In addition, it was reported that in human mesenchymal stem cells (hMSCs), oxidative phosphorylation dominated energy production after osteogenic differentiation,9,10 but chondrogenic induction in hMSCs resulted in a shift toward a predominantly glycolytic metabolism.10 These findings indicated that the metabolic or mitochondrial function shift can be an applicable biomarker for the determination of stem cell differentiation capabilities. Reduced nicotinamide adenine dinucleotide (NADH), an intrinsic fluorophore which has an excitation peak and fluorescence peak at about 340 and 450 nm, respectively, is a key coenzyme involved in numerous biochemical reactions and serves as the main electron carrier in oxidative phosphorylation. As in earlier pioneering work using NADH fluorescence for metabolic imaging, the relative amounts of reduced and oxidized NADH can be used to monitor metabolic change and mitochondrial function.11 Typically, the detection of NADH fluorescence intensity is combined with the detection of the intrinsic fluorophore flavin adenine dinucleotide (FAD). The ratio of FAD to NADH, specified as the redox ratio, has been used as an indicator for yielding more reliable information of cellular metabolism than NADH or FAD alone.12 Using this noninvasive ratiometric technique, the increase in mitochondrial function of hMSCs after osteogenic induction was revealed by the increase in redox ratio, i.e., decrease in NADH fluorescence and/or increase in FAD fluorescence.13,14 On the other hand, fluorescence lifetime is another imaging approach and it is different from fluorescence intensity methodology in that it is concentration independent. Furthermore, lifetime imaging is sensitive to the microenvironment; therefore, it can provide an insight into molecular dynamics of endogenous fluorophores.15 Fluorescence lifetime measurement of NADH revealed that multiple states of NADH depended on the enzyme to which it is bound. Typically, NADH is known to exhibit a short or long fluorescence lifetime component depending whether it is in a free or protein-bound form. Protein-bound NADH is characterized by a complex multiexponential lifetime decay that has been attributed to its binding to different enzymes, such as malate dehydrogenase and lactate dehydrogenase.16 Therefore, changes to NADH fluorescence lifetime are considered to be due to changes in enzymatic binding. Several studies have shown the ratio of free-to-bound NADH is related to the amount of energy production through the manipulation of various metabolic inhibitors.17–21 Recently, NADH fluorescence lifetime has been used to discriminate undifferentiated stem cells and their differentiated progenies that are likely attributed to metabolic change during differentiation.22–26 However, the correlation between NADH lifetime and metabolic change from undifferentiated stem cells to differentiated progenies are not demonstrated. A basic understanding in developing the methodology of monitoring metabolism through detecting intrinsic biomarker NADH fluorescence lifetime is essential. In this study, we measured NADH fluorescence lifetime, expression of respiratory enzymes, and mitochondrial functions of hMSCs after osteogenic differentiation up to 4 weeks to investigate their correlations. We further investigate if the correlation holds under reduced/inhibited mitochondrial metabolism by treating the cells with a mitochondrial respiration inhibitor oligomycin A (OA), which acts to lower adenosine triphosphate (ATP) production, and decrease oxygen consumption, resulting in mitochondrial metabolic inhibition. The mitochondrial complex protein expression from Complex I-V was studied to further understand the possible origin of NADH fluorescence lifetime as an intrinsic biomarker for metabolic states. 2.Material and Methods2.1.Culture and Osteogenic Differentiation of Human Mesenchymal Stem CellshMSCs isolated from the bone marrow aspirates of healthy donor were cultured in MesenPro medium consisting of 2% fetal bovine serum.27 (Gibco BRL, Invitrogen, Grand Island, New York.) Osteogenic differentiation of hMSCs was performed as previously reported.9,27 The procedure to obtain hMSCs is approved by Institutional Review Board of Taipei Veteran General Hospital and informed consent of the donors was obtained as previously reported.22 In briefly, hMSCs were first seeded at a density of . Next, osteogenic induction was carried out at confluency of cultured hMSCs in osteogenic induction medium [serum-free IMDM, dexamethasone, 0.2 mM ascorbic acid, 10 mM -glycerol phosphate (Sigma-Aldrich, St. Louis, Missouri), and penicillin and streptomycin]. The induction medium was changed twice a week until the cells were harvested. In part of the experiments, cells were treated with OA in the induction medium at the beginning of osteogenic induction to attenuate/inhibit oxidative metabolic activity. We carefully chose the dose of OA based on our previous study9 so that the cell survival rate remained the same as that of the controls but ATP decreased during differentiation. 2.2.NADH Fluorescence Lifetime ImageNADH fluorescence lifetime images of hMSCs were obtained as previously reported.22,28,29 In the beginning, hMSCs were seeded onto a 24-mm diameter glass coverslip (Paul Marienfeld GmbH & Co., Lauda- Konigshofen, Germany) and osteogenesis was induced as previously described. Prior to fluorescence lifetime imaging, the coverslip was washed twice using PBS and then transferred into an imaging chamber and 1-ml aliquot of 5 mM 4-(2- hydroxyethyl)-1-piperazineethanesulfonic acid (HEPES) buffer (5 mM KCl, 140 mM NaCl, 2 mM , 1 mM , 10 mM glucose, pH 7.4) was added to maintain physiological state and avoid light absorption of the culture medium. hMSCs were imaged with a two-photon laser scanning microscope and with a 1.45 PlanApochromat oil objective lens (Olympus Corp., Tokyo, Japan). NADH fluorescence was excited at 740 nm by a Verdi pumped modelocked femtosecond Ti:sapphire laser (Coherent, Inc., Santa Clara, California) at 76 MHz and the emitted fluorescent light was detected at , with the NADH fluorescence peaks detected by a bandpass filter (Semrock Inc., Rochester, New York). Fluorescence photons were detected by a photon-counting photomultiplier H7422P-40 (Hamamatsu Photonics K.K., Hamamatsu, Japan). All the images were taken at resolution with an acquisition time of 900 s. Cells were incubated at 37°C and 5% during the image acquisition. Time-resolved detection was conducted by the time-correlated single-photon counting SPC-830 board (Becker & Hickl GmbH, Berlin, Germany). Data were analyzed with the commercially available SPC Image v2.8 software (Becker & Hickl GmbH, Berlin, Germany) via a convolution of a two component exponential decay function, and the instrument response function (IRF), and then were fitted to the actual data to extract lifetime parameters , and . is the mean lifetime defined as . IRF was measured using a second-harmonic–generated signal from a periodically poled lithium niobate crystal as a standard procedure. The full width at half maximum of our IRF is , which is similar to other published results.19,30 In addition, the value of NADH lifetime was calculated over the entire image. The field-of-view of each image is , which covered about one to two stem cells. The sample size per time point is five to eight independent samples, meaning five to eight cell culture dishes. We took two to three images from different sites per dish. 2.3.Alkaline Phosphatase Staining and Activity AssayFor alkaline phosphatase (ALP) staining, cells grown in 35 mm dishes were fixed with 4% paraformaldehyde and then permeabilized with 0.1% Triton-X 100. Intracellular ALP was revealed by staining 5-bromo-4-chloro-3-indolyl phosphate/nitroblue tetrazolium (Sigma-Aldrich). The assay of ALP activity used is similar to that previously reported.9 Cells grown in 48-well plates were disintegrated with 0.05% sodium dodecyl sulfate (SDS) and then incubated in assay solution containing 8 mM 4-nitrophenyl phosphate and 2 mM in 2-amino-2-1-propanol for 1 h. The reaction was inhibited by the addition of 0.02 N NaOH and the release of 4-nitrophenol was measured by an ELISA reader (Thermo Scientific, Waltham, Massachusetts) at 405 nm. Cell content was measured by a standard called alamarBlue assay. The results are presented as the normalized absorbance at 405 nm to cell content. 2.4.Measurement of Oxygen Consumption RateThe oxygen consumption rate (OCR) was measured by 782 Oxygen Meter (MitocellMT200A, Strathelvin Instrument, Motherwell, United Kingdom) as previously reported.29,31 An aliquot of cells was re-suspended in of assay buffer (125 mM sucrose, 65 mM KCl, 2 mM , 20 mM phosphate buffer, pH 7.2), and the cell suspension was transferred into the respiration chamber at 37°C with a water circulation system. An aliquot of 0.0004% digitonin was added to permeablilize the outer membrane of mitochondria. The substrate-supported OCR was measured after 17 mM glutamate and 17 mM malate were injected into the chamber for the requirement of the oxygen molecule. After recording the substrate-supported OCR, 1.5 mM adenosine diphosphate (ADP) was injected to measure the ADP-stimulated OCR, which assesses the efficiency of ATP synthesis and the integrity of mitochondrial respiratory chain.27 2.5.Measurement of Intracellular Adenosine Triphosphate LevelThe intercellular ATP level was measured by the bioluminescent somatic cell ATP assay kit (Sigma-Aldrich). Cells were collected at different time points and an aliquot of of viable cell suspension was mixed with of somatic cell releasing buffer to release the intercellular ATP. Half of the mixture (i.e., ) was then transferred into a black OptiPlate-96F 96-well plate containing ) of ATP assay mix in each well. The luminescence intensity was measured using the Victor2 1420 Multilabel Counter (PerkinElmer, Waltham, Massachusetts). The reported luminescence intensity was normalized to the cell number. 2.6.Measurement of Lactate Release RateThe lactate production rate was measured by a Lactate Reagent kit (Trinity Biotech PLC, Bray, Ireland). Cells in 6-well plates were replenished with fresh medium and incubated for 8 h. An aliquot of of medium was then transferred to a 96-well plate to mix with the Lactate Reagent, and absorbance at 540 nm was measured by an ELISA reader (Thermo Scientific). The lactate release rate was calculated as the absorbance normalized to the total cell number and then divided by the incubation time (h). 2.7.Western Blot AnalysisAn aliquot of 25 to of proteins was separated on a 10% SDS polyacrylamide electrophoresis gel and transferred onto a polyvinylidene difluoride membrane (Amersham Biosciences). Nonspecific bindings were blocked by 5% skim milk in Tris-buffered saline Tween 20 buffer (50 mM Tris-HCl, 150 mM NaCl, 0.1% Tween 20, pH 7.4), and the membrane was blotted indicating the anti-Complex I-V subunit primary antibodies, which were all purchased from Molecular Probe (Invitrogen). After incubation with a horseradish peroxidase-conjugated secondary antibody, the protein intensity was determined by an enhanced chemilluminescence reagent (PerkinElmer Life and Analytical Sciences, Boston). 3.Results3.1.Osteogenic Differentiation of hMSCs Without and With Oligomycin A TreatmentWe measured the ALP activity, a widely used differentiation biomarker during osteogenesis, in normal osteogenic differentiation as controls and with OA treatment to determine their osteogenic differentiation. After osteogenic induction, the morphology of hMSCs gradually became flattened and polygonal, and there was an increase in ALP activity staining [Fig. 1(A)]. Under OA treatment, we found that OA-treated hMSCs had weaker ALP staining at the same time point as compared with untreated controls [Fig. 1(A)]. We further measured ALP activity by spectrophotometric assay and found that the ALP activity under OA treatment increased slowly to show it started differentiation at week 2 with less activity as compared to normal osteogenic induction which started differentiation at week 1 [Fig. 1(B)]. These results confirmed that OA treatment inhibited osteogenic differentiation. Fig. 1(A) Alkaline phosphatase (ALP) stain of undifferentiated hMSCs (a) and differentiated hMSCs at 3 weeks without (ost3w_N) (b) or with OA treatment (ost3w_OA) (c). Note that the cell morphology became flattened and polygonal shapes after osteogenic induction. Scale bar is 100 μm. (B) ALP activity of hMSCs during osteogenic differentiation at 4 days (ost4d), 1 week (ost1w), 2 weeks (ost2w), 3 weeks (ost3w), and 4 weeks (ost4w). Black bars represent normal osteogenic induction and white bars represent osteogenic induction with OA treatment. Each data point was calculated based on data of 4 samples. Symbols * indicate that the value is significantly different (-value , Student’s -test) as compared with undifferentiated hMSCs (hMSC).  3.2.NADH Fluorescence Lifetime of hMSCs Increased During Normal Osteogenic Induction, but did not Increase With OA TreatmentWe have reported that NADH lifetime increased gradually during osteogenic differentiation for up to 3 weeks.22 To confirm this result, we repeated the experiment using hMSCs from a different donor. Figure 2(A) shows NADH fluorescence lifetime images of undifferentiated and differentiated hMSCs at 4 days and 1 to 4 weeks. Each pixel represents the mean lifetime () and was color-coded between 500 (red) and 2000 (blue) ps. Similar to our previous study, the NADH fluorescence lifetime of hMSCs exhibited a shift from shorter (yellow) to longer lifetime (green to blue) during osteogenic differentiation [Fig. 2(Aa–Af)]. Figure 2(Ag–Ak) shows NADH fluorescence lifetime image of differentiated hMSCs from 4 days to 4 weeks under OA treatment. No significant lifetime change was observed. We acquired at least five different images of mean lifetime from five different cultural dishes at each time point and plotted the average result in Fig. 2(B). The NADH fluorescence lifetime of normal hMSCs increased gradually from to reach a peak value of at week 3. The NADH fluorescence lifetime significantly increased () at week 1. The NADH fluorescence lifetime of differentiated hMSCs with OA treatment did not show any difference from that of undifferentiated hMSCs. Fig. 2(A) Two-photon fluorescence lifetime images of undifferentiated (hMSC) (a) and osteogenic differentiated hMSCs at 4 days (ost4d) (b), 1 week (ost1w) (c), 2 weeks (ost2w) (d), 3 weeks (ost3w) (e) and 4 weeks (ost4w) (f) after osteogenic induction. Osteogenic differentiated hMSCs with oligomycine A (OA) are shown from (g) to (k) at the same time points as those without OA. (B) The averaged results of NADH fluorescence lifetime were calculated from multiple images taken from different samples. Each data point was calculated based on data of at least five independent experiments. Symbols * indicate that the values are significantly different (-value , Student’s -test) as compared with undifferentiated hMSCs. Black bars represent normal osteogenic induction and white bars represent osteogenic induction with OA treatment.  3.3.ATP Level and Oxygen Consumption Increased and Lactate Release Rate Decreased During Normal Osteogenic Differentiation of hMSCsBecause osteogenic differentiation of hMSCs is associated with metabolic change,9,27 our observed NADH fluorescence lifetime increase is likely linked to this metabolic change during osteogenic differentiation. We measured cellular ATP level, oxygen consumption, and lactate release rate with or without OA treatment. Figure 3(a) shows that the cellular ATP level of hMSCs increased from cells gradually to a peak value of cells after differentiation for 3 weeks. The ATP level of differentiated hMSCs under OA treatment did not change, and even decreased to cells at 4 weeks after differentiation. The increasing trend in oxygen consumption of normal-differentiated hMSCs is similar to that of the ATP level [Fig. 3(b)]. The highest value of oxygen consumption is cells at 3 weeks after differentiation, which is increase as compared with undifferentiated hMSCs (). Under OA treatment, the value of oxygen consumption did not change compared to the value of undifferentiated hMSCs and significantly decreased to at weeks 1 and 4 after differentiation. Lactate release [Fig. 3(c)], an index of anaerobic glycolysis, was found to drop significantly in the beginning of normal osteogenic differentiation and then gradually increased afterward. The lactate release rate increased to about after 2 weeks of differentiation but was still significantly lower than the value of undifferentiated hMSCs (). Under OA treatment, the lactate release rate was higher than that under normal osteogeneic differentiation at all-time points from day 4 to week 4. At weeks 2 to 4, the lactate release rate was the same as that of undifferentiated hMSCs. The above results similar to those reported previously,9 indicated that the metabolic change of hMSCs is from glycolysis to more effective oxidative phosphorylation during normal osteogenic differentiation. However, under the inhibition of OA, the metabolic transformation from glycolysis to oxidative phosphorylation is not clear during osteogenic differentiation because both ATP and oxygen consumption did not pick up and lactate release was not efficiently inhibited. Fig. 3Measurements of adenosine triphosphate (ATP) content (a), oxygen consumption (b), and lactate release (c) of undifferentiated hMSCs (hMSC) and differentiated hMSCs at 4 days (ost4d), 1 week (ost1w), 2 weeks (ost2w), 3 weeks (ost3w), and 4 weeks (ost4w). Black bars represent normal osteogenic induction and white bars represent osteogenic induction with OA treatment. Symbols * indicates that the values are significantly different (-value , Student’s -test) as compared with undifferentiated hMSCs. 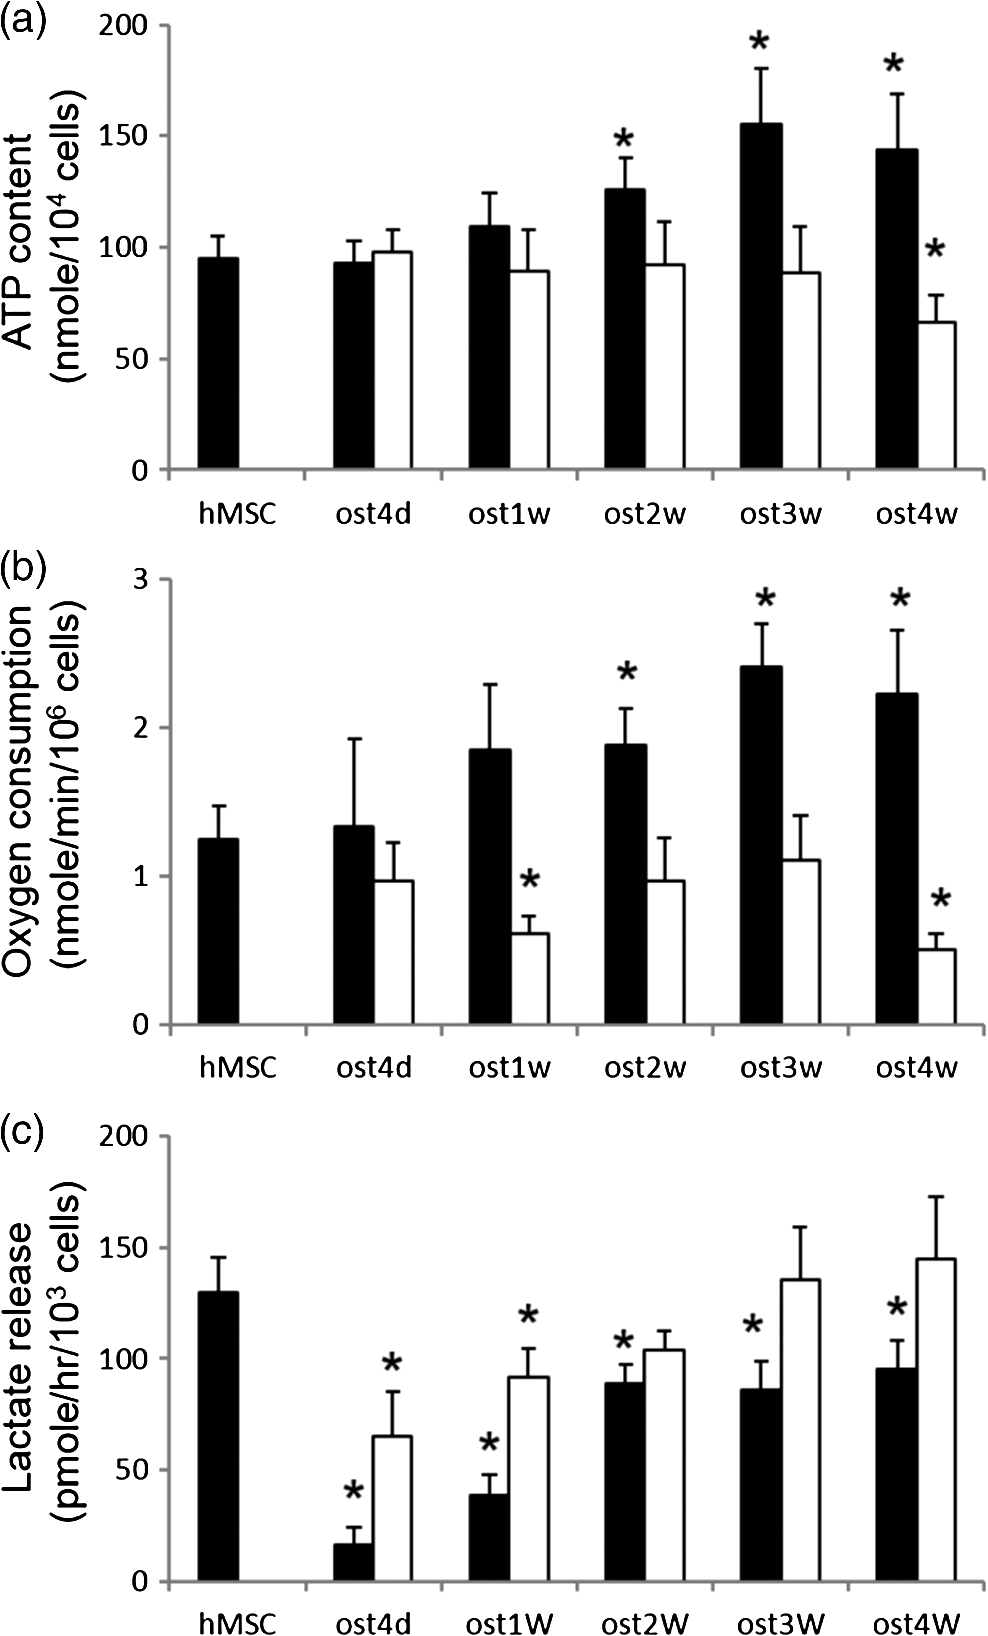 3.4.NADH Fluorescence Lifetime Correlated with Oxygen Consumption and ATP LevelFigure 4 plotted the relations of NADH fluorescence lifetime versus ATP level [Fig. 4(a)] and versus oxygen consumption [Fig. 4(b)] for normal osteogenic differentiation of hMSCs (solid squares). It shows that the NADH fluorescence lifetime correlated well with the ATP level and oxygen consumption ( and 0.91, respectively) suggesting that the NADH fluorescence lifetime is a reliable biomarker to reflect mitochondrial function during normal osteogenic differentiation. We also plotted the data points under OA treatment in the same figures (open squares). The NADH fluorescence lifetime remained at the minimal range regardless the change of ATP and oxygen consumption. Some of these changes are toward to lower values as compared to undifferentiated hMSCs. Fig. 4The correlation plots of NADH fluorescence lifetime with ATP level (a) and with oxygen consumption (b) at different time points. Black solid squares and open squares represent normal differentiation and differentiation with OA treatment, respectively. The correlation curve and values were calculated for normal differentiation group (black solid squares) only.  3.5.Expression of Respiratory Enzyme Complex Proteins Increased During Osteogenic DifferentiationIncreased expression of respiration enzyme complex proteins was reported to correspond to increased oxidative phosphorylation.9,27 These complex proteins are responsible for a series of electron transport reactions in producing ATPs. NADH was known to strongly associate with respiration enzyme Complex I.32 The free/bound NADH ratio was suggested to dominate the change of NADH fluorescence lifetime.31,33 Therefore, our observed increase in fluorescence NADH lifetime during osteogenic differentiation of hMSCs was possibly attributed to NADH interacting with respiration enzymes complex proteins, particularly Complex I. We analyzed the expression levels of protein subunits of respiratory enzyme Complex I-V by Western blot analysis as shown in Fig. 5. We found a significant increase () in the protein levels of core I subunit of Complex III and subunit of Complex V after osteogenic induction for 3 weeks. In addition, a slight increase () in the expression levels of NADH-ubiquinone-oxidoreductase subunit 6 of Complex I and cytochrome oxidase subunit 5 of Complex IV was also noted. The statistical result of complex proteins expression was listed in the bottom table of Fig. 5. Additionally, their association significance (-value) with NADH fluorescence lifetime was listed in Table 1. Fig. 5The expression level of respiratory enzyme complex proteins. The lower panel table is the statistical results by measuring the expression from at least three independent experiments and the value is the normalized expression to the value of hMSC. Symbol * indicates that the expression level of respiratory enzyme is significantly higher than that of the hMSCs.  Table 1The association between the parameters of NADH lifetime (τm, τ1, τ2, a1/a2) and Complex I-V expression after osteogenic differentiation for 4 weeks.
4.DiscussionOne property of some stem cell differentiations is the switching from anaerobic glycolysis to the more effective oxidative phosporylation, corresponding to an increase in aerobic metabolism. Previously, we have reported that the NADH lifetime increased gradually during osteogenic differentiation.22 A similar trend in NADH lifetime increase and free/bound NADH ratio decrease were also reported in adipogenic and neural differentiation.23,25 These studies indicated that NADH fluorescence lifetime may reflect metabolic change to detect the differentiation potential of stem cells. However, the direct relationship between NADH fluorescence lifetime and metabolic status during differentiation remains to be clarified. In this study, we used hMSCs to investigate NADH fluorescence lifetime and mitochondrial functions during osteogenic differentiation for up to 4 weeks. Similar to our previous study, the NADH fluorescence lifetime of hMSCs increased during osteogenic differentiation (Fig. 2). In the measurement of mitochondrial functions, ATP level and oxygen consumption increased and lactate release rate decreased significantly and then gradually recovered toward a control level after normal osteogenic differentiation (Fig. 3). NADH fluorescence lifetime was found to directly correlate to oxygen consumption (Fig. 4) but not lactate, which decreased and then increased [Fig. 3(c)], suggesting that NADH fluorescence lifetime is related to oxidative phosphorylation or aerobic metabolic activity, but not glycolysis or anaerobic metabolism. We also compared the association between free (i.e., ), bound NADH lifetime (i.e., ), or free-to-bound NADH ratio (i.e., ratio) and oxygen consumption because these lifetime parameters were reported to reflect changes during metabolic perturbation.19,30 Our results show that is associated with oxygen consumption (, ) but not , ) nor (, ). However, under OA treatment, values ( to 500 ps) did not remain the same as that of the controls (i.e., to 450 ps). did not correlate with oxygen consumption but the correlation is significant () when OA treated cells are included. One possible explanation is that our contaminated some bound NADH due to the limitation of our current two component analysis used. Vishwasrao et al.34 used a 4-component method and resolved a free NADH value of about 155 ps, and 3 bound NADH values of 599, 2154, and 6040 ps under normoxia condition. Our reported is to 500 ps which likely included both free and bound NADH with shorter lifetimes (i.e., ). Thus we only reported the mean NADH fluorescence lifetime in this study. Further studies with improved analytical methods are required to understand the relationship of free/bound NADH and oxygen consumption. We attenuated/inhibited the oxidative metabolic activity of hMSCs during osteogenic differentiation by OA treatment. We found that mitochondrial function of hMSCs was significantly inhibited by OA treatment but that neither ATP nor oxygen consumption increased (but decreased) during 4-week osteogenic differentiation (Fig. 3). No significant change of the NADH lifetime was observed even though ALP activity showed cell differentiation activity at weeks 2, 3, and 4 (Fig. 1). Previous studies have found that MSCs were able to adapt their metabolism depending upon the availability of nutrients for the variable environment in vivo.35,36 Hsu et al.27 reported that the osteoblasts under hypoxia failed to activate mitochondrial respiration and relied extensively on glycolysis for energy supply. Similar to the hypoxia condition, the hMSCs adapted to OA treatment such that more lactate was released, indicating that differentiated cells partly remained in glycolysis under OA treatment. Since NADH fluorescence lifetime is considered to be the index of mitochondrial metabolism (i.e., oxidative phosphorylation) because the NADH fluorescence signal is mainly from mitochondria,37 a lack of significant change of the NADH fluorescence lifetime in OA-treated cells agrees with reports that NADH fluorescence lifetime is associated with oxidative phosphorylation not glycolysis. The results of respiration enzymes showed that the overall expression of most of the respiration enzymes increased as a function of differentiation of time (Fig. 5). Although studies by Blinova et al.32,38 suggested that the NADH associated with Complex I significantly contributes to the overall mitochondrial NADH fluorescence intensity, the association between the sum expression of 5 complex proteins, not Complex I, and is significant (, ) as shown in Table 1. Complex III is marginally associated with (, ). and ratio showed no significant association with any complex protein expression or the sum expression of five complex proteins. As mentioned above, the association between NADH fluorescence lifetime parameter and the sum expression of five complex proteins is possibly attributed to some bound-NADH with a shorter lifetime (). More studies are required to verify this. Nonetheless, we cannot exclude the possibility of other proteins bound to NADH during hMSC differentiation. Understanding the relationship of NADH fluorescence lifetime and metabolic pathway and activity is essential for monitoring the metabolism by measuring the NADH fluorescence lifetime. In this study, we found a positive correlation for NADH fluorescence lifetime and aerobic metabolic state in osteogenic differentiation of hMSCs. However, NADH fluorescence lifetime is not sensitive to glycolysis activity in OA-treated stem cells. These results demonstrated that NADH fluorescence lifetime is a reliable and noninvasive indicator for detecting stem cell aerobic metabolic activity (i.e., oxidative phosphorylation) to predict their differentiation potential when the differentiation pathway is transforming from glycolysis to oxidative phosphorylation. AcknowledgmentsThis work was supported by grants from the National Science Council of Taiwan (NSC101-2112-M-010-001-MY3, NSC98-2112-M-010-003-MY3, NSC102-2221-E-002-030-MY3, and NSC101-2112-M-002-003-MY3), National Health Research Institutes (NHRI-EX102-10041EI), National Taiwan University (NTU-102R7804 and CQSE-102R891401), and a project of “Aim for Top University Plan” sponsored by the Ministry of Education, Executive Yuan, Taiwan. The authors would like to express their appreciation to Dr. Chien-Tsun Chen for providing some suggestions on this works. ReferencesK. W. Johnson, M. Dooner and P. J. Quesenberry,
“Fluorescence activated cell sorting: a window on the stem cell,”
Curr. Pharm. Biotechnol., 8
(3), 133
–139
(2007). http://dx.doi.org/10.2174/138920107780906487 CPBUBP 1389-2010 Google Scholar
G. J. Dooner et al.,
“Gene expression fluctuations in murine hematopoietic stem cells with cell cycle progression,”
J. Cell. Physiol., 214
(3), 786
–795
(2008). http://dx.doi.org/10.1002/(ISSN)1097-4652 JCLLAX 0021-9541 Google Scholar
L. A. Flanagan et al.,
“Unique dielectric properties distinguish stem cells and their differentiated progeny,”
Stem Cells, 26
(3), 656
–665
(2008). http://dx.doi.org/10.1634/stemcells.2007-0810 STCEDI 1066-5099 Google Scholar
F. C. Pascut et al.,
“Noninvasive detection and imaging of molecular markers in live cardiomyocytes derived from human embryonic stem cells,”
Biophys. J., 100
(1), 251
–259
(2011). http://dx.doi.org/10.1016/j.bpj.2010.11.043 BIOJAU 0006-3495 Google Scholar
J. W. Chan et al.,
“Label-free separation of human embryonic stem cells and their cardiac derivatives using Raman spectroscopy,”
Anal. Chem., 81
(4), 1324
–1331
(2009). http://dx.doi.org/10.1021/ac801665m ANCHAM 0003-2700 Google Scholar
N. Shyh-Chang, G. Q. Daley and L. C. Cantley,
“Stem cell metabolism in tissue development and aging,”
Development, 140
(12), 2535
–2547
(2013). http://dx.doi.org/10.1242/dev.091777 68KCAI 0950-1991 Google Scholar
Y. M. Cho et al.,
“Dynamic changes in mitochondrial biogenesis and antioxidant enzymes during the spontaneous differentiation of human embryonic stem cells,”
Biochem. Biophys. Res. Commun., 348
(4), 1472
–1478
(2006). http://dx.doi.org/10.1016/j.bbrc.2006.08.020 BBRCA9 0006-291X Google Scholar
S. Chung et al.,
“Mitochondrial oxidative metabolism is required for the cardiac differentiation of stem cells,”
Nat. Clin. Pract. Cardiovasc. Med., 4
(Suppl 1), S60
–S67
(2007). http://dx.doi.org/10.1038/ncpcardio0766 NCPCC4 1743-4297 Google Scholar
C.-T. Chen et al.,
“Coordinated changes of mitochondrial biogenesis and antioxidant enzymes during osteogenic differentiation of human mesenchymal stem cells,”
Stem Cells, 26
(4), 960
–968
(2008). http://dx.doi.org/10.1634/stemcells.2007-0509 STCEDI 1066-5099 Google Scholar
G. Pattappa et al.,
“The metabolism of human mesenchymal stem cells during proliferation and differentiation,”
J. Cell. Physiol., 226
(10), 2562
–2570
(2011). http://dx.doi.org/10.1002/jcp.v226.10 JCLLAX 0021-9541 Google Scholar
B. Chance et al.,
“Intracellular oxidation-reduction states in vivo,”
Science, 137
(3529), 499
–508
(1962). http://dx.doi.org/10.1126/science.137.3529.499 SCIEAS 0036-8075 Google Scholar
H. W. Wang, Y. H. Wei and H. W. Guo,
“Reduced nicotinamide adenine dinucleotide (NADH) fluorescence for the detection of cell death,”
Anti-Cancer Agents Med. Chem., 9
(9), 1012
–1017
(2009). http://dx.doi.org/10.2174/187152009789377718 AAMCE4 1871-5206 Google Scholar
J. M. Reyes et al.,
“Metabolic changes in mesenchymal stem cells in osteogenic medium measured by autofluorescence spectroscopy,”
Stem Cells, 24
(5), 1213
–1217
(2006). http://dx.doi.org/10.1634/stemcells.2004-0324 STCEDI 1066-5099 Google Scholar
W. L. Rice, D. L. Kaplan and I. Georgakoudi,
“Two-photon microscopy for non-invasive, quantitative monitoring of stem cell differentiation,”
PloS One, 5
(4), e10075
(2010). http://dx.doi.org/10.1371/journal.pone.0010075 1932-6203 Google Scholar
J. Lakowicz, Principles of Fluorescence Spectroscopy, Kluwer Academic/Plenum Publishers, New York, Boston, Dordrecht, London, Moscow
(1999). Google Scholar
J. R. Lakowicz et al.,
“Fluorescence lifetime imaging of free and protein-bound NADH,”
Proc. Natl. Acad. Sci. U. S. A., 89
(4), 1271
–1275
(1992). http://dx.doi.org/10.1073/pnas.89.4.1271 PNASA6 0027-8424 Google Scholar
Q. R. Yu and A. A. Heikal,
“Two-photon autofluorescence dynamics imaging reveals sensitivity of intracellular NADH concentration and conformation to cell physiology at the single-cell level,”
J. Photochem. Photobiol. B, 95
(1), 46
–57
(2009). http://dx.doi.org/10.1016/j.jphotobiol.2008.12.010 JPPBEG 1011-1344 Google Scholar
Y. Wu, W. Zheng and J. Y. Qu,
“Sensing cell metabolism by time-resolved autofluorescence,”
Opt. Lett., 31
(21), 3122
–3124
(2006). http://dx.doi.org/10.1364/OL.31.003122 OPLEDP 0146-9592 Google Scholar
M. C. Skala et al.,
“In vivo multiphoton microscopy of NADH and FAD redox states, fluorescence lifetimes, and cellular morphology in precancerous epithelia,”
Proc. Natl. Acad. Sci. U. S. A., 104
(49), 19494
–19499
(2007). http://dx.doi.org/10.1073/pnas.0708425104 PNASA6 0027-8424 Google Scholar
D. Li, W. Zheng and J. Y. Qu,
“Time-resolved spectroscopic imaging reveals the fundamentals of cellular NADH fluorescence,”
Opt. Lett., 33
(20), 2365
–2367
(2008). http://dx.doi.org/10.1364/OL.33.002365 OPLEDP 0146-9592 Google Scholar
V. V. Ghukasyan and F. J. Kao,
“Monitoring cellular metabolism with fluorescence lifetime of reduced nicotinamide adenine dinucleotide,”
J. Phys. Chem. C, 113
(27), 11532
–11540
(2009). http://dx.doi.org/10.1021/jp810931u 1932-7447 Google Scholar
H. W. Guo et al.,
“Reduced nicotinamide adenine dinucleotide fluorescence lifetime separates human mesenchymal stem cells from differentiated progenies,”
J. Biomed. Opt., 13
(5), 050505
(2008). http://dx.doi.org/10.1117/1.2990752 JBOPFO 1083-3668 Google Scholar
K. Konig, A. Uchugonova and E. Gorjup,
“Multiphoton fluorescence lifetime imaging of 3D-stem cell spheroids during differentiation,”
Microsc. Res. Tech., 74
(1), 9
–17
(2011). http://dx.doi.org/10.1002/jemt.v74.1 MRTEEO 1059-910X Google Scholar
C. Stringari et al.,
“Phasor approach to fluorescence lifetime microscopy distinguishes different metabolic states of germ cells in a live tissue,”
Proc. Natl. Acad. Sci. U. S. A., 108
(33), 13582
–13587
(2011). http://dx.doi.org/10.1073/pnas.1108161108 PNASA6 0027-8424 Google Scholar
C. Stringari et al.,
“Phasor fluorescence lifetime microscopy of free and protein-bound NADH reveals neural stem cell differentiation potential,”
PloS One, 7
(11), e48014
(2012). http://dx.doi.org/10.1371/journal.pone.0048014 1932-6203 Google Scholar
C. Stringari et al.,
“Label-free separation of human embryonic stem cells and their differentiating progenies by phasor fluorescence lifetime microscopy,”
J. Biomed. Opt., 17
(4), 046012
(2012). http://dx.doi.org/10.1117/1.JBO.17.4.046012 JBOPFO 1083-3668 Google Scholar
S. H. Hsu, C. T. Chen and Y. H. Wei,
“Inhibitory effects of hypoxia on metabolic switch and osteogenic differentiation of human mesenchymal stem cells,”
Stem Cells, 31
(12), 2779
–2788
(2013). http://dx.doi.org/10.1002/stem.1441 STCEDI 1066-5099 Google Scholar
H. W. Wang et al.,
“Differentiation of apoptosis from necrosis by dynamic changes of reduced nicotinamide adenine dinucleotide fluorescence lifetime in live cells,”
J. Biomed. Opt., 13
(5), 054011
(2008). http://dx.doi.org/10.1117/1.2975831 JBOPFO 1083-3668 Google Scholar
H. W. Guo, Y. H. Wei and H. W. Wang,
“Reduced nicotinamide adenine dinucleotide fluorescence lifetime detected poly(adenosine-5’-diphosphate-ribose) polymerase-1-mediated cell death and therapeutic effect of pyruvate,”
J. Biomed. Opt., 16
(6), 068001
(2011). http://dx.doi.org/10.1117/1.3590204 JBOPFO 1083-3668 Google Scholar
M. C. Skala et al.,
“In vivo multiphoton fluorescence lifetime imaging of protein-bound and free nicotinamide adenine dinucleotide in normal and precancerous epithelia,”
J. Biomed. Opt., 12
(2), 024014
(2007). http://dx.doi.org/10.1117/1.2717503 JBOPFO 1083-3668 Google Scholar
J. S. Yu et al.,
“Increase of reduced nicotinamide adenine dinucleotide fluorescence lifetime precedes mitochondrial dysfunction in staurosporine-induced apoptosis of HeLa cells,”
J. Biomed. Opt., 16
(3), 036008
(2011). http://dx.doi.org/10.1117/1.3560513 JBOPFO 1083-3668 Google Scholar
K. Blinova et al.,
“Mitochondrial NADH fluorescence is enhanced by Complex I binding,”
Biochemistry-US, 47
(36), 9636
–9645
(2008). http://dx.doi.org/10.1021/bi800307y MIRBD9 0144-0578 Google Scholar
D. K. Bird et al.,
“Metabolic mapping of MCF10A human breast cells via multiphoton fluorescence lifetime imaging of the coenzyme NADH,”
Cancer Res., 65
(19), 8766
–8773
(2005). http://dx.doi.org/10.1158/0008-5472.CAN-04-3922 CNREA8 0008-5472 Google Scholar
H. D. Vishwasrao et al.,
“Conformational dependence of intracellular NADH on metabolic state revealed by associated fluorescence anisotropy,”
J. Biol. Chem., 280
(26), 25119
–25126
(2005). http://dx.doi.org/10.1074/jbc.M502475200 JBCHA3 0021-9258 Google Scholar
K. E. Follmar et al.,
“Effects of glutamine, glucose, and oxygen concentration on the metabolism and proliferation of rabbit adipose-derived stem cells,”
Tissue Eng., 12
(12), 3525
–3533
(2006). http://dx.doi.org/10.1089/ten.2006.12.3525 1937-3341 Google Scholar
L. A. Mylotte et al.,
“Metabolic flexibility permits mesenchymal stem cell survival in an ischemic environment,”
Stem Cells, 26
(5), 1325
–1336
(2008). http://dx.doi.org/10.1634/stemcells.2007-1072 STCEDI 1066-5099 Google Scholar
A. Mayevsky and G. G. Rogatsky,
“Mitochondrial function in vivo evaluated by NADH fluorescence: from animal models to human studies,”
Am. J. Physiol. Cell Physiol., 292
(2), C615
–C640
(2006). http://dx.doi.org/10.1152/ajpcell.00249.2006 0363-6143 Google Scholar
K. Blinova et al.,
“Distribution of mitochondrial NADH fluorescence lifetimes: steady-state kinetics of matrix NADH interactions,”
Biochemistry-US, 44
(7), 2585
–2594
(2005). http://dx.doi.org/10.1021/bi0485124 MIRBD9 0144-0578 Google Scholar
|


