|
|
1.IntroductionMalignant diseases cause thousands of deaths annually, and the number of newly registered cases of cancer grows continually throughout the world,1 particularly in Russia.2 Skin cancers, especially malignant melanoma (MM), hold a special place among world cancer statistics.3 The rate of melanomas among all skin cancers is only 9%, though melanomas cause 76% of skin cancer deaths3 despite tumor detection at an advanced stage. Early diagnosis of malignant skin tumors by a general practitioner is successful only in every second case.4 Histological tests from punch and shave biopsies are not suitable in many cases, due to the risk of metastatic growth after tumor injury, which causes a rapid increase in tumor cell activity.5 Excision biopsy is possible in melanoma treatment, but in many cases oncologists are not confident whether they are dealing with melanoma and the biopsy can result in unnecessary cosmetic injury.6 Only noninvasive instrumental methods can confirm a diagnosis.7 Currently, a number of methods are widely used in clinical practice for tumor visualization: confocal microscopy,8 computer tomography,9 optical coherence tomography (OCT),10 and magnetic resonance imaging.11 OCT stands out among these methods because it allows for the discovery of even a minute inhomogeneity in tissues, which can be useful for precise determination of the invasion area. The OCT technique is based on low-coherence interferometry; it can obtain three-dimensional (3-D) images of an examined object with micron resolution and is widely used for visualization of optical scattering media, including tissues, with a maximum depth of up to 2 mm.12 OCT has been successfully used for in vivo cancer detection in ophthalmology, gastroenterology, pulmonology, and other fields of medicine.10 In particular, OCT is a powerful tool for basal cell carcinoma (BCC) diagnosis.13 However, in cases of non-BCC skin tumors, OCT only provides information about the distribution of heterogeneities without the ability to determine the type of cancer.14 In general, the sensitivity and specificity of nonmelanoma skin-tumor-type identification by OCT do not exceed 75% to 85%.14 An improved diagnostic accuracy may be achieved by combining OCT with spectroscopy methods, including, at least, backscattering (BS)15 and Raman spectroscopy (RS).16 In BS studies, broadband light sources are used to measure the optical properties of a tissue. Conversely, RS is based on the differentiation of excited molecules’ vibrational modes in inelastic light scattering of laser radiation. RS is widely used for cancer analysis in the skin, lung, brain, and other organs, with respective sensitivities and specificities of tumor detection usually not less than 94% and 96% for breast cancer, about 95% and 90% for colon cancer, and 96% and 91% for lung cancer detection,17 as well as 100% classification accuracy for brain tumors, but only 15% to 68% specificity with 90% to 99% sensitivity for skin melanoma diagnosis.18 BS cancer diagnosis is based on the differences in the optical properties of normal and cancerous tissues,19 and has tumor detection sensitivities and specificities, respectively, of 92% and 60% for colon cancer,20 67% to 91% and 77% to 79% for breast cancer,21 98% and 86% for lung tumors,22 and an accuracy of 80% to 85% for malignant skin diseases.23 Combined RS-OCT has been successful in ophthalmology24 and gastroenterology,25,26 while its application with other tissue diagnosis remains under discussion. Skin lesion designation is possible with OCT and RS system,16 but the potential for MM, BCC, and squamous cell carcinoma (SCC) identification is still unclear. Data acquisition with OCT takes a few seconds, while RS requires tens of seconds to obtain a spectrum suitable for analysis. In order to overcome the existing difficulties, one must increase the accuracy and speed of the RS method relative to OCT. The aim of this study is to develop a rapid, highly sensitive method of tumor imaging and analysis involving the combination of OCT, RS, and BS techniques. Such a setup allows both sequential and combined application of these methods for tumor identification and analysis. BS is characterized by slightly reduced sensitivity, but much greater speed, compared with RS. Therefore, in an initial stage, BS could be useful for the qualification of tumor boundaries without type identification. Then, detailed 3-D tumor topology may be attained by OCT imaging followed with precise RS determination of cancer type. In order to increase the accuracy of tumor classification, we propose a two-step phase analysis of Raman spectra. This new method compares differences in the Raman spectra of the tumor area and surrounding healthy tissue, along with quantitative analysis of normalized Raman peak intensities in the tumor area. Another advantage of the proposed approach is the improvement and alignment of tumor determination accuracy for different types of cancers. Each method has its own probability of identification for different tumors. In particular, OCT provides high accuracy of BCC diagnosis, and BS is useful in nonpigmented melanoma classification. Thus, a combined RS-BS-OCT device may help to increase the average accuracy of diagnosis for a variety of cancers. 2.Materials and Methods2.1.Experimental SetupThe laboratory setup is presented in Fig. 1; it combines principles of OCT, RS, and BS for human tissue studies. The setup includes a thermally stabilized semiconductor diode laser module LML-785.0RB-04 ( central wavelength, 150 mW) for excitation of Raman spectra, a broadband laser diode Broadlighter D-840-HP (, 20 mW), and a Michelson interferometer () based on the fiber optic splitter FC850-40-50-APC. The reference arm consists of the collimating lens L1 (CFC-8X-B), focusing lens L2 (AC254-050-B), and adjusted mirror M1 (BB1-E03). An image capture card (PC built-in) digitizes the OCT interference pattern. Test samples were illuminated with excitation radiation via bandpass filtering, which cuts off the Raman shift of the optical-fiber laser. A backscattered spectrum was recorded after sample illumination with a broadband light source (500 to 780 nm). Backscattered radiation and the Raman signal were collected by a fiber probe, which consists of excitation ( diameter) and collection fibers ( diameter) and a collecting lens L3 (5-mm focal length). The backscattered radiation was passed through a broadband filter to cut off the probing radiation signal. A focusing lens L4 (AC508-250-B) and mirror M2 were used for radiation delivery to receiving channel. Calibration of the system was consequentially performed for OCT, RS, and BS. The overall wavelength error was determined by the produced spectrograph and do not exceed 0.01 nm. As a result, low-noise recording of RS and BS radiations was performed with a spectral resolution of 0.05 nm, using a Shamrock SR-303i spectrograph and an Andor iDus charge-coupled device digital camera. Spatial calibration of the setup was performed with high resolution micrometers and target resolution plate (RES-1). This setup achieved A-scan recordings with a maximum resolution of . Raman and backscattered spectra were acquired for a tumorous region of normal skin closely adjacent to a lesion (within 4 cm). Such an approach helps to avoid the influence of the inherent heterogeneity of skin on experimental results. A fiber probe was directly positioned over the tissue sample at a distance of 3 to 5 mm. The beam diameter of the probing radiation was 1 mm. Initially, the recorded BS spectrum was used for dividing the region of interest into healthy and abnormal tissues. The pathological area was subsequently examined by the RS method. The acquisition times were 5 s for BS and 30 s for RS analysis, which allowed for the combination of fast RS scanning with an exact RS examination of select areas on the scanning stage. Three independent measurements were made for each spatial point and then an averaged value was used to take a mean spectrum. 2.2.Tissue SamplesThere were 45 patients (17 female and 28 male, 45 Caucasian, all white, and phenotypes I and II) with skin and lung cancers enrolled in this study. Ex vivo tissue samples were obtained after surgical resection at Samara Regional Clinical Oncology Dispensary under an approved protocol including patient agreement. Tissue samples were stored in sterile boxes at and were tested using an experimental setup not later than 4 h after resection. All samples were divided into two pieces containing both a healthy tissue region and part of the tumor. One sample piece underwent experimental tests. The rest of the sample was fixed in formalin and prepared for histological analysis. The lung tumor samples were approximately in size. In total, tests were conducted on 22 ex vivo samples of lung tissue: 11 adenocarcinomas and 11 squamous cell carcinomas. In vivo experiments were performed at the Samara Regional Clinical Oncology Dispensary for 50 skin tissue samples (9 melanomas, 9 basal cell carcinoma, 1 squamous cell carcinoma, 2 pigment nevi, 2 benign tumors, and 27 healthy tissues). The skin tumor samples were approximately in size. The detailed distribution of human skin and lung lesions, including information about patients and tumor locations, is provided in Table 1. Every tumor study was accompanied by histological analysis to make a final diagnosis. The protocols of in vivo and ex vivo tissue diagnostics were approved by the ethical committee of Samara State Medical University. Table 1Summary of patients and lesions.
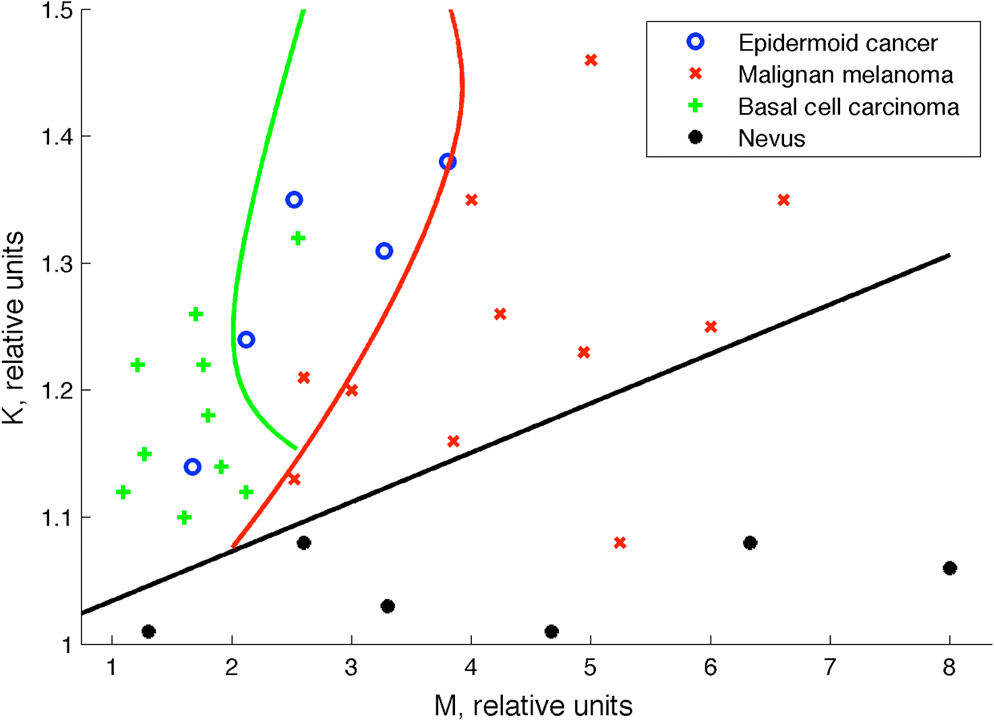
2.3.Two-Step Raman Spectroscopy MethodWe propose to use a two-step phase-type method for tumor detection and identification in RS studies. In the first step, each measurement is represented as a point on the phase plane of two characteristics, and , which are the ratios of maximum scattering intensity in the 1300 to band and the 1640 to band, to the RS intensity in the 1440 to band, respectively. Each data point on the phase plane can be attributed to a specific cancer type or a healthy tissue using histological control as a reference method. On the first step, the lung tumors (adenocarcinoma and squamous cell carcinoma) are separated from healthy tissue, and malignant melanomas-from all other skin cancers, as they are separately allocated in a finite range of the phase plane. Further differentiation of cancer types is performed in the second step, which is based on analysis of spectral intensity alteration in the tumor tissue in comparison with healthy tissue near the lesion. For this purpose, it was defined as the relative difference (relative index) between RS intensities for healthy (index ) and malignant (index ) tissues in three spectral ranges: , 1450, and . These relative indices form a distinct phase space, which may be represented by the projection of experimental data on three phase planes with relative differential parameters as plane axes: , , and . Such an approach makes possible the definition of phase space areas containing specific cancer types, and, as a result, realizes a mechanism for optical identification of exact tumor type.2.4.Data Discrimination MethodsDiscriminant analysis (DA) was used to designate tissue classes in the phase planes. DA has the ability to flexibly change priority to favor sensitivity or, on the contrary, to favor specificity. As such, the efficiency of approaches is characterized by their sensitivity and specificity and the ability to select defined classes in different volumes of phase space. The analysis of skin-tumor data allocation was performed using a quadratic discriminant analysis (QDA) classifier, which was determined to be the most effective method for allocation of classes. Hyperquadric curves separate classes in QDA. Their curvature and position depends on the variation of experimental results. The linear discriminant analysis (LDA) has lower levels of specificity, but the sensitivity remains the same. This is due to the fact that LDA successfully separates only similar classes.27 3.Experimental Results3.1.Multimodal Tissue StudyDiagnosis of tissue samples was started from OCT image capture followed by BS and RS analysis. Standard OCT image sizes were . The OCT image includes the tumor and healthy tissue areas and, as a result, contains visual information about tumor border configuration, which may be observed by medical specialists. The next step of the tissue sample analysis was the registration of BS and RS signals, which may be achieved either from a whole sample surface (pixel-by-pixel scanning) or from fixed selected regions. Regions of interest for RS and BS registrations (tumor and healthy points) may be chosen on the basis of OCT image analysis by a medical specialist. Figure 2 represents an example of RS analysis of a melanoma cross section: each point is uniformly located over the cross section and corresponds to the ratio of Raman spectral intensities , captured from an illuminated area with a diameter of 1 mm. As one can see, the spectral analysis of the whole sample is redundant for cancer type identification. It is enough to check the area in the center of the tumor (point 6 or 7 on Fig. 2) and near the boundary in healthy tissue (point 2 or 9 on Fig. 2) for cancer type determination. And boundary itself may be selected by OCT image analysis. Such an approach gives the opportunity to equalize the speed of OCT imaging and RS and BS analysis and simultaneously completes the multimodal examination of the sample. Fig. 2Raman spectroscopy (RS) analysis of melanoma for tissues spectral characteristics measurements: points 1, 2, 9, and 10 are healthy tissue, 5, 6, and 7 are tumor, 3, 4, 8—border area. 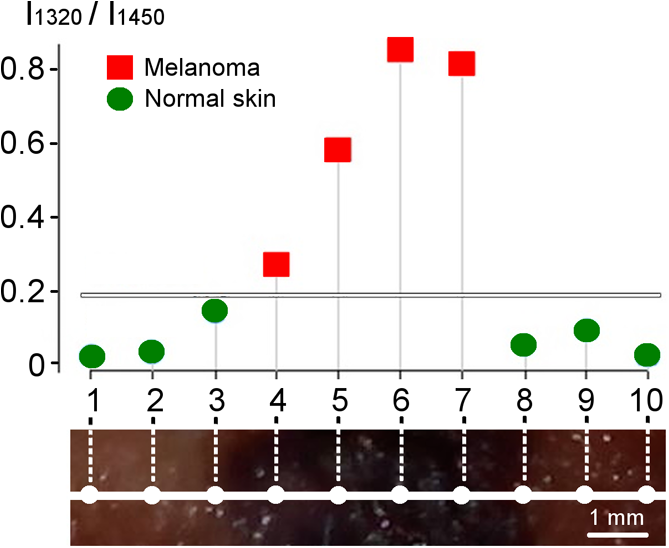 Thereby, the proposed algorithm of tissue analysis has a number of advantages. It allows one to use multispectral information from different optical methods for tumor diagnosis and reduces the time of tissue study by decreasing the number of analyzing points. Moreover, this approach makes possible step-by-step analysis that altogether can be useful in clinical applications. 3.2.Optical Coherence Tomography Skin Tissue StudyOCT resolution is 100 to 250 times higher than ultrasound or magnetic resonance imaging, and allows for the identification of very small inhomogeneities in tissue layers. However, it is very difficult to distinguish one type of tumor from another based solely on OCT-image analysis.28 In particular, in our study, only BCC was confidently differentiated by OCT among all examined skin cancer samples. This was due to the presence of a round-like area (a so called “nest”) specific to BCC. Figure 3 shows OCT images of two different types of malignant skin tumors along with their histological images. Melanoma and non-BCC tumors have their own nonspecific topology for each sample. Figure 3(b) shows a melanoma tumor with no clear borders of invasion. One can see only a number of small heterogeneities beneath the upper skin layer. Fig. 3Optical coherence tomography (OCT) images of basal cell carcinoma (BCC) (a) and malignant melanoma (MM) (b), each (arrows indicate tumorous areas in healthy skin) and corresponding histologic section of BCC (c) and MM (d), magnification.  It is clearly visible that BCC has a unique rounded topology. However, cases of BCC with a clear nest area were found only in 7 of the 9 BCC samples, and one non-BCC tumor sample also has a nest-like area. The sensitivity for BCC tumor diagnosis by OCT does not exceed 78%, according to the results of this study. Consequently, nest-like topology cannot be taken as the determining criteria for a BCC tumor, and additional spectral analysis must be performed to verify its diagnosis. The OCT study of skin tissue samples is in agreement with the results from other scientific groups (for example Ref. 29). OCT imaging may provide precise data on 3-D heterogeneities in a sample, but it is difficult to determine a cancer type with high accuracy for non-BBC tumors. Thus, a multimodal approach, with the implementation of BS and RS methods, may improve the accuracy of tumor classification. The simplicity and convenience of joint OCT-RS-BS is based on the possibility of combining radiation sources and recording units. Subsequent filtering of scattered radiation allows an operator to split the OCT signal from the BS and RS signals and process them simultaneously. Then, the spectroscopic data help to identify non-BCC tumors (melanomas and lung carcinomas) and improve sensitivity and specificity in BCC diagnosing. 3.3.Backscattering Skin Tissue StudyBS analysis allows for the rapid classification of tumors. It is well known that malignant tumors are characterized by a capillary-net expansion and an increase in the concentration of melanin.30 This concentration is proportional to the BS index , where is a BS reflectance coefficient at wavelength . The spatial distribution of capillary inhomogeneity may be estimated by recording the local rate of blood content, which is proportional to the BS index . Discriminant analysis was performed for BS data in ex vivo and in vivo experiments.31 Averaged BS sensitivity and specificity for ex vivo skin tumor classification were 84% and 90%, respectively. However, for in vivo experiments, the accuracy of BS analysis decreased and did not exceed 83%. As can be seen from Fig. 4, the phase plane may be used for discriminant analysis of skin tumor types. Here, curve 1 divides the phase plane into two areas: a region of benign tumors (below curve 1) and a region of malignant tumors of different types (above curve 1). Curves 2 and 3 divide the malignant tumor region into several sections, corresponding to tumors of definite types. The maximum values for sensitivity and specificity (86% and 96%, respectively) were obtained for nevus diagnosis. Melanoma diagnosis was characterized by a minimal sensitivity of 82%. BS analysis may be used for determining tumor borders based on a combined coefficient , which simultaneously takes into account changes in melanin levels and the concentration of blood in the tumor volume, as well as the individual characteristics of the skin. The distribution of the combined factor on the skin surface allows for the designation of a threshold value (typical for healthy skin), which in turn permits a determination of tumor border area with 1-mm accuracy. 3.4.Combined Optical Coherence Tomography: Raman Spectroscopy Study of Lung and Skin TissuesThe multimodal OCT and RS unit acquires a high-resolution 3-D image of the examined objects. This allows one to determine the topology of every layer and find an invasion area in healthy tissue. Figure 5 shows an example of these measurements for bronchus tissue. It is easy to find a pathological area in lung and bronchus tissue, since the tumor has clear boundaries. However, we did not find any spatial regularity in the OCT images that would help to differentiate squamous cell carcinomas from adenocarcinomas. This result is in agreement with Ref. 32. Therefore, in lung studies, OCT should be primarily used as an imaging tool for tumor area determination. Fig. 5Bronchus sample with marks for RS study: (a) OCT image (), (b) digital image (); 1—normal tissue, 2—tumor.  The next step is to perform RS evaluation of the tissue in the visualized pathologic area (ignoring the border area). Most known methods of Raman spectral analysis of tumors are based on the definition of threshold criteria for peak intensities in the following Raman bands: 1300 to , 1640 to , and 1440 to . However, the variation in threshold values is quite large. We propose to use the alternative method of two-step Raman analysis described in Sec. 2.3. This method involves patient healthy tissue characteristics, and thus it is more patient-oriented. For the lung study, such a RS two-step phase analysis is presented in Fig. 6. The intensities and form the phase plane shown in Fig. 6(a), which separates healthy tissue from tumors with high sensitivity and specificity (81% and 84%, respectively). However, the precise determination of tumor type remains nearly impossible (adenocarcinomas and squamous cell carcinomas are mixed in the upper part of the phase plane). In order to resolve different cancer types, the second step in the RS comparison must be used, as shown in Fig. 6(b) for the bands 1450 and . Quadratic discriminant analysis was used to separate clusters in the phase plane. Thus, by using the two-step phase analysis, one may increase the accuracy of tumor classification. The two-step method sensitivity and specificity of lung tumor classification are 100% and 82% for adenocarcinoma and 91% and 78% for SCC, respectively. Fig. 6Tumor and healthy tissue ex vivo determination for lung and bronchus by two-step phase analysis of Raman spectroscopy (RS) method: (a) first step of RS method, (b) second step of RS method.  In vivo experiments with skin tumors and normal skin tissue were carried out for evaluation of the two-step method accuracy. Figure 7(a) illustrates the first step of the RS method and Fig. 7(b) shows the datasets obtained in the second step of RS quadratic discriminant analysis. In the first step [Fig. 7(a)], melanomas were separated from all other cancer types or healthy skin, with a sensitivity of 78%. The second step [Fig. 7(b)] allows for the identification of additional melanomas that were not detected in the first step. Therefore, overall, a sensitivity of melanoma detection equal to 89% with specificity 88% was achieved. However, the proposed two-step method demonstrates insufficient sensitivity (89%) and specificity (85%) for BCC diagnosis. The two-step method also has an exception for nonpigmented melanoma, which is characterized by a low melanin content and, as a result, produces a weak RS intensity in the 1300 to band. 4.Discussion and ConclusionsExperimental results for statistical calculations are collected in Table 2, where TP denotes true positive, FP denotes false positive, TN denotes true negative, and FN denotes false negative test results. In a two-step phase Raman analysis, TP and TN are test results where tumors and healthy tissues were correctly determined (in comparison with histology) on both of the two-phase planes. FN refers to tumors that appear in phase volumes of normal tissue or other tumor types appearing in the second stage of phase analysis. FPs are the cases where tumors appear in different phase areas in both steps. The RS-OCT analysis may be virtually divided into two stages. In the first stage, tumors were classified by the RS method, and the OCT method was then applied to check samples with FN results for nest-like-area markers. The method incorporating BS combined RS, BS, and OCT to find MM and BCC tumors for samples with FN test results. Table 2Statistical results for sensitivity and specificity calculation.
It is clearly apparent from Table 2 that the two-step RS method can be successfully used for lung tumors, but its accuracy decreases by approximately 10% for skin tumors. At the same time, OCT gives satisfactory results for BCC, as does BS for MM detection. Thus, an effective increase in accuracy may be achieved by combining spectral and OCT techniques. Total sensitivity and specificity for in vivo skin tumor diagnosis with different techniques are presented in Table 3. The combination of OCT with either of the spectroscopy techniques improves the sensitivity of BCC detection, but does not improve the sensitivity for non-BCC tumor diagnosis. For example, the specificity of RS-OCT melanoma detection does not increase compared with the RS method. The sensitivity of BCC diagnosis by RS-BS-OCT increases by 11% compared with RS-OCT, with no change in specificity. Conversely, the specificity of MM diagnosis by combined RS-BS-OCT increases by 5% compared with RS-OCT, while sensitivity does not change. Table 3Sensitivity and specificity of skin cancer diagnosis.
The multimodal method combining OCT imaging with RS and BS analysis has many advantages, as these methods are complementary and increase the diagnostic specificity for a variety of tumor types. For example, the relatively low specificity of RS detection of non-BCC tumors may be improved by incorporating the BS method. Moreover, the BS method is characterized by lower sensitivity of melanoma determination compared with the RS method, making the combined approach more appealing. The proposed two-step RS phase analysis with OCT visualization shows high efficiency for skin tumor diagnosis. In vivo experiments confirmed that the sensitivity and specificity for RS detection of melanoma are 89% and 88%, respectively. BCC diagnosis accuracy may also be improved by OCT image analysis. A further increase in accuracy can then be achieved by additional BS data analysis. In general, the multimodal RS-BS-OCT method is characterized by an 89% to 100% sensitivity and 93 to 96% specificity for skin tumor diagnosis. It should be noted that each method has a different data processing rate: from milliseconds for BS up to 1 min for RS. This offers a multilevel mechanism for data processing. As the BS method has the highest speed, it may be used for rapid two-dimensional scanning with a rough (about 1 mm) selection of tumor boundaries. Further, 3-D analysis of suspicious areas using slower OCT technology helps to exactly define pathological borders. Then, the most accurate method, RS, may be used for tumor classification solely in the central area of a selected tumor. Such an approach equalizes the processing rates for all methods and provides tumor imaging with the simultaneous determination of tumor type. For skin diseases, a high efficiency has been clearly established for the multimodal system combining the principles of OCT, RS, and BS. Though the independent application of each method is insufficient for precise classification of skin tumors, their union has a cumulative effect. However, the application of such a system for lung analysis seems unnecessary, as RS-OCT already gives enough data for the identification of a tumor’s morphological structure and type. However, BS implementation does not greatly complicate the design of the system due to the ease of integrating its requisite elements, in particular the spectrometer. This fact promises that such a system may be successfully implemented in oncological applications for the identification of different cancer types, but it will require studies over a broader range of tissue types to more clearly demonstrate the viability of combined RS-BS-OCT systems. AcknowledgmentsThis research was supported by the Ministry of Education and Science of the Russian Federation and by RFBR, research Project No. 14-07-31292 mol_a. ReferencesCancer Facts & Figures 2013, American Cancer Society, Atlanta
(2013). Google Scholar
I. V. Chissov, Malignant Tumors in Russia (Morbidity and Mortality), Russia Ministry of health, Moscow
(2013). Google Scholar
P. Boyle, World Cancer Report 2008 Lyon
(2008). Google Scholar
M. BakhaiD. HopsterR. Wakeel,
“A retrospective study comparing the accuracy of prehistology diagnosis and surgical excision of malignant melanomas by general practitioners and hospital specialists,”
Clin. Exp. Dermatol., 35
(1), 63
–67
(2010). http://dx.doi.org/10.1111/ced.2009.35.issue-1 CEDEDE 1365-2230 Google Scholar
N. A. Swansonet al.,
“Biopsy techniques: diagnosis of melanoma,”
Dermatol. Clin., 20 677
–680
(2002). http://dx.doi.org/10.1016/S0733-8635(02)00025-6 DERAEG 1018-8665 Google Scholar
S. TadiparthiS. PanchaniA. Iqbal,
“Biopsy for malignant melanoma—are we following the guidelines?,”
Ann. R. Coll. Surg. Engl., 90 322
–325
(2008). http://dx.doi.org/10.1308/003588408X285856 ARCSAF 0035-8843 Google Scholar
C. Herman,
“Emerging technologies for the detection of melanoma: achieving better outcomes,”
Clin. Cosmet. Investig. Dermatol., 5 195
–212
(2012). http://dx.doi.org/10.2147/CCID 1178-7015 Google Scholar
K. J. Busamet al.,
“Halpern morphologic features of melanocytes, pigmented keratinocytes and melanophages by in vivo confocal scanning laser microscopy,”
Mod. Pathol., 14
(9), 862
–868
(2001). http://dx.doi.org/10.1038/modpathol.3880402 MODPEO 0893-3952 Google Scholar
C. Majoieet al.,
“Perineural tumor extension of facial malignant melanoma: CT and MRI,”
J. Comput. Assist. Tomo., 15
(4), 570
–574
(1991). http://dx.doi.org/10.1097/00004728-199107000-00008 JCATD5 0363-8715 Google Scholar
B. J. Vakocet al.,
“Cancer imaging by optical coherence tomography: preclinical progress and clinical potential,”
Nat. Rev. Cancer, 12 363
–368
(2012). http://dx.doi.org/10.1038/nrc3235 NRCAC4 1474-175X Google Scholar
I. Bjørnæset al.,
“Intratumor heterogeneity in perfusion in human melanomaxenografts measured by contrast-enhanced magnetic resonance imaging,”
Magn. Reson. Imaging, 18
(8), 997
–1002
(2000). http://dx.doi.org/10.1016/S0730-725X(00)00188-0 MRIMDQ 0730-725X Google Scholar
A. F. Fercheret al.,
“Optical coherence tomography—principles and applications,”
Rep. Prog. Phys., 66 239
–303
(2003). http://dx.doi.org/10.1088/0034-4885/66/2/204 RPPHAG 0034-4885 Google Scholar
M. Mogensenet al.,
“In vivo thickness measurement of basal cell carcinoma and actinic keratosis with optical coherence tomography and 20-MHz ultrasound,”
Brit. J. Dermatol., 160
(5), 1026
–1033
(2009). http://dx.doi.org/10.1111/bjd.2009.160.issue-5 BJDEAZ 1365-2133 Google Scholar
M. Mogensenet al.,
“Optical coherence tomography for imaging of skin and skin diseases,”
Semin. Cutan. Med. Surg., 28 196
–202
(2009). http://dx.doi.org/10.1016/j.sder.2009.07.002 SCMSFR 1085-5629 Google Scholar
V. Kondaet al.,
“Enhanced imaging in the GI tract: spectroscopy and optical coherence tomography,”
Gastrointest. Endoscopy., 78
(4), 568
–573
(2013). http://dx.doi.org/10.1016/j.gie.2013.07.024 GAENBQ 0016-5107 Google Scholar
C. A. Patilet al.,
“A clinical instrument for combined Raman spectroscopy-optical coherence tomography of skin cancers,”
Lasers Surg. Med., 43
(2), 143
–151
(2011). http://dx.doi.org/10.1002/lsm.v43.2 LSMEDI 0196-8092 Google Scholar
M. B. Fennet al.,
“Raman spectroscopy for clinical oncology,”
Adv. Opt. Technol., 2011 213783
(2011). http://dx.doi.org/10.1155/2011/213783 1687-6393 Google Scholar
H. Luiet al.,
“Real-time Raman spectroscopy for in vivo skin cancer diagnosis,”
Cancer Res., 72
(10), 2491
–2500
(2012). http://dx.doi.org/10.1158/0008-5472.CAN-11-4061 CNREA8 0008-5472 Google Scholar
J. R. MourantA. H. HielscherA. A. Eick,
“Evidence of intrinsic differences in the light scattering properties of tumorigenic and nontumorigenic cells,”
Cancer, 84 366
–374
(1998). http://dx.doi.org/10.1002/(ISSN)1097-0142 60IXAH 0008-543X Google Scholar
L. B. Lovatet al.,
“Elastic scattering spectroscopy accurately detects high grade dysplasia and cancer in Barrett’s oesophagus,”
Gut., 55 1078
–1083
(2006). http://dx.doi.org/10.1136/gut.2005.081497 GUTTAK 0017-5749 Google Scholar
I. J. Bigioet al.,
“Diagnosis of breast cancer using elastic-scattering spectroscopy: preliminary clinical results,”
J. Biomed. Opt., 5
(2), 221
–228
(2000). http://dx.doi.org/10.1117/1.429990 JBOPFO 1083-3668 Google Scholar
W. J. Spliethoffet al.,
“Improved identification of peripheral lung tumors by using diffuse reflectance and fluorescence spectroscopy,”
Lung Cancer, 80 165
–171
(2013). http://dx.doi.org/10.1016/j.lungcan.2013.01.016 69TAEY 0169-5002 Google Scholar
T. Upileaet al.,
“Elastic scattering spectroscopy in assessing skin lesions: An “in vivo” study,”
Photodiagn. Photodyn., 9
(2), 132
–141
(2012). http://dx.doi.org/10.1016/j.pdpdt.2011.12.003 PPTHBF 1572-1000 Google Scholar
C. Wanget al.,
“Near infrared spectroscopy in optical coherence tomography,”
J. Near Infrared Spectrosc., 20 237
–247
(2012). http://dx.doi.org/10.1255/jnirs.975 JNISEI 0967-0335 Google Scholar
P. C. Ashoket al.,
“Multi-modal approach using Raman spectroscopy and optical coherence tomography for the discrimination of colonic adenocarcinoma from normal colon,”
Biomed. Opt. Exp., 4
(10), 2179
–2186
(2013). http://dx.doi.org/10.1364/BOE.4.002179 BOEICL 2156-7085 Google Scholar
M. S. Bergholtet al.,
“Raman Endoscopy for objective diagnosis of early cancer in the gastrointestinal system,”
J. Gastroint. Dig. Syst.,
(2013). http://dx.doi.org/10.4172/2161-069X.S1-008 Google Scholar
R. O. DudaP. E. HartD. G. Stork, Pattern Classification, 2nd ed.Wiley(2001). Google Scholar
R. Wesselset al.,
“Optical biopsy of epithelial cancers by optical coherence tomography (OCT),”
Lasers Med. Sci., 29
(3), 1297
–1305
(2014). http://dx.doi.org/10.1007/s10103-013-1291-8 LMSCEZ 1435-604X Google Scholar
A. Forseaet al.,
“Clinical application of optical coherence tomography for the imaging of non-melanocytic cutaneous tumors: a pilot multi-modal study,”
J. Med. Life, 3
(4), 381
–389
(2010). Google Scholar
I. Diebeleet al.,
“Clinical evaluation of melanomas and common nevi by spectral imaging,”
Biomed. Opt. Express, 3
(3), 467
–472
(2012). http://dx.doi.org/10.1364/BOE.3.000467 BOEICL 2156-7085 Google Scholar
V. P. Zakharovet al.,
“Backscattering spectrometry for diagnostics of skin neoplasms,”
Proc. Samara Scientific Center, 6
(15), 126
–130
(2013). Google Scholar
R. Houet al.,
“Recent advances in optical coherence tomography for the diagnoses of lung disorders,”
Expert Rev. Respir. Med., 5
(5), 711
–724
(2011). http://dx.doi.org/10.1586/ers.11.59 ERRMBF 1747-6348 Google Scholar
BiographyValery P. Zakharov received his PhD (1984) in theoretical physics from Bogolyubov Institute for Theoretical Physics, Kiev, Ukraine, and his DSc (1999) in optics from Samara State Aerospace University, Samara, Russia. Currently, he is a professor and holds the Laser and Biotechnical Systems Chair. He is a head of the Research Laboratory of Photonics at Samara State Aerospace University. His research interests include biophotonics, biomedical optics, spectroscopy, laser physics and techniques, medical lasers. Ivan A. Bratchenko graduated from Samara State Aerospace University (SSAU) in 2009 with a PhD and is an assistant professor in the Radioengineering Department of Samara State Aerospace University, and a collaborator of the photonics laboratory. His research interests include optics, biophotonics, spectroscopy, and mathematical modeling. Dmitry N. Artemyev is a postgraduate student of the Laser and Biotechnical Systems Department of Samara State Aerospace University. He graduated the faculty of Information Science of Samara State Aerospace University in June 2013. He has a master’s degree in applied mathematics and physics. His research interests include spectroscopy, Raman spectroscopy, optical methods for diagnosis, and biophotonics. Oleg O. Myakinin received his bachelor’s and master’s degrees of applied mathematics and informatics from Samara State Aerospace University in 2009 and 2011. He is a postgraduate student in the Lasers and Biotechnical Systems Department. His research interests include computer vision, interferometry, and biomedical image processing. Dmitry V. Kornilin graduated from Samara State Aerospace University (SSAU) in 2005 with a PhD and works at S.P. Korolyov Samara State Aerospace University, Radioengineering Department as a lecturer. He is also a collaborator of the photonics laboratory. His research interests include radio-diagnostic techniques for disperse systems, optical coherence tomography (OCT) and Raman systems, and information-measuring systems for embedded applications. |
||||||||||||||||||||||||||||||||||||||||||||||||||||||||||||||||||||||||||||||||||||||||||||||||||||||||||||||||||||||||||||||||||||||||||||||||||||||||||||||||||||||||||||||||||||||||||||||||||||||||||||||||||||||||||||||||||||||||||||