
|
|
1.IntroductionMedical applications inspire an increasing interest in exploiting tissue autofluorescence and sensitized fluorescence for noninvasive clinical diagnosis and research.1,2 Fluorescent molecules (fluorophores) can be used as “labels” to tag and visualize specific biomolecules of interest, or the fluorescence properties of endogenous fluorophores are exploited to create image contrast in label-free imaging. Optical tissue imaging using an intrinsic fluorescence contrast has made significant steps toward integration into clinical applications in recent decades. Distinctions in fluorescence properties of biological tissues allow the noninvasive characterization of the physiological state of a biological system and the detection of primary morphological or cytological derivations; for instance, microscopic malignancies and preserving surrounding normal (healthy) tissues. Various fluorescence imaging strategies that had often been developed for microscopy applications were then translated to preclinical optical imaging techniques.3–5 Thus, different species of fluorophores present in tissues can be characterized not only according to their excitation and emission spectra and quantum efficiency, but also by fluorescence lifetime. Spectrally resolved imaging of tissue autofluorescence is relatively well established,6 and fluorescence lifetime imaging microscopy (FLIM) is now being actively studied as a means of obtaining or enhancing an autofluorescence-based contrast in tissues.3,7–11 To date, investigations of tissue autofluorescence by means of lifetime spectroscopy have been based on single point measurements showing the potential of lifetime as a useful contrast parameter.1,6,12,13 FLIM measurements of label-free tissue autofluorescence have just begun and primary results are very promising.3–5,8,14,15 Since the measured characteristics of fluorescence decay reflect the differences in the exited state relaxation dynamics of distinct fluorescent molecules, the time-resolved measurements provide an ability to resolve overlapping fluorescence spectra of such fluorophores.16 Thus, by adding one or more dimensions provided by spectrally resolved and time-resolved fluorescence detection methods, it is possible to improve the specificity of the fluorescence measurement and to achieve higher contrast (higher information content) for diagnostic imaging.7 Fluorescence detection of numerous fluorophores in tissues generally yields fluorescence lifetimes in the range of 100 ps to 20 ns,6,13 although the majority of fluorophores are either present in miniscule quantities or have low quantum yields.12 Porphyrins, which emit a strong red fluorescence, form one of the important groups of endogenous fluorophores.17 The most important among them is protoporphyrin IX (PpIX), the presence of which has long been recognized as a useful diagnostic indication for detection of malignancies.18 In the case of rheumatoid arthritis (RA), a chronic inflammatory disease of the joints, inflamed synovium exhibits many features typical for neoplastic tissue, so there have been numerous attempts to employ endogenous porphyrins for diagnostic and therapeutic purposes in rheumatology as well.19–25 One possible strategy for improving the accumulation of endogenous photosensitizer PpIX in the target tissues involves the application of 5-aminolevulinic acid (ALA) or its ester derivatives. Our previous studies showed that not only the inflamed synovium of RA, but also the cartilage which has to be protected during PDT, tend to accumulate significant amounts of PpIX after ALA or ALA methyl ester (ALA-Me) application.23,24 Since photodamage occurs in the vicinity of the sensitizer,26 the detection of the intratissue distribution of sensitizers is very important for the prediction of an adverse PDT effect on tissues. However, spectroscopic studies in vivo did not reveal whether the cartilage tissue itself has the ability to induce PpIX from prosensitizers, or just to gather it from the surrounding tissues. The present study combines several fluorescence detection methods to study the localization of endogenous porphyrins in the sensitized tissues and to distinguish structural features of the synovium and cartilage tissues. Specimens of synovium and cartilage tissues of healthy rabbits and rabbits with antigen-induced monoarthritis were investigated by means of fluorescence spectroscopy, fluorescence intensity, and lifetime microscopy. The fluorescence lifetime of endogenous PpIX has been assessed and employed for the visualization of sensitized tissues. The structural features observed in specimens were validated by applying the histopathological imaging based on conventional rapid hematoxylin–eosin (H&E) staining. 2.Materials and Methods2.1.Preparation of SpecimensClinically healthy adult (about 3 kg body weight) male gray chinchilla rabbits () were kept under standard housing conditions. Arthritis was induced in the right knee of the animals () by applying an antigen following the procedures described in Ref. 23. Based on the clinical signs of the joint swelling, treatment with methyl 5-aminolevulinate hydrochloride (ALA-Me) (Fluka Chemie GmbH, Germany) was performed not earlier than 3 days after the injection of ovalbumin. ALA-Me was dissolved in a sterile saline (, , i.e., ) and 1 ml of the solution was injected intra-articularly into the inflamed knee. After in vivo spectroscopic measurements,24 one rabbit treated with ALA-Me and one control rabbit from the group of healthy untreated rabbits () were selected for the visualization study of sensitized and control tissues. The rabbits were euthanized with the intravenously administered thiopental () (Biochemie GmbH, Vienna, Austria). Ten specimens were prepared from both the synovium and cartilage tissues of each rabbit. The study was approved by the Lithuanian Laboratory Animal Use Ethical Committee under the State Food and Veterinary Service (No. 0218). The microscopy and spectroscopy of endogenously produced porphyrins were performed ex vivo by measuring the fluorescence spectra of the synovium and cartilage specimens taken from healthy and inflamed rabbit knee joints. Specimens of the inflamed joint were taken 3 h after intra-articular injection of ALA-Me. Then control and sensitized specimens were immediately frozen with a spray, Solidofix®-Cryo (Carl Roth GmbH + Co. KG). Frozen tissues were microsectioned with a cryotome Leica CM1100 (Leica Biosystems, Germany). Frozen sections of thick were collected on glass-slides Histobond®+ (Carl Roth GmbH + Co. KG) and air-dried at room temperature. The same thick cryostat sections were studied by means of fluorescence intensity and lifetime microscopy as well as spectroscopy techniques. Later, the morphological structures of those samples were distinguished by express staining with hematoxylin 2 and eosin (Fisher Scientific, United Kingdom). 2.2.Fluorescence DetectionTissue specimens were imaged by means of a confocal fluorescence microscope “Eclipse TE2000” (Nikon, Japan), with a confocal scanning C1si system performing sequential scanning with a beam of a CW diode laser (405 nm) (56RCS/S2780, Melles Griot), using a objective Plan Apo, NA 0.95 (Fig. 1). The three-channel RGB detector (bandpass filters: 433 to 467 nm, 500 to 590 nm, and 621 to 755 nm for blue (B), green (G), and red (R) channels, respectively) was used for fluorescence detection. Image processing was done using the software “Nikon EZ-C1 Bronze v.3.80” and “ImageJ 1.43.” A pulsed diode laser emitting at 405 nm (LDH-P-C-405B, average power 1.6 mW, controlled by a driver PDL 800-B, PicoQuant GmbH, Germany) was coupled to the microscope to measure the lifetimes of tissue autofluorescence and sensitized tissue fluorescence. The pulse repetition rate was set to 20 MHz (pulse energy 80 pJ), which allowed using a measurement time interval of 50 ns. FLIM imaging was performed using a time-correlated single photon counting (TCSPC) module PicoHarp 300, and 3200 channels of a detector were used to register a fluorescence decay curve. A single channel single photon avalanche diode (SPAD) detection unit was used for photon counting at - or spectral ranges (FWHM) by changing filters. Each fast FLIM image representing the average fluorescence lifetimes was obtained by collecting 1000 counts at the peak value, and the image resolution was set at (the typical acquisition time for healthy tissues , for sensitized tissues ). The different colors of each pixel in the fast FLIM images denote the different average lifetimes and the mean arrival time of fluorescence photons after the excitation pulse. The intensity of each pixel is proportional to the overall fluorescence intensity. The fluorescence decay curve, representing data from all image pixels, was fitted with a three-exponential decay function to obtain characteristic fluorescence lifetime values for the image. A three-exponential decay function provided a superior fit with smaller weighted residuals and a close to unity in comparison with a biexponential decay function. A three-exponential reconvolution fit was performed on each pixel using the obtained fluorescence lifetimes to calculate the FLIM images by means of the software SymPhoTime v.5.2 (PicoQuant GmbH, Berlin, Germany). FLIM images are displayed in three colors representing three calculated fluorescence lifetimes. The brightness of each color corresponds to the amplitude of the calculated lifetime. The instrument response function (IRF) was measured using a dye, erythrozine B.27 A spectrometer QE65000 (Ocean Optics Inc.) was connected to the confocal scanning C1si system of the microscope to measure the integral fluorescence spectra using certain integration times during the sequential scanning of samples with a 405 nm beam of the CW diode laser. The light emitted from the tissue was collected through a 500 nm long-pass filter (“ЖC 18,” LOMO, Russia) and directed to the tip of a fiber connected directly to the spectrometer. 3.Results3.1.Healthy CartilageFluorescence intensity microscopy and lifetime microscopy images together with a corresponding histological image of the cartilage specimen from a healthy rabbit are presented in Fig. 2. The highest registered autofluorescence intensity of healthy cartilage was detected in the green/orange spectral region (520 to 590 nm) which falls into a green channel of the microscope, and no fluorescence was registered in the red spectral region (621 to 755 nm) [Fig. 2(a)]. Based on the histological image [Fig. 2(b)], the tissue was defined as a healthy transitional layer of articular cartilage. Dark spots seen throughout the histological image are cells’ (namely chondrocytes) nuclei, and the light pink area is the extracellular matrix. The brighter green spots seen in the fluorescence image clearly correspond to the dark spots seen throughout the histological image [Fig. 2(b)]. Fast FLIM imaging [Fig. 2(c)] revealed that the average lifetimes of intrinsic fluorophores of the healthy cartilage were limited between 5 and 10 ns [Fig. 2(d), curve I]. The cells of a healthy cartilage had shorter average lifetimes than extracellular matrix. Since a fast FLIM technique allows one to gate average lifetimes, a combined fast FLIM image has been split into several pictures depicting average fluorescence lifetime values in shorter intervals. As is seen in the gated images [Figs. 2(e) and 2(f)], the specific structures distinguishable in tissue specimens at average lifetimes between 5 and 6.5 ns [Fig. 2(e)] correspond to cells, while the structures seen at lifetimes between 6.5 and 10 ns [Fig. 2(f)] can be attributed to extracellular matrix when their locations are compared with the histological image. Fig. 2Images of the specimens of healthy rabbit cartilage: (a) a fluorescence image taken combining G and R channels; (b) a H&E stained histological image; (c) a fast fluorescence lifetime imaging microscopy (FLIM) image in spectral range; (d) normalized distribution of average fluorescence lifetimes of healthy cartilage in spectral range (curve I) as well as sensitized cartilage in (curve II) and (curve III) spectral ranges, time gates: yellow—3 to 5 ns, blue—5 to 6.5 ns, green—6.5 to 10 ns, and red—10 to 15 ns; (e), (f) time-gated fluorescence lifetime images (gates are shown on pictures). Total magnification . 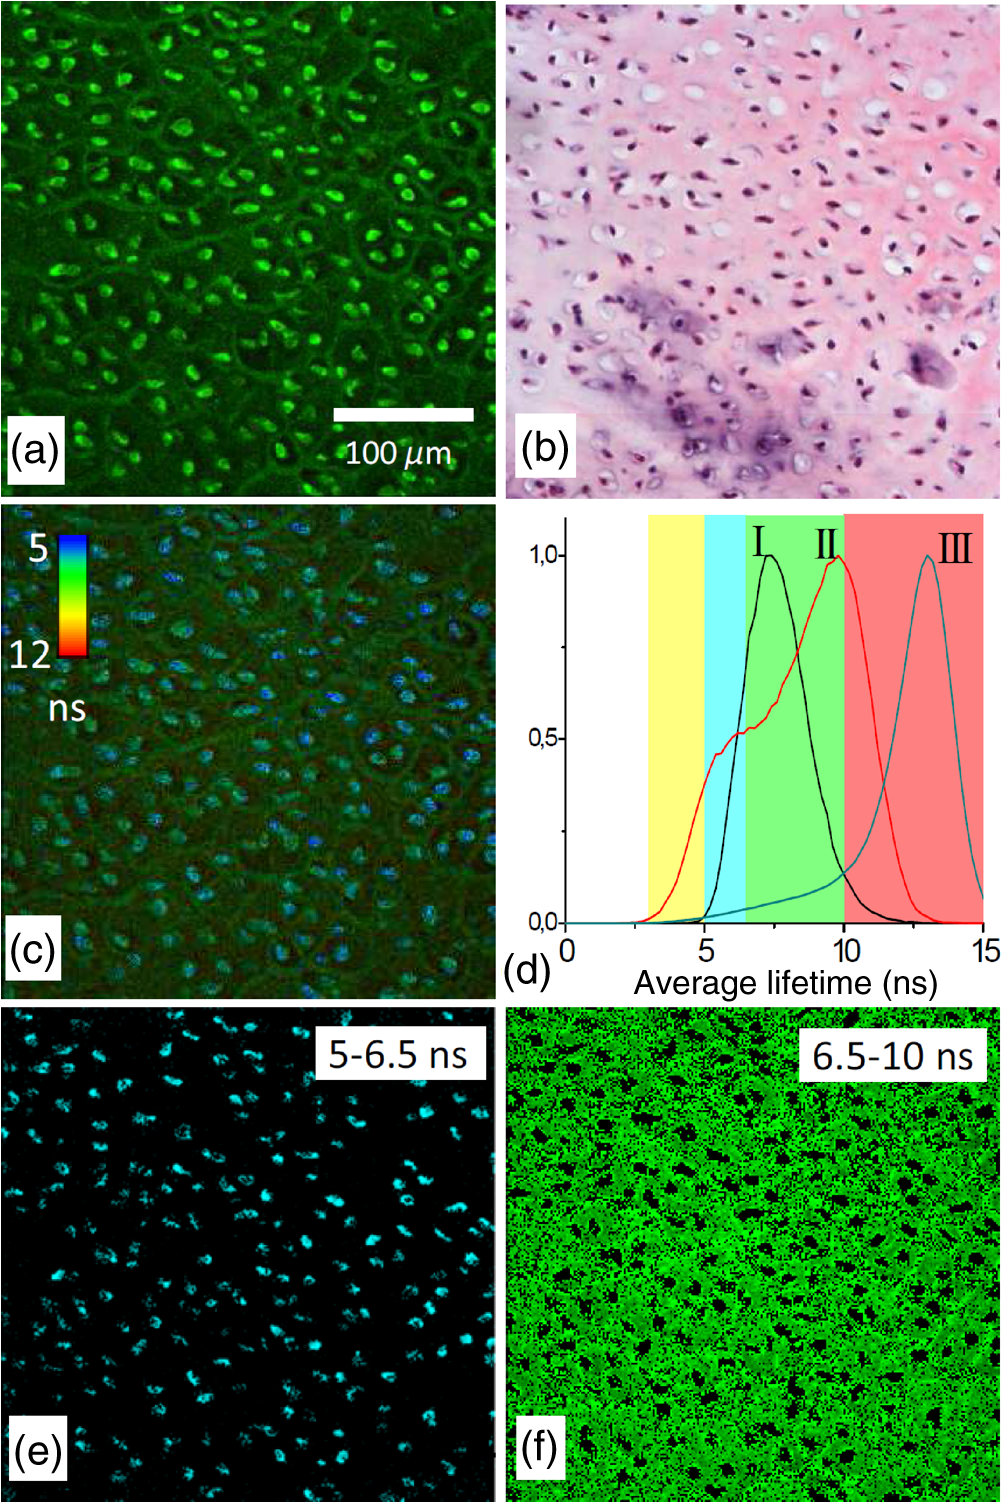 3.2.Sensitized CartilageTypical fluorescence spectra registered ex vivo on the healthy and sensitized inflamed cartilage specimens taken postmortem are presented in Fig. 3(a). Contrary to the spectra of the healthy rabbit specimens, the highest fluorescence intensity of sensitized cartilage was detected in the red spectral region, which falls into the range of the red channel of the microscope (620 to 700 nm). Two distinct bands in the fluorescence spectra clearly indicated the presence of endogenous porphyrins. It is well known that the typical fluorescence spectrum of PpIX in tissue possesses a dominant fluorescence peak at 635 nm with a second peak around 700 nm.28,29 The microscopic fluorescence imaging of the sensitized cartilage [Fig. 3(b)] revealed, however, only weak fluorescence in the red channel. This fluorescence pattern corresponds very well with the intratissue location of the cells identified from the histological image [Fig. 3(c)]. Besides the dark spots seen throughout the histological image that are cell nuclei, and the light pink area resembling the extracellular matrix as in the control cartilage, a tangential zone of the cartilage with flattened chondrocytes is seen in the top of the image. Below it lies a transitional cartilage zone, while a calcified cartilage and a subchondral bone (dark area) are present in the bottom of the sample. No damage of cartilage is seen in the histological image. Fig. 3Images of the sensitized cartilage specimen: (a) normalized fluorescence spectra of healthy and sensitized cartilage, color areas represent the spectral ranges of fluorescence microscope “green” (G) and “red” (R) channels; (b) a fluorescence image taken combining G and R channels; (c) H&E stained histological image; (d) a fast FLIM image in spectral range; (e)–(h) time-gated fluorescence lifetime images (lifetimes gates shown on pictures). Total magnification .  Figure 3(d) represents a fast FLIM image of sensitized inflamed cartilage, which is completely different from a healthy cartilage image with regard to emerged shorter and longer average lifetimes. The distribution of average lifetimes of fluorophores in the sensitized cartilage in a 650/160-nm spectral range was limited between 3 and 13 ns [Fig. 2(d), curve II]. The gating of fast FLIM images [Figs. 3(e)–(h)] revealed that the shortest lifetimes in the range of 3 to 5 ns belong to the fluorescing subchondral bone structure [Fig. 3(e)]. The pattern of the extracellular matrix [Fig. 3(g)] can be distinguished at the same average lifetimes as in the healthy cartilage—between 6.5 and 10 ns [Fig. 2(f)]. However, contrary to the gated image of healthy cartilage, lifetimes between 5 and 6.5 ns cannot be attributed to the pattern of cells, but to a dim pattern of calcified cartilage. Instead, the cells of the sensitized cartilage can be distinguished in the image gated at the longest fluorescence lifetimes—10 to 15 ns [Fig. 3(h)], and this pattern corresponds to the location of cells in a histological image [Fig. 3(c)] as well as with a red fluorescence pattern in a fluorescence image [Fig. 3(b)]. The fluorescence spectra of sensitized cartilage [Fig. 3(a)] imply that the longest fluorescence lifetimes in the spectral range are determined by endogenously synthesized PpIX, which accumulates in cells. To assure that the longest average fluorescence lifetimes registered in specimens of the sensitized cartilage do belong to PpIX, the fast FLIM imaging of the same sample has been repeated in a narrow spectral range— [Fig. 4(b)]. At this spectral range, the highest fluorescence intensity originates from PpIX, while the autofluorescence of cartilage is weak [Fig. 4(a)]. The distribution of measured average fluorescence lifetimes in the sensitized cartilage was limited between 10 and 16 ns [Fig. 2(d), curve III], including even longer lifetime values than those observed at the broader spectral range. Gating of fast FLIM images at the longest fluorescence lifetimes (10 to 15 ns), revealed the same pattern of intracellular fluorescence in both broad and narrow spectral ranges [Figs. 3(h) and 4(c)]. Fig. 4(a) A fluorescence spectrum of sensitized cartilage, colored areas represent the spectral ranges of FLIM: green— and red—; (b) a fast FLIM image in spectral range; (c) a gated fluorescence lifetime image of sensitized cartilage in spectral range; (d) an FLIM image: green color— (relative intensity —3%), blue color— (—13%), and red color— (—84%). Total magnification .  The fitting of the measured average fluorescence decay curves with a three-exponential decay function yielded the characteristic temporal values for the fluorescence decay in healthy and sensitized tissues. Those values calculated for all studied tissues are presented in Table 1. The amplitudes of characteristic lifetimes are not indicated due to the big variation throughout each specimen. Table 1Fluorescence lifetimes of fluorophores in samples of synovium (n=10) and cartilage (n=10) tissues, calculated from FLIM measurements in 650/160- and 637/13-nm spectral ranges. Data expressed as mean±SD.
The FLIM image of sensitized cartilage recalculated after the detection in a 637/13-nm spectral range [Fig. 4(d)], resembled the image recalculated when the imaging has been performed in a spectral range [Fig. 5(e)]; however, the calculated and the relative contributions of their amplitudes were different [Figs. 4(d) and 5(h)]. The value of the middle lifetime (3 ns) became shorter in comparison with the value obtained for a broader spectral range (Table 1), while the values of the longest lifetime were essentially the same. Fig. 5(a and b) Fluorescence lifetime images of the sensitized cartilage, the marked area represents region of interest (ROI) before (a) and after (b) exposure; (c) normalized distribution of average fluorescence lifetimes of sensitized cartilage in ROI before (I) and after (II) photobleaching in spectral range, time gates: yellow—3 to 5 ns, blue—5 to 6.5 ns, green—6.5 to 10 ns, and red—10 to 15 ns; (d) fast FLIM image in spectral range; FLIM images before (e) and after (f) exposure: green color—, blue color—, and red color—. Total magnification ; (g) the changing fluorescence spectra registered during exposure of sensitized cartilage to 405 nm light; (h) fluorescence lifetimes and their relative amplitudes calculated before (A1) and after (A2) exposure. 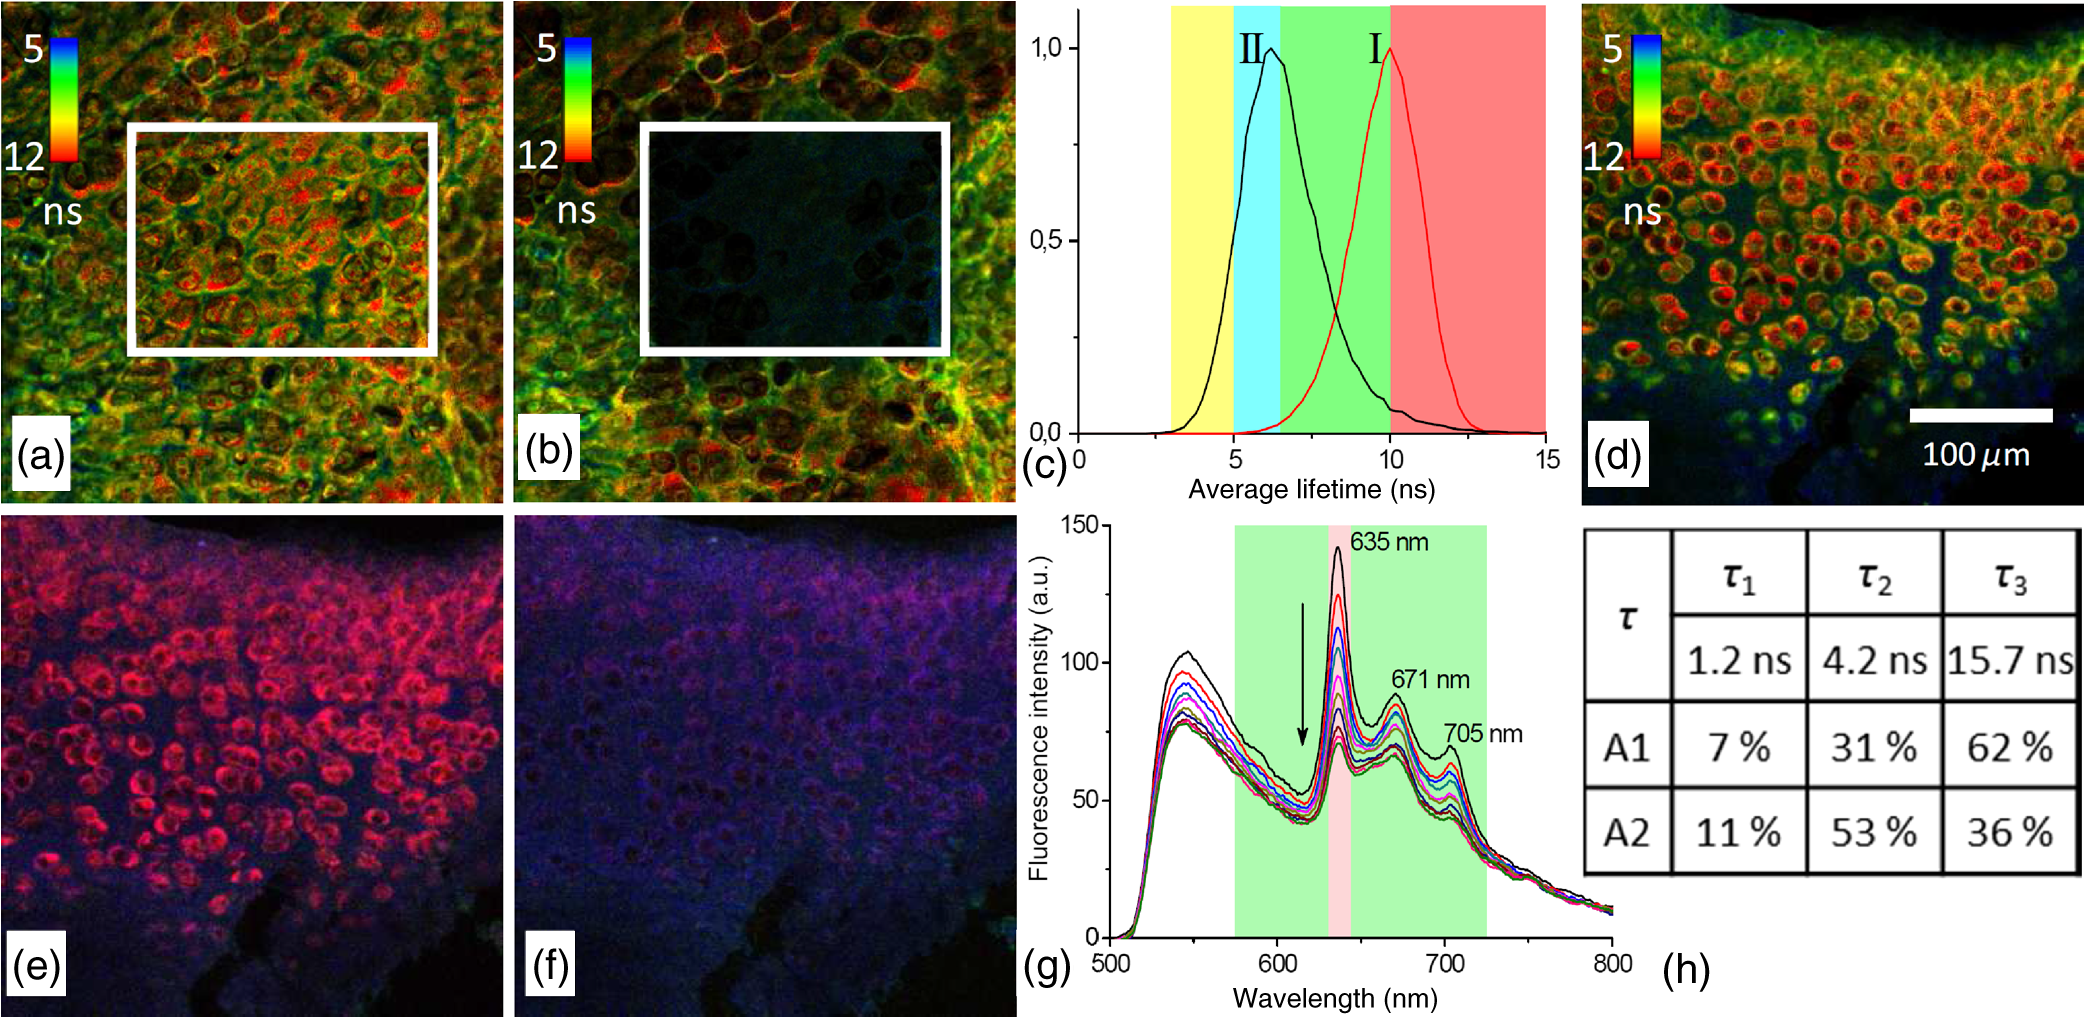 To elucidate the effect of illumination on the fluorescence lifetimes during the microscopic observation of sensitized specimens, they were repeatedly scanned for a period of 10 min with a 405 nm beam of the CW laser connected to the scanning fluorescence microscope, the same system that had been used for fluorescence imaging. Figures 5(a) and 5(b) show the fast FLIM images of the sensitized cartilage with a marked region of interest (ROI) before and after its extended exposure to the laser radiation. The initial distribution of average fluorescence lifetimes in ROI of the sensitized cartilage was limited between a range of 6.5 to 13 ns [Fig. 5(c), curve I], which is typical for other specimens of sensitized cartilage [see Fig. 2(d)] in regard to the longest fluorescence lifetimes. However, due to the absence of calcified cartilage and subchondral bone, there were no fluorescence lifetimes shorter than 5 ns. The distribution of average fluorescence lifetimes in ROI after the exposure shifted to shorter lifetimes (4 to 10 ns) [Fig. 5(c), curve II] and became like that in healthy cartilage [Fig. 2(d), curve I]. Comparison of the fast FLIM image of the sensitized cartilage specimen with the FLIM image indicated the resemblance between the distribution patterns of the fluorophores with the longest average lifetimes and those of the fluorophores with the calculated longest lifetime [Figs. 5(d) and 5(e)]. The highest amplitude of the fluorescence signal corresponding to the longest lifetime was detected in the cells [Fig. 5(e)]. The decreased PpIX fluorescence bands and the increased fluorescence bands of a photoproduct were seen in the fluorescence spectra [Fig. 5(g)] registered after the exposure of specimens to 405-nm radiation. The FLIM image calculated after the exposure [Fig. 5(f)] strongly differed from that calculated before the exposure [Fig. 5(e)]. This difference was reflected to the different inputs of the amplitudes of three calculated decay times. The highest amplitude before exposure was of , while after exposure that of took the lead [Fig. 5(h)]. 3.3.Healthy SynoviumThe fluorescence image as well as fast FLIM and histological images of the synovium specimen from a healthy rabbit are shown in Fig. 6. The green tissue autofluorescence was dominant while the red fluorescence was not distinguished in the combined fluorescence image [Fig. 6(a)]. Dark spots seen throughout the histological image mark discrete synoviocytes, and the light pink area represents fibrous elements of the synovial tissue [Fig. 6(b)]. The specimen was described morphologically as healthy synovium tissue. The characteristic average lifetimes of fluorophores in the fast FLIM image [Fig. 6(c)] of the healthy synovium were distributed from 4 to 8 ns [Fig. 6(d)]. The gating procedure of the fast FLIM image did not allow distinguishing between cells and fibrous elements of healthy synovium. Fig. 6Images of the healthy synovium specimen: (a) a fluorescence image taken combining G and R channels; (b) a H&E stained histological image; (c) a fast FLIM image in a spectral range, total magnification ; (d) normalized distribution of average fluorescence lifetimes of healthy (I) and sensitized (II) synovium in spectral range, time gates: green—4 to 8 ns and red—8 to 10 ns.  3.4.Sensitized SynoviumThe characteristic greenish autofluorescence was also dominant over dim red fluorescence in a sensitized synovium specimen [Fig. 7(a)]. The signs of tissue inflammation in the histological image showed itself as the activation of synovial fibroblasts and the accumulation of inflammatory cells, which were distinguished by the dark circular areas of nuclei [Fig. 7(b)]. However, the fast FLIM image of sensitized inflamed synovium [Fig. 7(c)] differed from that of healthy synovium by the presence of a fluorescence pattern with longer lifetimes. Average fluorescence lifetimes of fluorophores in the sensitized synovium were prolonged [Fig. 6(d)] in comparison with lifetimes of healthy synovium and were found to be limited between 4 and 10 ns. The gating of fluorescence lifetime images [Figs. 7(d) and 7(e)] revealed that the pattern of fibrous elements [Fig. 7(d)] can be distinguished at the same average lifetimes as in the healthy synovium—between 4 and 8 ns. The longest average fluorescence lifetimes—8 to 10 ns [Fig. 7(e)] were measured in the cells of the sensitized synovium, and this gated pattern corresponded well with the pattern of cells [Fig. 7(f)], which was retrieved from the histological image. Fig. 7Images of the sensitized synovium specimen: (a) a fluorescence image taken combining G and R channels; (b) a H&E stained histological image; (c) a fast FLIM image in a spectral range; (d and e) time-gated fluorescence lifetime images (lifetimes gates shown on pictures); (f) a time-gated fluorescence lifetime image (e) interlaced with a pattern of cells from a histological image; (g) an FLIM image: green color— (14%), blue color— (44%), and red color— (42%); (h) an FLIM image (g) interlaced with a pattern of cells from a histological image. Total magnification .  As is seen in the calculated FLIM image of the sensitized synovium, the fluorophores with different fluorescence lifetimes were localized in different sites of the specimen [Fig. 7(g)]. In this specimen, the inputs of amplitudes of (4.1 ns) and (15.4 ns) in a spectral range were almost the same. The distribution pattern of the longest fluorescence lifetime in the calculated FLIM image showed a close resemblance to the pattern of cells in a histological image of synovium tissue [Fig. 7(h)]. 4.DiscussionApplication of fluorescence imaging to visualize structural features of synovium and cartilage tissues from healthy rabbits revealed the dominance of a greenish autofluorescence signal in all specimens. The spotted autofluorescence pattern observed in cartilage tissue distinguished it from the synovial tissue. Comparison between fluorescence and histological images of the cartilage showed that bright green spots seen in the former corresponded to the pattern of cells in the latter, and that the surrounding dim autofluorescence originated from the extracellular matrix. Meanwhile, the cells that emerged in a histological image of the synovium tissue could not be identified on its heterogeneous autofluorescence pattern. More detailed information about the morphological features of healthy and sensitized tissues has been obtained taking advantage of a fast FLIM method. Despite the differences in autofluorescence patterns, the average lifetimes in the sample of healthy cartilage tissues (5 to 10 ns) [Fig. 2(d)] were similar to those in the sample of healthy synovium (4 to 8 ns) [Fig. 6(d)]. The identified average lifetimes of the healthy cartilage corresponded very well with the lifetime of cartilage autofluorescence obtained by other authors after the fitting of the FLIM data to a single exponential decay model ().14 The gating of lifetimes in shorter intervals on the fast FLIM image of the cartilage tissue visualized the cells separately from the extracellular matrix. However, the gating of the fast FLIM image of the healthy synovium did not distinguish between any two specific structures. Fluorescence measurements of the inflamed cartilage tissue, which was sensitized by in vivo application of ALA-Me, revealed the presence of characteristic spectral bands of endogenous PpIX at about 635 and 700 nm atop the autofluorescence background [Fig. 3(a)]. The presence of endogenous porphyrins was also detected on the red channel of the fluorescence microscope as an additional signal [Fig. 3(b)], which was absent in the images of the healthy cartilage. The emergence of both shorter and longer average fluorescence lifetimes in the fast FLIM images indicated differences between sensitized cartilage [Fig. 3(d)] and healthy cartilage. The expansion of the range of gated lifetimes with two additional gates also allowed visualization of separate tissue structures in the specimens of sensitized cartilage. However, only the extracellular matrix was visualized at the same gate of average lifetimes as in healthy cartilage. The pattern of cells sensitized with PpIX, however, revealed itself at the longest average lifetimes and was not detectable at the same range of average lifetimes as in healthy cartilage. Comparison of the gated fast FLIM images with a histological image provided evidence for a morphological (at shorter lifetimes) and a photochemical (at longer lifetimes) origin of the changed lifetimes. Fluorescence microscopy was not sensitive enough to clearly show the presence of endogenous porphyrins in the specimens of sensitized synovium. The superiority of the fast FLIM imaging was demonstrated by revealing the structures with longer (8 to 10 ns) average lifetimes [Fig. 7(c)], which were absent in healthy synovium. Comparison with an inverted histological image [Fig. 7(b)], allowed assigning these structures to the pattern of cells [Fig. 7(f)]. It is notable that, while sensitized cells of synovium and cartilage tissues possessed the longest average fluorescence lifetimes, the ranges of those lifetimes were not the same. Moreover, the exposure of ROI in the sensitized cartilage specimen shifted the distribution of average lifetimes registered at a broad spectral range to shorter values, making it similar to healthy cartilage [Fig. 5(c)] but with a peak at slightly shorter lifetimes. Since PpIX is very unstable, the disappearance of the longest average lifetimes can be explained by PpIX photodegradation. On the other hand, the appearance of even shorter average lifetimes in comparison with those of healthy cartilage can be explained by the combined effect involving the reduced impact from the lifetimes of PpIX and the increased impact from fluorescence lifetimes of the formed PpIX photoproducts. Therefore, the diversity of average fluorescence lifetimes that is typically seen even in unexposed sensitized tissue specimens depending on the spectral region selected for fluorescence registration, can be also caused by ordinary variations in the fluorescence intensity of an applied sensitizer. Since the fast FLIM measurements of healthy and sensitized tissues were performed in a broad spectral range (), in order to relate average fluorescence lifetimes of sensitized tissues with localization of PpIX more specifically, the fast FLIM visualization was repeated in a narrow spectral range. The narrowing of the spectral range of fast FLIM measurements for the same cartilage specimen to , which is specific to the main peak of PpIX fluorescence, expectedly shifted the distribution of average fluorescence lifetimes to longer values [Fig. 2(d)]. Meanwhile, the patterns of sensitized cells in gated FLIM images remained identical for both spectral ranges [Figs. 3(h) and 4(b)]. These findings implied that the obtained longest average fluorescence lifetimes are related most closely to the fluorescence lifetime of intracellular PpIX. It seems that while the fast FLIM imaging can be used to distinguish morphological structures of healthy tissues from those of sensitized tissues, it does not allow for determining the real lifetimes of fluorophores, especially when fluorescence measurements cover a broad spectral range. Consequently, it is neither possible to estimate the fluorescence contribution of certain fluorophore in a particular specimen nor to compare the distribution of the fluorophore in different tissue specimens. On the other hand, the approximation of fast FLIM data obtained from sensitized cartilage in a narrow spectral range () with a three exponential decay function yielded the longest fluorescence lifetime () which possessed the highest amplitude (84%). Numerous studies of PpIX in various cell cultures and tissues reported fluorescence lifetimes with values of 5.2 ns,30 6.3 ns,31 7.4 ns,32 10 to 14 ns,33 and 10 to 20 ns.34 Most of those values resemble the average fluorescence lifetime values obtained from fast FLIM measurements on sensitized synovium and cartilage tissues. It is notable that the calculated fluorescence lifetime of PpIX, which was absent in healthy tissues, remained essentially the same in sensitized tissues. The three-exponential approximation of fast FLIM data which were obtained from healthy tissues registering in a broad spectral range, yielded another set of fluorescence lifetime values, among which () had the highest relative amplitude. Presumably, it reflects the fluorescence intensity contribution of nonspecific intrinsic tissue fluorophores present in synovium and cartilage tissues. The same value possessing a small amplitude was also obtained from the FLIM data of the sensitized cartilage specimen registering in a narrow spectral range [Fig. 4(d)]. However, the approximation of FLIM data after imaging the same specimen in the broad spectral range yielded a longer lifetime value (about 4.2 ns). The decreased amplitude of PpIX lifetime and the increased amplitude of after the light exposure, together with spectroscopic data [Figs. 5(g) and 5(h)], allow one to relate the longer value with the formation of the PpIX photoproduct in sensitized tissues. This obtained value is similar to the values reported in cell culture in vitro (3.6 ns)32 and in different solutions (2.2 to 8.2 ns).35,36 Thus, the appropriate approximation of the average fluorescence lifetimes can provide the accurate relationship of the calculated values with fluorophores, which makes it possible, for instance, not only to determine the localization of the sensitizer and its photoproducts in the tissues using FLIM, but also to follow their transformations. 5.ConclusionsA combination of fluorescence spectroscopy, fluorescence intensity, and lifetime microscopy techniques, together with histopathological imaging of the same specimens of synovium and cartilage tissues, allowed for the detailed visualization of structural elements in healthy and sensitized tissues and the analysis of the fluorescence properties of the dominant fluorophores. The measurements of fluorescence spectra of sensitized tissues provided evidence for the presence of endogenous porphyrins and served in the selection of an appropriate spectral region for the increased accuracy of registered fast FLIM data. Although a fluorescence signal of endogenous PpIX was too weak for the fluorescence intensity microscopy imaging to distinguish specific tissue structures containing the photosensitizer, this aim was achieved using the fast FLIM imaging. Application of the lifetime-gating method on fast FLIM images allowed the employment of different average lifetimes for separate visualization of tissue structures, the presence of which was confirmed by the corresponding histological data. Structural features of healthy synovium and cartilage were found to be different, and no specific patterns of cells which had been detected in cartilage tissue were distinguished in the fluorescence and FLIM images of synovium. Despite the diagnostic potential of fast FLIM to differentiate tissues according to their average lifetimes, it does not allow unambiguous identification of the intratissue fluorophores. The distribution of the average fluorescence lifetimes in the tissue is very dependent not only on the concentrations of the fluorophores, but also on the spectral range of fluorescence measurements, both directly affecting the relative amplitudes of the recorded lifetimes. Thus, the analytical comparison of images from different specimens becomes very complicated. On the other hand, the application of FLIM for visualization of sensitized tissues using a predetermined lifetime value of a sensitizer, such as PpIX, can provide actual and reliable diagnostic data which are also suitable for monitoring of the current tissue state. AcknowledgmentsWe thank Dr. Laima Leonavičienė for the procedures related with antigen-induced arthritis in rabbits and for kind technical assistance. ReferencesP. V. Butte et al.,
“Fluorescence lifetime spectroscopy for guided therapy of brain tumors,”
NeuroImage, 54 S125
–S135
(2011). http://dx.doi.org/10.1016/j.neuroimage.2010.11.001 NEIMEF 1053-8119 Google Scholar
L. N. Liu et al.,
“Characterizing autofluorescence generated from endogenous porphyrins in cancerous tissue of human colon: case studies,”
Proc. SPIE, 8577 857703
(2013). http://dx.doi.org/10.1117/12.2002224 PSISDG 0277-786X Google Scholar
D. Elson et al.,
“Time-domain fluorescence lifetime imaging applied to biological tissue,”
Photochem. Photobiol. Sci., 3
(8), 795
–801
(2004). http://dx.doi.org/10.1039/b316456j PPSHCB 1474-905X Google Scholar
J. Bec et al.,
“Multispectral fluorescence lifetime imaging system for intravascular diagnostics with ultrasound guidance: in vivo validation in swine arteries,”
J. Biophotonics, 7 281
–285
(2014). http://dx.doi.org/10.1002/jbio.v7.5 JBOIBX 1864-063X Google Scholar
C. Dysli et al.,
“Quantitative analysis of fluorescence lifetime measurements of the macula using the fluorescence lifetime imaging ophthalmoscope in healthy subjects,”
Invest. Ophthalmol. Vis. Sci., 55
(4), 2106
–2113
(2014). http://dx.doi.org/10.1167/iovs.13-13627 IOVSDA 0146-0404 Google Scholar
R. Richards-Kortum and E. Sevick-Muraca,
“Quantitative optical spectroscopy for tissue diagnosis,”
Annu. Rev. Phys. Chem., 47 555
–606
(1996). http://dx.doi.org/10.1146/annurev.physchem.47.1.555 ARPLAP 0066-426X Google Scholar
D. S. Elson et al.,
“Multidimensional fluorescence imaging applied to biological tissue,”
Reviews in Fluorescence, 477
–524 Springer, New York
(2006). Google Scholar
L. Marcu,
“Fluorescence lifetime techniques in medical applications,”
Ann. Biomed. Eng., 40
(2), 304
–331
(2012). http://dx.doi.org/10.1007/s10439-011-0495-y ABMECF 0090-6964 Google Scholar
M. Y. Berezin and S. Achilefu,
“Fluorescence lifetime measurements and biological imaging,”
Chem. Rev., 110 2641
–2684
(2010). http://dx.doi.org/10.1021/cr900343z CHREAY 0009-2665 Google Scholar
K. Dowling et al.,
“Fluorescence lifetime imaging with picosecond resolution for biomedical applications,”
Opt. Lett., 23
(10), 810
–812
(1998). http://dx.doi.org/10.1364/OL.23.000810 OPLEDP 0146-9592 Google Scholar
W. Y. Sanchez et al.,
“Fluorescence lifetime imaging for diagnostic and therapeutic intravital microscopy,”
Advances in Intravital Microscopy, 371
–418 Springer Dordrecht Heidelberg, New York, London
(2014). Google Scholar
D. Chorvat and A. Chorvatova,
“Multi-wavelength fluorescence lifetime spectroscopy: a new approach to the study of endogenous fluorescence in living cells and tissues,”
Laser Phys. Lett., 6 175
–193
(2009). http://dx.doi.org/10.1002/lapl.v6:3 1612-2011 Google Scholar
W. H. Yong et al.,
“Distinction of brain tissue, low grade and high grade glioma with time-resolved fluorescence spectroscopy,”
Front. Biosci., 11 1255
–1263
(2006). http://dx.doi.org/10.2741/1878 1093-9946 Google Scholar
H. B. Manning et al.,
“Detection of cartilage matrix degradation by autofluorescence lifetime,”
Matrix Biol., 32
(1), 32
–38
(2013). http://dx.doi.org/10.1016/j.matbio.2012.11.012 MTBOEC 0945-053X Google Scholar
M. C. Skala et al.,
“In vivo multiphoton microscopy of NADH and FAD redox states, fluorescence lifetimes, and cellular morphology in precancerous epithelia,”
Proc. Natl. Acad. Sci. U. S. A., 104 19494
–19499
(2007). http://dx.doi.org/10.1073/pnas.0708425104 PNASA6 0027-8424 Google Scholar
J. R. Lakowicz, Principles of Fluorescence Spectroscopy, Springer, New York
(2007). Google Scholar
F. N. Ghadially and W. J. Neish,
“Porphyrin fluorescence of experimentally produced squamous cell carcinoma,”
Nature, 188 1124
(1960). http://dx.doi.org/10.1038/1881124a0 NATUAS 0028-0836 Google Scholar
J. C. Kennedy, S. L. Marcus and R. H. Pottier,
“Photodynamic therapy (PDT) and photodiagnosis (PD) using endogenous photosensitization induced by 5-aminolevulinic acid (ALA): mechanisms and clinical results,”
J. Clin. Laser Med. Surg., 14
(5), 289
–304
(1996). http://dx.doi.org/10.1089/clm.1996.14.289 JCLSEO Google Scholar
K. B. Trauner and T. Hasan,
“Photodynamic treatment of rheumatoid and inflammatory arthritis,”
Photochem. Photobiol., 64
(5), 740
–750
(1996). http://dx.doi.org/10.1111/php.1996.64.issue-5 PHCBAP 0031-8655 Google Scholar
L. G. Ratkay et al.,
“Amelioration of antigen-induced arthritis in rabbits by induction of apoptosis of inflammatory cells with local application of transdermal photodynamic therapy,”
Arthritis Rheum., 41
(3), 525
–534
(1998). http://dx.doi.org/10.1002/(ISSN)1529-0131 2326-5191 Google Scholar
K. B. Trauner et al.,
“Photodynamic synovectomy using benzoporphyrin derivative in an antigen-induced arthritis model for rheumatoid arthritis,”
Photochem. Photobiol., 67
(1), 133
–139
(1998). http://dx.doi.org/10.1111/php.1998.67.issue-1 PHCBAP 0031-8655 Google Scholar
G. Kirdaite et al.,
“Protoporphyrin IX photodynamic therapy for synovitis,”
Arthritis Rheum., 46
(5), 1371
–1378
(2002). http://dx.doi.org/10.1002/(ISSN)1529-0131 2326-5191 Google Scholar
S. Bagdonas et al.,
“Spectroscopic study of ALA-induced endogenous porphyrins in arthritic knee tissues: targeting rheumatoid arthritis PDT,”
Photochem. Photobiol. Sci., 4
(7), 497
–502
(2005). http://dx.doi.org/10.1039/b503790e PPSHCB 1474-905X Google Scholar
R. Rudys et al.,
“Spectroscopic assessment of endogenous porphyrins in a rheumatoid arthritis rabbit model after the application of ALA and ALA-Me,”
J. Photochem. Photobiol. B, 119 15
–21
(2013). http://dx.doi.org/10.1016/j.jphotobiol.2012.11.008 JPPBEG 1011-1344 Google Scholar
K. Trauner et al.,
“Influence of light delivery on photodynamic synovectomy in an antigen-induced arthritis model for rheumatoid arthritis,”
Lasers Surg. Med., 22
(3), 147
–156
(1998). http://dx.doi.org/10.1002/(ISSN)1096-9101 LSMEDI 0196-8092 Google Scholar
J. Moan,
“On the diffusion length of singlet oxygen in cells and tissues,”
J. Photochem. Photobiol. B, 6
(3), 343
–344
(1990). http://dx.doi.org/10.1016/1011-1344(90)85104-5 JPPBEG 1011-1344 Google Scholar
M. Szabelski et al.,
“Collisional quenching of erythrosine B as a potential reference dye for impulse response function evaluation,”
Appl. Spectrosc., 63
(3), 363
–368
(2009). http://dx.doi.org/10.1366/000370209787598979 APSPA4 0003-7028 Google Scholar
W. Dietel et al.,
“5-aminolaevulinic-acid-induced formation of different porphyrins and their photomodifications,”
Laser Med. Sci., 12 226
–236
(1997). http://dx.doi.org/10.1007/BF02765103 LMSCEZ 1435-604X Google Scholar
W. Dietel et al.,
“Formation of water-soluble porphyrins and protoporphyrin IX in 5-aminolevulinic-acid-incubate carcinoma cells,”
J. Photochem. Photobiol. B, 33 225
–231
(1996). http://dx.doi.org/10.1016/1011-1344(95)07249-7 JPPBEG 1011-1344 Google Scholar
H. Schneckenburger et al.,
“Time-resolved in-vivo fluorescence of photosensitizing porphyrins,”
J. Photochem. Photobiol. B, 21 143
–147
(1993). http://dx.doi.org/10.1016/1011-1344(93)80176-A JPPBEG 1011-1344 Google Scholar
J. A. Russell et al.,
“Characterization of fluorescence lifetime of photofrin and delta-aminolevulinic acid induced protoporphyrin IX in living cells using single- and two-photon excitation,”
IEEE J. Sel. Top. Quantum Electron., 14
(1), 158
–166
(2008). http://dx.doi.org/10.1109/JSTQE.2007.912896 IJSQEN 1077-260X Google Scholar
M. Kress et al.,
“Time-resolved microspectrofluorometry and fluorescence lifetime imaging of photosensitizers using picosecond pulsed diode lasers in laser scanning microscopes,”
J. Biomed. Opt., 8
(1), 26
–32
(2003). http://dx.doi.org/10.1117/1.1528595 JBOPFO 1083-3668 Google Scholar
A. Ruck et al.,
“Multiwavelength FLIM: new concept for fluorescence diagnosis,”
Proc. SPIE, 8226 82260G
(2012). http://dx.doi.org/10.1117/12.906620 PSISDG 0277-786X Google Scholar
R. Cubeddu et al.,
“Fluorescence lifetime imaging: an application to the detection of skin tumors,”
IEEE J. Sel. Top. Quantum Electron., 5
(4), 923
–929
(1999). http://dx.doi.org/10.1109/2944.796312 IJSQEN 1077-260X Google Scholar
L. Brancaleon et al.,
“Characterization of the photoproducts of protoporphyrin IX bound to human serum albumin and immunoglobulin G,”
Biophys. Chem., 109 351
–360
(2004). http://dx.doi.org/10.1016/j.bpc.2003.12.008 BICIAZ 0301-4622 Google Scholar
P. Valat, G. D. Reinhart and D. M. Jameson,
“Application of time-resolved fluorometry to the resolution of porphyrin-photoproduct mixtures,”
Photochem. Photobiol., 47 787
–790
(1988). http://dx.doi.org/10.1111/php.1988.47.issue-6 PHCBAP 0031-8655 Google Scholar
|
|||||||||||||||||||||||||||||||


