
|
|
1.IntroductionUsed for the treatment of life-threatening gram-negative bacterial infections, aminoglycoside (AG) antibiotics are one of the most commonly prescribed antibiotics in both developing and industrialized countries. As powerful and cost-effective broad-spectrum antibiotics, AGs are attractive treatment options, particularly in economically disadvantaged populations around the world.1,2 They are also used in industrialized countries to treat numerous infections.3 Despite their high efficacy and potential to save numerous lives annually, AGs frequently cause nephrotoxicity and/or ototoxicity in patients undergoing treatment. Unlike AG-induced nephrotoxicity, ototoxic damage is irreversible in more than one fourth of patients.4,5 All nine AG antibiotics in use today damage, in varying degrees, the sensory cells in both cochlear and vestibular sensory organs resulting in permanent hearing loss (HL) and/or balance disorders.5 Approximately 15% of patients suffer vestibulotoxic trauma, while up to 25% suffer ototoxic cochlear trauma during AG treatment.6,7 AG ototoxicity starts with high-frequency HL that progresses to include low frequencies during continued treatment and/or with higher AG dosages.8 This HL is triggered by damage and eventual loss of high- and low-frequency cochlear sensory cells (inner and outer hair cells). Of the two types of cochlear cells, sensory and supporting, cochlear sensory cells are readily damaged by aging, acoustic trauma, and ototoxins, including AGs.9–12 Notably, outer hair cells (OHCs) in high-frequency regions of the cochlea exhibit the greatest sensitivity to the above conditions. AGs cause bacterial cell death by binding to the 16S rRNA associated with the 30S ribosomal subunit thereby interfering with translation, resulting in miscoding and inhibition of functional protein synthesis.13,14 While much is known regarding the bactericidal mechanism of action for AG antibiotics, the mechanisms mitigating the heightened sensitivity of sensory cells relative to supporting cells, as well as the high-to-low-frequency propensity for ototoxic sensory cell loss have yet to be determined. Schacht15 first proposed free radical production and oxidative stress as key regulators of AG-induced HL. Since then, the relationship between increased oxidative stress and age-related, noise-induced, and drug-induced HL has been investigated by multiple groups.2,16–19 Several studies have shown that the cationic AGs rapidly and specifically enter inner ear sensory cells via mechanotransduction channels, where they localize to a variety of subcellular organelles including the mitochondrion.20 Given the similarity between bacteria and mitochondria, models for the ototoxic effects of AGs have begun to converge on inhibition of mitochondrial and/or cytoplasmic protein synthesis, eventually leading to mitochondrial dysfunction and cell death through the overproduction of apoptosis-triggering reactive oxygen species (ROS).21–25 Indeed, studies have shown that patients with specific mitochondrial mutations are profoundly sensitive to AG ototoxicity26 and that sensory cell mitochondria rapidly swell in response to AG exposure.27 As recently pointed out by Dwyer et al.,28 in addition to target-specific processes (such as protein synthesis), AG antibiotics are also known to have common oxidative damage pathways leading to the generation of ROS by altering cellular metabolism. Therefore, in addition to inhibiting mitochondrial protein synthesis, AGs produce DNA and lipid damage and can inhibit respiratory enzyme activity within a few hours of AG application.23,25 The rapid AG-induced alterations in metabolic function described in these studies show that the mitochondrial metabolism may be altered by modulation of the respiratory enzyme function independent of and/or preceding significant alterations in respiratory enzyme synthesis and turnover. To determine if variations in sensory and supporting cells’ metabolism may account for differences in ototoxic vulnerability, two-photon fluorescence lifetime imaging microscopy (FLIM) was employed to measure changes in the fluorescence intensity and lifetime of the metabolic reporter molecule nicotinamide adenine dinucleotide (NADH). Endogenous NADH fluorescence intensity represents the competing processes of Krebs cycle NADH production ( is reduced to fluorescent NADH) and NADH utilization by the electron transport chain (NADH is oxidized to produce nonfluorescent ). Noninvasive optical techniques measuring NADH began with the pioneering studies of Chance and colleagues in the 1950s.29–31 Since the nicotinamide moiety is the source of the fluorescence, both NADH and nicotinamide adenine dinucleotide phosphate (NADPH) have the same spectral signature, though functionally these molecules participate in different biochemical processes. Notably, changes in endogenous fluorescence intensity could be due to changes in either NADH or NADPH, denoted as NAD(P)H. In the presence of oxygen, high-cellular metabolic demand results in an overall decrease in NADH fluorescence intensity, whereas low-metabolic demand results in an increase in NADH fluorescence.32 Indeed, optical quantification and utilization of NAD(P)H fluorescence intensity as a method for monitoring cellular respiration have been vastly employed and published in more than 1000 articles.33 Fluorescence lifetime imaging of NAD(P)H has several advantages over intensity-based methods (see Chapter 4 of Ghukasyan and Heikal (Ref. 34) for a recent review). Lakowicz et al.35 were the first to use FLIM to clearly distinguish the free and enzyme-bound pools of NADH on the basis of the fluorescence lifetime. NAD(P)H emits fluorescence with a time delay that depends on its conformation which is affected by protein binding. Free NADH in solution has a commonly observed 0.4 ns lifetime that lengthens several fold upon binding. Thus, FLIM has been used to track changes in metabolic enzymes.36,37 Using time-resolved fluorescence anisotropy, Vishwasrao et al. observed not just one, but several enzyme bound pools of NADH.38,39 Their work demonstrated that the changes in metabolism are not only evident in the NADH/NAD+ ratio, but also in a rearrangement of the enzyme-bound pools of NADH. Two-photon-excited NAD(P)H FLIM has also been used to establish metabolic changes associated with disease in normal and precancerous epithelia,40 in solid tumors,41 and has demonstrated sensitivity in detecting cell pathology and inhibition of the respiratory chain enzymes in normal and breast cancer cells.42 Endogenous NAD(P)H signals in intact cochlea have been shown to be predominantly due to NADH, not NAD(P)H.43 Recently, Blacker et al.44 used FLIM to further discriminate NADPH fluorescence from NADH fluorescence in both HEK and cochlear cells by noting that the enzyme-bound NADPH has a much longer fluorescence lifetime (4.4 ns) than enzyme-bound NADH (1.5 ns). In both intact and explanted cochleae, AG-mediated changes in NAD(P)H fluorescence intensity have been documented in sensory cells.45,46 High-frequency OHCs were found to be metabolically biased to rapidly respond to changes in the mitochondrial microenvironment including glucose concentration and AG exposure. This response was observed within 30 min of AG exposure, notably prior to protein synthesis inhibition. Such metabolic responses may explain why high-frequency OHC is particularly vulnerable to AG ototoxicity, noise-induced, and age-related HLs. Unfortunately, since the fluorescence quantum yield of NAD(P)H is proportional to the fluorescence lifetime, NAD(P)H intensity is affected by both concentration and protein binding [which affects the NAD(P)H microenvironment]. Therefore, changes in fluorescence intensity can be difficult to interpret. By measuring both intensity and the fluorescence lifetime, FLIM can independently quantify NAD(P)H concentration. The studies contained herein further extend these findings by using NAD(P)H FLIM to measure endogenous and AG-induced differences in cochlear sensory and supporting cells’ mitochondrial metabolism to elucidate putative differences in sensory and supporting cells vulnerability to AG ototoxicity. 2.Materials and Methods2.1.Cochlear ExplantsIntact cochlear explants were obtained from asphyxiated postnatal day 6 () friend luekemia virus, strain B (FVB) mice as previously described.46 Briefly, cochleae were dissected in 20-mM HEPES-buffered L-15 media and acutely cultured (18 to 24 h) in Dulbecco’s modified Eagle’s medium/F12 medium (Invitrogen, Carlsbad, California) supplemented with 10% FBS (Invitrogen) and maintained at 37°C at 5% . Mitochondrial metabolism was measured in cochlear sensory (IHCs and OHCs) and supporting (pillar) cells in apical (low-frequency, ) and basal (high-frequency, ) regions, located at 20% and 80% along the length of each cochlear explant, respectively.47 Unless otherwise noted, reagents and solutions were obtained from Sigma-Aldrich (St. Louis, Missouri). All animal care and use procedures were approved by the Creighton University Animal Care and Use Committee. 2.2.Gentamicin Uptake in Sensory and Supporting CellsTo verify the uptake and accumulation of gentamicin (GM) in cochlear cells, explants were imaged by confocal microscopy while bathed in a solution containing GM and GM conjugated to Texas Red (GTTR), as described in Dai et al.48 GTTR was single photon excited using a 543-nm HeNe laser focused through a , 0.9 NA water immersion lens (Olympus, Center Valley, Pennsylvania). Fluorescence was isolated using a 545-nm dichroic mirror and a bandpass filter and de-scanned through a one Airy unit pinhole, as described previously.45 Images were acquired at 10-min intervals to monitor the accumulation of GM in cochlear cells. 2.3.Metabolic Imaging MethodsFluorescence intensity and lifetime imaging of two-photon-excited NAD(P)H were performed using the 740-nm mode-locked pulse train of a Spectra Physics Mai Tai Ti:S laser (Newport Corporation, Irvine, California) and a Zeiss LSM 510 NLO META multiphoton microscope (Carl Zeiss, Oberkochen, Germany). Intrinsic cellular fluorescence was measured using a , 0.9 NA water immersion lens (Olympus). As previously described, the primary source of fluorescence was confirmed to be NAD(P)H based on the measured emission spectrum. Intrinsic fluorescence was isolated using a 500-nm longpass dichroic mirror and an HQ bandpass filter (Chroma Technology, Bellows Falls, Vermont), and detected with a Hamamatsu H7422p-40 photon-counting PMT (Hammamatsu, Hammamatsu City, Japan) and a time-correlated single-photon counting module (830 SPC, Becker and Hickl, Berlin, Germany).32,43,45 Cochlear explants were imaged in modified tyrodes imaging buffer containing 135 mM NaCl, 5 mM KCl, 1 mM , 1.8 mM , 20 mM HEPES, 5 mM glucose, and 0.25% bovine serum albumin. Explants were maintained at during imaging using a warmed platform and temperature controller (Warner Instruments, Hamden, Connecticut). Previous studies have used room temperature cochlear preparations, which have improved viability compared with preparations maintained at 37°C.43–45 The current studies more closely approximate physiological temperatures while maintaining cochlear explant viability during metabolic imaging. NAD(P)H fluorescence intensity and lifetime measurements were obtained prior to and 30 min after application of GM, a representative AG antibiotic. This dose is within the range of AG doses that are frequently used to study AG ototoxicity.49–52 Intensity and lifetime images were acquired by using four successive scans of a single-focal plane with an average laser power of 5 mW at the sample and a total image acquisition time of 124 s. To prevent photobleaching, no more than three images were obtained from well-separated cochlear regions. Control images acquired in cochlear preparations prior to GM treatment indicated that the photobleaching during fluorescence lifetime imaging was not significant. 2.4.Assays of Metabolic ActivityRelative differences in endogenous, steady-state NAD(P)H fluorescence intensities were obtained by imaging apical- (low-frequency) and basal- (high-frequency) turn sensory and pillar cells (supporting cells) under identical imaging parameters. To determine the dynamic range of NADH metabolism (the difference between maximum NADH reduction and maximum NADH oxidation) in cochlear sensory and supporting cells, cochlear explants were exposed (30 min) to carbonyl cyanide--trifluoromethoxyphenylhydrazone (FCCP) or sodium cyanide (NaCN). These concentrations have previously been shown to be sufficient to cause maximal NADH oxidation and reduction in cochlear hair cells, respectively.46 To determine if acute GM alters mitochondrial membrane potential in sensory and supporting cells, control and GM-exposed cochlear explants were incubated with tetramethylrhodamine-ethyl-ester-perchlorate (TMRE, a fluorescent mitochondrial membrane potential indicator) and MitoTracker Green (MTG, a membrane potential-independent fluorescent mitochondrial label) at 37°C and 5% for 30 and 20 min, respectively. All fluorophores were obtained from Molecular Probes (Eugene, Oregon). Cochlear explants were maintained at and immediately imaged using a Leica TCS SPC830 multiphoton confocal microscope and an IRAPO , 0.95 NA water immersion lens (Leica Microsystems, Buffalo Grove, Illinois). TMRE and MTG were single-photon excited using 552- and 488-nm excitation with fluorescence emission collection at 565 to 620 nm and 500 to 550 nm, respectively. Fluorescence images were acquired at depth intervals throughout each cochlear preparation, then averaged to determine mean cell-specific fluorescence intensities for TMRE and MTG. 2.5.Metabolic Imaging AnalysisNAD(P)H fluorescence intensity and FLIM analyses were performed as described in Vergen et al.32 Briefly, individual sensory and supporting cells were analyzed as separate regions of interest (ROIs) using Becker and Hickl SPC Image software (SPC Image, Becker and Hickl, Berlin, Germany). Typical ROIs consisted of 200 to 250 pixels for pillar cells and OHCs and approximately 350 pixels for inner hair cells (IHCs). The measured fluorescence decay at each pixel within an ROI, , was fit to single- and double-exponential decay models: Neighboring pixels (, bin 2 in the SPCImage software) were binned to ensure enough photons in the decay trace (256 time bins spanning 10 ns) to allow for the determination of two decay times. An -test was performed to compare the fits obtained for each pixel to determine whether the improvement in the Chi-squared fitting parameter was sufficient to justify the use of a double-exponential model.53 If so, the double-exponential model was used for the pixel, otherwise the single-exponential model was used. The average lifetime was calculated by The relative concentration () of the fluorophore associated with a given lifetime () is described by where is the total concentration for the pixel. Separate concentration-weighted fluorescence lifetime histograms were compiled for each cell type and fitted to a sum of Gaussians (OriginLab, Northampton, Massachusetts) to determine the fluorescence lifetimes and fraction of the total concentration associated with each lifetime pool.The results from unique lifetime pools identified in each preparation were averaged by cell type. NAD(P)H intensity and fluorescence lifetime measurements were averaged for IHCs (8 to ), OHCs (25 to ), and pillar cells (8 to ) in each preparation. A minimum of nine cochlear preparations were imaged for each treatment condition. Fluorescence intensities for all cell types and locations were normalized to the average intensity of untreated (control) basal-turn OHCs for preparations imaged on the same day. When the fluorescence decay is characterized by one or two lifetimes in a given pixel, numerical simulations show that this analysis routine correctly identifies the lifetimes and pool concentrations [Eq. (4)] to be within a few percent of the known values assuming 10,000 to 20,000 measured photons and well-separated lifetimes, differing by at least a factor of 2. In this case, the errors are consistent with the level of Poisson noise, as expected. This was typically the case for the cells analyzed in this study. Significantly more photons are required to obtain the same accuracy when the lifetimes in a single pixel are very similar. Attempts to fit fluorescence decay curves to three or more exponentials did not produce statistically significant improvements in the fit, indicating that the extra components were not warranted given the number of photons collected. Given the potential heterogeneity in the femtoliter volume of a binned pixel, it is possible that the measured lifetimes still represent a concentration-weighted average of molecules with very similar lifetimes. Nevertheless, while the lifetime pools that we identify with this technique are a necessary simplification of a more complicated scenario, changes in the populations of the identified lifetime pools still reflect important underlying changes in the local NAD(P)H microenvironment, which can be properly interpreted relative to well understood metabolic control measurements (such as mitochondrial inhibition and uncoupling). As with NAD(P)H intensity and fluorescence lifetime measurements, TMRE and MTG fluorescence intensities were averaged for IHCs (), OHCs (), and pillar cells () obtained from distinct ROIs in each preparation. Thirteen cochlear preparations were imaged for each treatment condition. Relative differences in mitochondrial membrane potential were calculated as the ratio of the average TMRE fluorescence intensity and the average MTG fluorescence intensity obtained from each cell type. 3.Results3.1.Texas Red-Labeled Gentamicin Is Preferentially Taken up by Cochlear Sensory CellsTo verify the entry of GM into cochlear cells, confocal microscopy images were acquired from GTTR at 10-min intervals over a 30-min standard incubation time. Sensory cells showed a rapid accumulation within 10 min with brightly labeled stereocilia (Fig. 1). In contrast, no labeling of the supporting cells was observed under our incubation conditions. While this does not rule out the possibility of low-level uptake, we estimate that the concentration of GM in the pillar cells is at least 100-fold lower than in the sensory cells. Fig. 1GM rapidly enters cochlear sensory cells, triggering a significant increase in mitochondrial membrane potential. (a–c) GM Texas Red (GTTR) rapidly accumulates in cochlear inner hair cells (I) and outer hair cells (, , and ), but not the supporting pillar cells (P). Each image is a two-channel merge of transmitted light (grayscale) and GTTR confocal fluorescence (yellow) images to better enable identification of unlabeled cells. GTTR was present in cochlear sensory cells after (a) 10-, (b) 20-, and (c) 30-min exposure to GTTR. (d) GM significantly increases the mitochondrial membrane potential in sensory and supporting cells. Color-coded asterisks represent the significant differences (*, **, ***) between cell types and treatments: IHCs with treatment (red), OHCs with treatment (black), pillars with treatment (gray), IHCs versus pillars (purple), and OHCs versus pillars (blue). .  Acute GM exposure (, 30 min) significantly increased mitochondrial membrane potentials in sensory and supporting cells in both high- and low-frequency regions of the cochlea [Fig. 1(d)]. GM-induced changes were signficantly larger in high-frequency cells. The percent change in mitochondrial membrane potential between control and GM-treated cells was significantly larger in high-frequency OHCs () than in low-frequency OHCs (, ). While the response to GM was the same for high- and low-frequency IHCs, pillar cells showed a signficantly elevated percent change in mitochondrial membrane potential in high-frequency regions (, ) compared with low-frequency regions (). Endogenous differences in mitochondrial membrane potential were also observed. In low-frequency regions of the cochlea, IHC mitochondrial membrane potentials were greater than pillar cell potentials (). In the high-frequency region, pillar cell membrane potentials were signficantly reduced when compared with IHC and OHC potentials (). 3.2.Endogenous Metabolic Differences between Cochlear Sensory and Supporting CellsNAD(P)H fluorescence intensity, average fluorescence lifetime, and NAD(P)H concentration were used to assess putative intrinsic differences in sensory and supporting cell mitochondrial metabolism. NAD(P)H fluorescence intensity was measured in individual IHCs, OHCs, and pillar cells in cochlear explants [Figs. 2(a)–2(c)]. NADH intensity increases when mitochondria are inhibited with NaCN and decreases when oxidative phosphorylation is uncoupled from electron transport by FCCP [Figs. 2(a)–2(c) and 3]. The endogenous NAD(P)H fluorescence intensity of OHCs was significantly greater than IHCs and pillar cells in both high- and low-frequency regions of the cochlea (Fig. 3, black bar). Baseline differences were also observed between IHCs and OHCs in all cochlear locations. The greatest difference in intensity occurred between OHCs and both IHCs and pillar cells in the high-frequency regions of the cochlea (both ). After uncoupling with FCCP, the absolute decrease in NAD(P)H fluorescence intensity from baseline levels in low-frequency regions of the cochlea was greater in sensory cells than supporting cells. In low- and high-frequency regions of the cochlea, OHCs displayed the greatest decrease in NAD(P)H fluorescence intensity when maximally oxidized. No significant differences in NAD(P)H fluorescence intensity were observed between maximally oxidized sensory cells and pillar cells in either high- or low-frequency regions of the cochlea. NaCN significantly increased NAD(P)H fluorescence intensity in high-frequency OHCs and low-frequency pillar cells (both ). The intensity was greatest in high-frequency OHCs after NaCN treatment (Fig. 3). In principle, endogenous differences in NAD(P)H fluorescence intensity may be due to the differences in NAD(P)H concentration within each cell type or cell-specific differences in the NAD(P)H microenvironment that affect the fluorescence quantum efficiency. To distinguish between these two possibilities, average fluorescence lifetimes were measured in control and mitotoxin-exposed sensory and supporting cells. Representative FLIM images for control, NaCN-, and FCCP-treated cochleae are shown in Figs. 2(d)–2(f). Fig. 2NAD(P)H fluorescence intensity and FLIM images of (a, d) NaCN-treated, (b, e) untreated control, and (c, f) FCCP-treated cochlear explants. Three OHCs (), a single pillar (P), and a single IHC (I) have been denoted. Regions of interest (ROIs) used for image analysis do not include the nuclear region. Pixel color represents the average NAD(P)H fluorescence lifetime. .  Fig. 3Dynamic range of NAD(P)H intensity varies between sensory (IHC and OHCs) and supporting (pillar) cells. Color lines represent distinct metabolic states: NaCN inhibited (green, top bar), control (black, middle bar), and FCCP uncoupled (blue, bottom bar). NAD(P)H intensity is normalized to high-frequency OHCs. of nine or more replicates ( to 63; to 19, to 17). Color-coded asterisks represent significant differences (*, ***) between cell types under the same treatment. Red asterisks indicate significant change from control with NaCN or FCCP treatment. 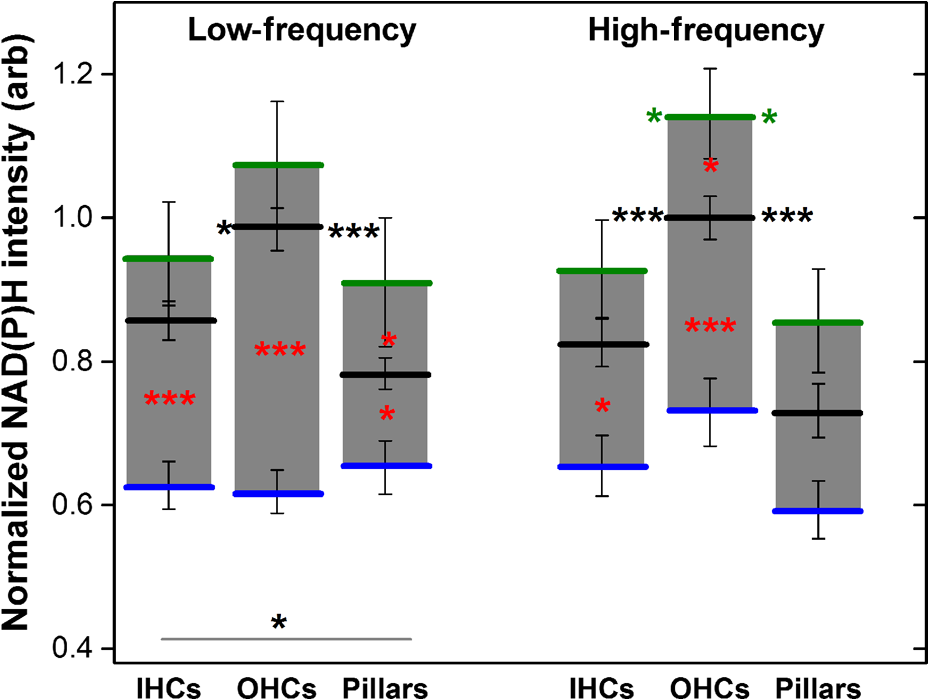 Qualitative differences in NAD(P)H lifetimes between NaCN-inhibited and untreated cochlear sensory and supporting cells were evident with the former displaying shorter lifetimes. Supporting cells were observed to have a significantly longer average NAD(P)H fluorescence lifetime () for all cochlear locations (Fig. 4). IHCs and OHCs had similar NAD(P)H fluorescence lifetimes throughout. FCCP treatment revealed significant differences between maximally oxidized OHCs and pillars in both high- and low-frequency regions of the cochlea, while significant differences between maximally oxidized IHCs and pillars were only present in the high-frequency region. NaCN-treated preparations maintained significant differences in average NAD(P)H fluorescence lifetimes between sensory and supporting cells in both locations (all ). Average NAD(P)H fluorescence lifetimes increased significantly with FCCP treatment in low- and high-frequency IHCs and high-frequency OHCs (all ). Fig. 4Average NAD(P)H fluorescence lifetimes measured in cochlear cells under various metabolic conditions. Average lifetimes within OHCs, IHCs, and pillars are represented by black, red, and gray bars, respectively. of nine or more replicates ( to 63; to 19, and to 17). Significance color coding is the same as in Fig. 1 (*, ***). 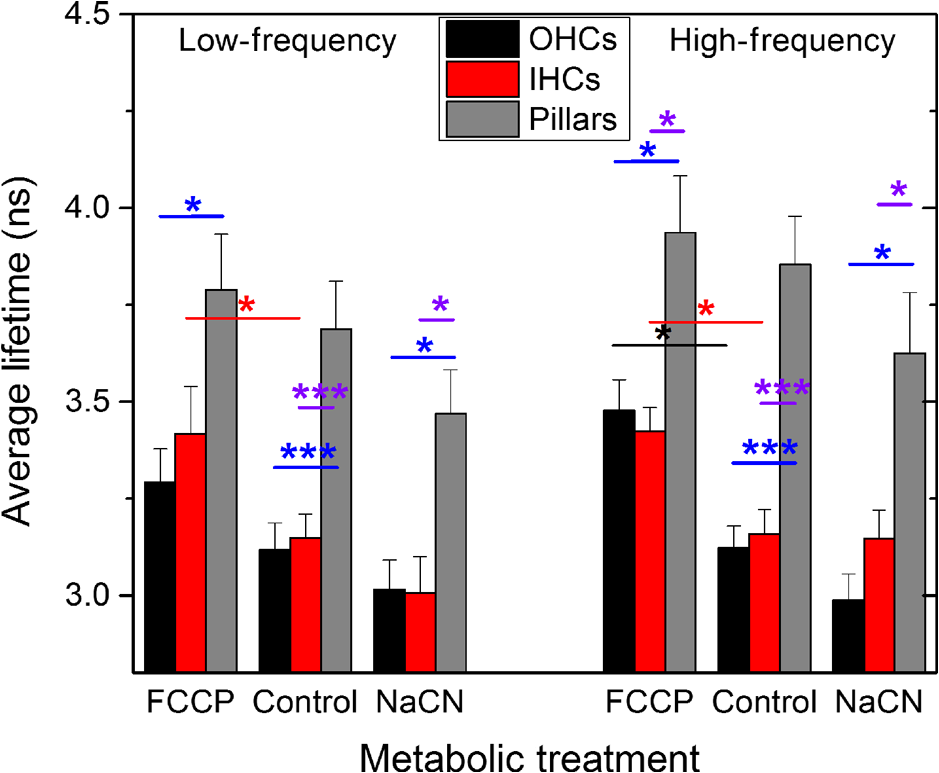 NAD(P)H intensity and lifetime data were also used to evaluate relative differences in NAD(P)H concentration (Fig. 5). The endogenous NAD(P)H concentration (baseline, black line) was greater in both types of sensory cells when compared with supporting cells in both high- and low-frequency regions of the cochlea. Additionally, OHCs had greater NAD(P)H concentrations than IHCs. Following FCCP treatment, sensory cells had greater NAD(P)H concentrations than supporting cells in the high-frequency region of the cochlea. NaCN-treated OHCs also exhibited greater NAD(P)H concentrations than IHCs or pillar cells in this region. Fig. 5NAD(P)H concentration varies between sensory and supporting cells, with OHCs having the highest endogenous concentration (black bars). The dynamic range (maximum oxidation and reduction capacities) of NAD(P)H concentration is greatest in high-frequency OHCs. Color coding is the same as in Fig. 3. of nine or more replicates ( to 63, to 19, and to 17).  3.3.Ototoxic Antibiotic Gentamicin Specifically Alters Sensory Cell Mitochondrial MetabolismThe approach and analyses used to establish fundamental differences in mitochondrial metabolism between sensory and supporting cells were also used to evaluate the effect of acute GM exposure (, 30 min). NAD(P)H fluorescence intensity and FLIM images (Fig. 6) of GM-treated cultured cochleae were analyzed as previously described. A distinct increase in intensity and variations in NAD(P)H lifetimes were observed between control [Figs. 6(a) and 6(b)] and GM-exposed [Figs. 6(c) and 6(d)] sensory, but not supporting, cells. GM significantly increased the NAD(P)H fluorescence intensity in high-frequency IHCs () and OHCs (), but not in pillar cells [Figs. 6(a) and 7(a)]. Fig. 6NAD(P)H intensity and FLIM images of high-frequency regions of control (a, b) and GM-treated (c, d) cochlear explants, respectively. Pixel color represents the average NAD(P)H fluorescence lifetime. .  Fig. 7GM alters NAD(P)H in sensory but not supporting cells. Treatment increased (a) intensity in high-frequency sensory but not pillar cells, (b) lifetime in low-frequency IHCs but not OHCs or pillars, and (c) concentration in high-frequency OHCs only. of 11 or more replicates ( to 63 and to 27). Significance color coding is the same as in Fig. 1. Green indicates significant differences between IHCs and OHCs (*, ***). 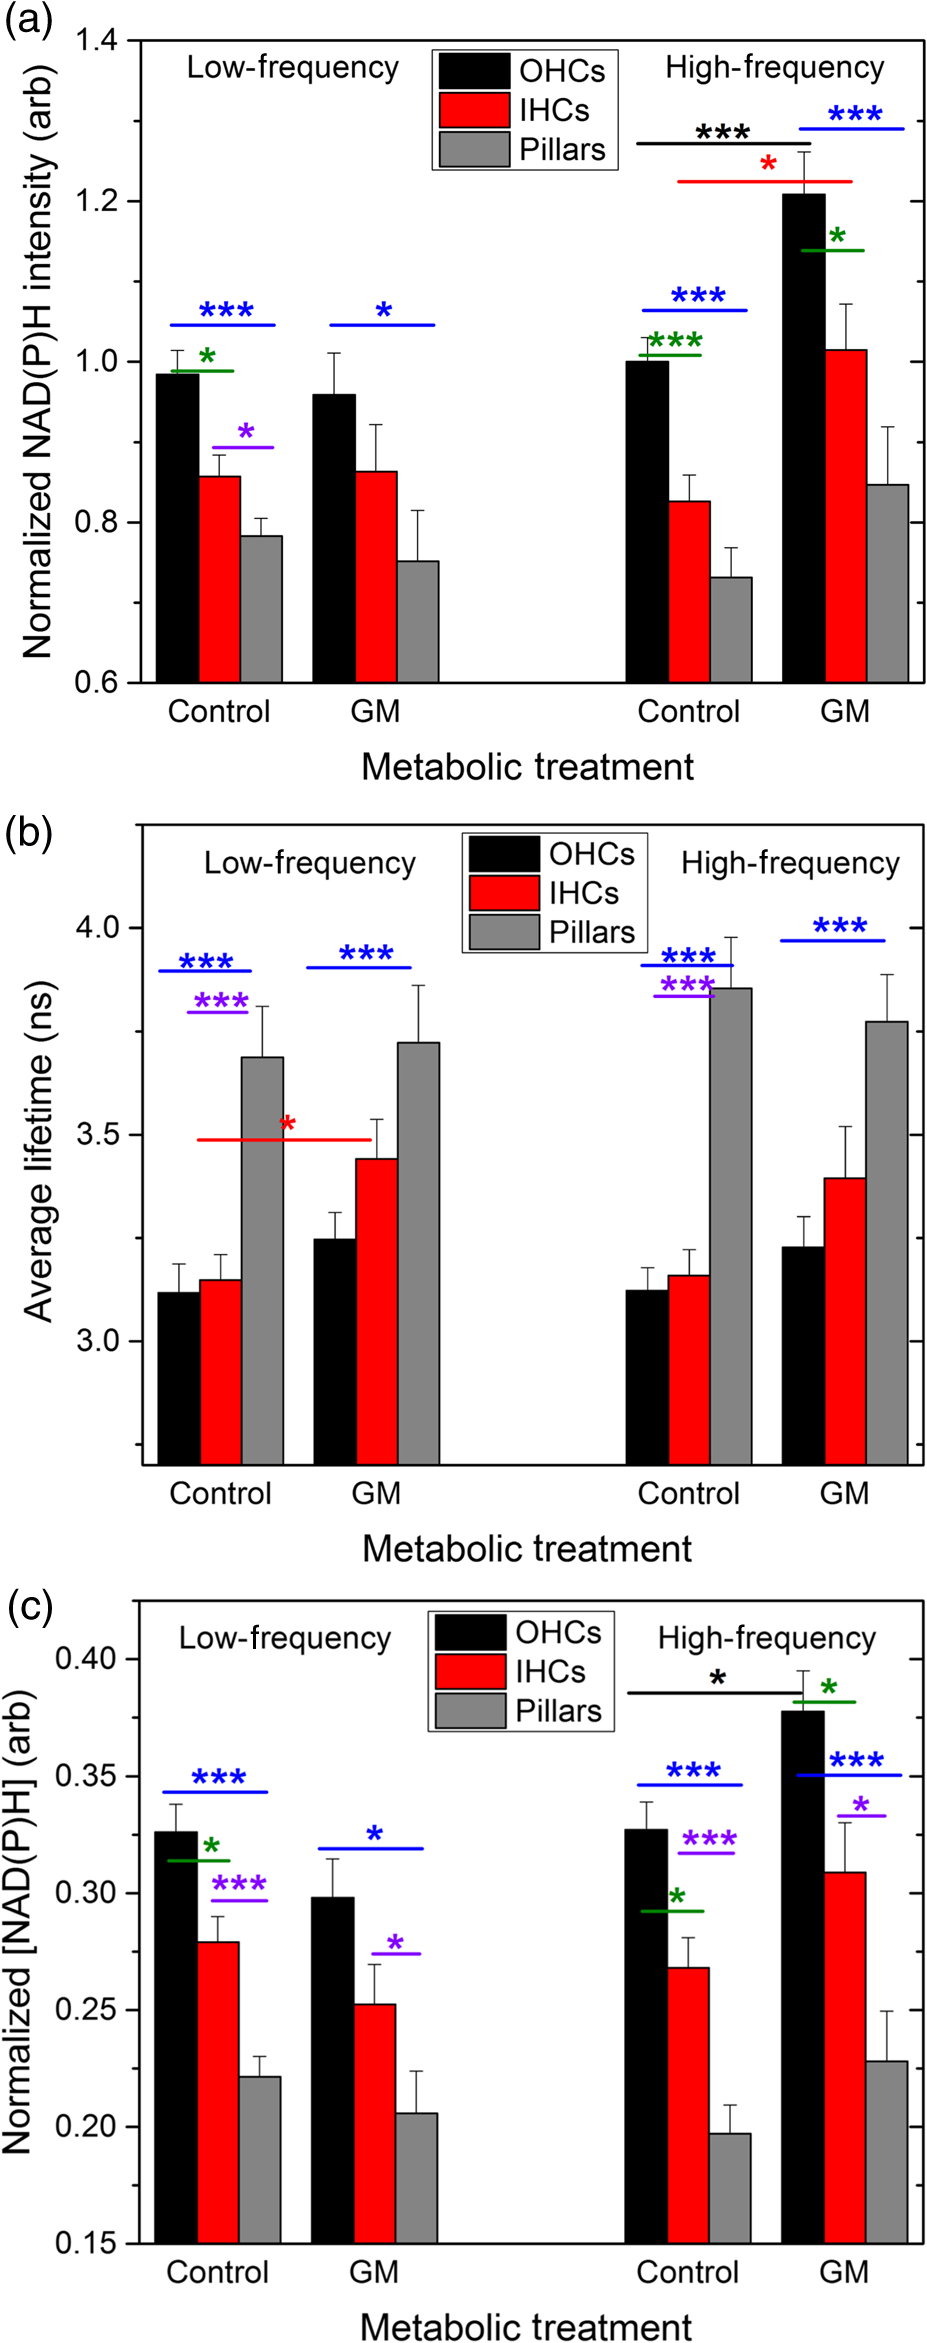 Although a significant increase in NAD(P)H fluorescence intensity was observed for both sensory cell types in high-frequency regions, GM only increased average NAD(P)H lifetimes in low-frequency IHCs [Fig. 7(b), red bar, ]. A trend of increasing lifetime with GM treatment was observed in low- and high-frequency OHCs. Akin to the endogenous differences in OHC and pillar cell average lifetimes, OHCs had significantly shorter average lifetimes than pillar cells post-GM treatment ( for both regions). Fluorescence lifetime imaging also revealed changes in cellular NAD(P)H concentration with GM exposure. GM significantly increased NAD(P)H concentration in high-frequency OHCs [Fig. 7(c), black bar ]. A similar trend was observed in high-frequency IHCs and pillar cells. Akin to controls, GM-treated high- and low-frequency OHCs and high-frequency IHCs have significantly greater NAD(P)H concentration than pillars in a given location ( and , respectively). In contrast, a trend toward decreasing NAD(P)H concentration following GM treatment was observed in all low-frequency cells. These results indicate that GM differentially alters NAD(P)H concentration in high- and low-frequency sensory cells. Significant GM-induced changes in NAD(P)H concentration were solely observed in high-frequency OHCs. The average lifetime presented in Fig. 7(b) reflects the contribution from many NAD(P)H subcellular pools, each characterized by their own lifetime and population. In principle, changes in the average lifetime could be due to either a change in the population of well-established pools (with unchanging lifetimes) or the development of pools with different lifetimes [new NAD(P)H binding partners or microenvironments]. In the simple case of two microenvironments, one characterized by a short lifetime, the other by a long lifetime, when molecules leave the short-lifetime pool and enter the long-lifetime pool, an increase in the average lifetime would be measured. A longer average lifetime would also occur if a new microenvironment was established with a longer lifetime (perhaps a new binding partner). To explore these possibilities, the lifetime distribution from each image was organized into unique short- and long-lifetime pools derived from the and decays described in Eqs. (1) and (2). In both untreated and GM-treated cochlear explants, the short-lifetime pool () was characterized by lifetimes in the range of 0 to 2.0 ns, while the long-lifetime pool () always had lifetimes greater than 2.0 ns. The fraction of NAD(P)H associated with the short lifetime [Eq. (4)] and the average lifetime of the short- and long-lifetime pools are summarized in Fig. 8. The endogenous concentration of short-lifetime NAD(P)H is smaller in high-frequency sensory cells than in pillar cells [Fig. 8(a)]. Furthermore, both the short- and long-lifetime pools are comprised of significantly shorter lifetimes in untreated sensory cells than in untreated pillar cells [Figs. 8(b) and 8(c)]. Acute exposure to GM does not change the overall populations of the short- and long-lifetime pools [Fig. 8(a)], but it does lengthen the lifetimes of both pools in sensory cells, with little change in either lifetime pool for pillar cells [Figs. 8(b) and 8(c)]. This is evident in both regions of the cochlea, but it is particularly significant for high-frequency sensory cells that are more likely to be damaged by GM exposure. Fig. 8Short- and long-lifetime distributions vary by cell type and treatment. The short-lifetime fraction of the NAD(P)H pool is greatest in pillar cells and not affected by acute GM (a). GM significantly increases short (b) and long (c) NAD(P)H fluorescence lifetimes in high-frequency cochlear sensory cells, but not supporting cells (*, **, ***).  Although GM does not cause a significant redistribution between short- and long-lifetime pools, the lengthening of each indicates that NAD(P)H is redistributing within these pools. This is clearly evident in Fig. 9, which compares the concentration-weighted lifetime distributions for two representative cochlear explants (untreated control and 30-min GM exposure). Distinct populations can be identified with lifetimes of approximately 0.6, 1.0, 1.2, 1.6, 4.7, 5.7, 6.7, and 7.5 ns. In high-frequency sensory cells, GM increases the relative concentration of the 1.6 ns population at the expense of the 0.6 ns population and decreases the 4.7 ns population while establishing 5.7 and 6.7 ns populations. In contrast, the pillar cells do not show a population at 0.6 or 4.7 ns, but have their own characteristic redistribution in response to GM. These dynamics, illustrated by representative explants in Fig. 9, are the source of the changes in the short- and long-lifetime components shown in Figs. 8(b) and 8(c). Fig. 9Endogenous NAD(P)H lifetimes are uniquely distributed between short- () and long- () lifetime pools for high-frequency sensory and supporting cells (a, c, e). Acute exposure of GM causes a redistribution of NAD(P)H between several microenvironments (b, d, f). Each distribution is the cell-type average of representative cochlear explants (: 13 IHCs, 27 OHCs, 13 pillars; and : 10 IHCs, 9 OHCs, 7 pillars).  4.DiscussionUnfortunate side effects, including ototoxicity, remain a significant problem for the effective use of AG antibiotics. The similar characteristics of antibiotic-, age-, and noise-induced HL suggest that a common set of mechanisms are involved. These mechanisms must account for both the high-to-low-frequency susceptibility gradient and the preferential damage/loss of OHCs compared with IHCs and neighboring supporting cells. During acute exposures, AG antibiotics gain entry into the sensory cells via mechanotransduction channels, whereas supporting cells do not appear to have a mechanism enabling rapid drug influx. Once inside the cell, the resulting oxidative stress differs by cell type. This may be due, in part, to the intrinsic differences in intracellular antioxidants such as glutathione that exists in limited quantities in high-frequency cells and decreases with aging.54,55 Furthermore, AG antibiotics are also known to have common oxidative damage pathways leading to the generation of ROS by altering cellular metabolism.28 AG antibiotics induce mitochondrial dysfunction resulting in oxidative stress and damage in mammalian cells through a direct interaction with enzymes of the TCA cycle and the electron transport chain.23,25 The exact mechanism of AG’s interaction(s) with the enzymes of the TCA cycle and electron transport chain has yet to be determined. While a great deal of attention has been placed on long-term responses (24 to 96 h following antibiotic treatment) which can be due, in part, to the reductions in protein synthesis, we have found that the mitochondrial disruption can be detected within 30 min of exposure to physiologically relevant concentrations of GM. This includes changes in NAD(P)H lifetimes, concentrations, and mitochondrial membrane potential as well as previously described changes in NAD(P)H fluorescence intensity and succinate dehydrogenase activity.45,46 Notably, OHC-specific decreases in NAD(P)H intensity following GM exposure were found in both of these previous studies, which repetitively imaged the entire cochlear preparation every 10 min over the period of 1 h. To reduce the oxidative stress due to imaging, which is especially important when working with compromised tissues, in this study we refined the imaging protocol by (1) improving the temperature stability of the cochlear explants by using a regulated stage heater, and (2) limiting acquisition to a single FLIM image within an apical or basal section of the cochlear explant. 4.1.Sensory and Supporting Cells of the Cochlear Explant Are Metabolically DifferentMetabolic imaging by NAD(P)H FLIM revealed intrinsic metabolic differences between both the sensory and supporting cells of the cochlea. Furthermore, when apical (low-frequency, ) and basal (high-frequency, ) regions were compared, metabolic differences were evident based on the location of the cells along the tonotopic gradient.47 Both NAD(P)H intensity (Fig. 3) and NAD(P)H lifetime (Fig. 4) measurements reveal endogenous metabolic differences between sensory and supporting cells. Significant differences were evident in the NAD(P)H dynamic range observed in each cell type, with high-frequency OHCs having the greatest oxidation and reduction capacities (Fig. 3). Significant differences between sensory and supporting cell average NAD(P)H lifetimes were observed in untreated and mitotoxin-treated cochlear preparations. This suggests that the microenvironment of NAD(P)H varies between these cell types. Additional metabolic differences were observed by assessing the cellular NAD(P)H microenvironment through the distribution of fluorescence lifetimes within short- and long-lifetime pools (Figs. 8 and 9), with the greatest differences seen in high-frequency regions of the cochlea. Finally, significant cell-specific differences in NAD(P)H concentration (Fig. 6) provide further evidence for endogenous differences between sensory and supporting cells' mitochondrial metabolism. These findings also reveal metabolic differences between IHCs and OHCs. High- and low-frequency OHCs were seen to be brighter (Fig. 3) and have greater NAD(P)H concentrations (Fig. 5) than IHCs. Despite the differences in NAD(P)H intensity and concentration, IHCs and OHCs have similar average NAD(P)H lifetimes (Fig. 4), suggesting similar NAD(P)H microenvironments. This is further supported by the NAD(P)H lifetime distributions (Fig. 8 and 9), which have similar peak lifetimes, and no significant differences in NAD(P)H lifetimes in either the short () or long () pool. Blacker et al.44 have recently reported a way of discriminating NADPH fluorescence from NADH fluorescence in HEK and cochlear cells. They found that the enzyme-bound NADPH is responsible for the lifetime component in HEK293 cells, whereas enzyme-bound NADH was predicted to have a lifetime of .44 These values agree very well with the peaks of the lifetime distributions shown in Figs. 9(a) and 9(b). Furthermore, in immature (postnatal day 2) rat cochlear explants, they observed longer lifetimes (3.5 ns) for NAD(P)H in the outer pillar cells compared with the sensory cells (2.9 ns). This is also in agreement with the results presented in Figs. 7–9, which also compare outer pillar and sensory cells. If, for simplicity, it is assumed that all decays with a lifetime in excess of 2.0 ns represent enzyme-bound NADPH [as suggested by Blacker et al. and Figs. 9(a) and 9(c)], then Fig. 8(a) places an upper limit of about 40% for the NADPH contribution to the total NAD(P)H concentration in sensory cells and approximately 30% for NADPH in the pillar cells. 4.2.Gentamicin Rapidly Enters Sensory Cells and Differentially Alters Cellular MetabolismIt is reasonable to expect entry of AGs into the cochlear cells to be a requirement for their ototoxic effects.56 Figure 1 clearly reveals rapid entry of GM into the sensory cells within minutes of application. Although we did not observe significant regional or sensory cell-type specific differences in GM uptake, differential uptake of AGs as a function of cell type and location has been suggested by others.49 Single NAD(P)H FLIM images of temperature-regulated explants revealed that NAD(P)H fluorescence intensity initially increases with GM exposure in high-frequency sensory cells [Fig. 7(a), black and red bars, respectively]. GM also increased the average NAD(P)H lifetime in low-frequency IHCs [Fig. 7(b)] and tended to reduce the NAD(P)H concentration [Fig. 7(c)], similar to what is seen with mitochondrial uncoupling (Figs. 4 and 5). In OHCs, GM also increased the average lifetime as well as lifetimes in the short- and long-lifetime pools. Given the results of Blacker et al., the lengthening of the long fluorescence lifetime in response to GM may indicate a change in the enzyme-bound pool of NADPH. This would be expected, given the important role that NADPH plays in cellular detoxification by reducing oxidized glutathione caused by elevated levels of ROS. The redistribution toward longer lifetimes within the short-lifetime, enzyme-bound NADH pool, and increased concentration of NAD(P)H are consistent with the observed increase in the polarization of the mitochondrial membrane, reducing the overall rate of NADH oxidation via the electron transport chain. Notably, acute GM does appear to inhibit respiration, but not in the same way as NaCN since the NAD(P)H lifetime decreases with cyanide inhibition (Fig. 4). This suggests that GM is not acting at complex IV, but perhaps at complexes I and/or III as indicated by others.23 These sites are of particular interest since endogenous ROS production of normally functioning mitochondria is thought to be associated with these sites.57 Additional metabolic imaging experiments with specific inhibitors of these complexes are currently underway. Overall, these results support earlier findings of differences between sensory cell mitochondrial metabolism and their responses to GM.46 Finally, NAD(P)H FLIM revealed dynamic variation in both NADH () and putative NADPH () pools in response to acute GM exposure that would not have been discerned by techniques relying only on the average NAD(P)H lifetime or the NAD(P)H intensity. Average NAD(P)H lifetimes in cochlear cells are similar in high- and low-frequency sensory cells and the change in response to GM was only significant for low-frequency IHCs [, Fig 7(b)]. A more detailed analysis of the lifetime distributions revealed that this was due to a combination of changes in both the short-lifetime pool (predominately enzyme-bound NADH) and long-lifetime pool (enzyme-bound NADPH) (Fig. 9). While GM caused a redistribution within each pool, the relative concentrations of each did not vary [Fig. 8(a)]. NAD(P)H lifetimes in both short and long pools within high-frequency sensory cells lengthened in response to GM [Figs. 8(b) and 8(c)], reflecting changes in the NAD(P)H microenvironment that increased the fluorescence quantum efficiency of both pools. In contrast, there was no significant response in the high-frequency pillar cells or in any cells in low-frequency regions. Changes in each pool contributed toward the increase in the NAD(P)H intensity shown in Fig. 7(a). However, since the short/long pool fractions held constant while both short and long lifetimes increased, the fraction of the total NAD(P)H intensity due to NADH was also nearly constant. Hence, FLIM analysis verifies that NAD(P)H intensity properly reflects metabolic changes. FLIM has the advantage of allowing NADH and NADPH effects to be uncoupled, revealing that GM-induced increases in NADH are most significant in the high-frequency OHCs [Fig. 8(b)]. We were unable to detect GTTR entry into the surrounding pillar cells (Fig. 1), and as anticipated, no significant changes in NAD(P)H fluorescence intensity or lifetime were observed in the pillar cells following acute exposure to GM. The observed increase in pillar cell mitochondrial membrane potential and redistribution within short- and long-NAD(P)H lifetime pools does, however, suggest some GM entry into pillar cells may have occurred [Figs. 1(d), 9(e), and 9(f)]. While other recent reports have concluded that GM entry into the supporting cells is negligible,44,48,49 it is likely that GM was present in the pillar cells at much lower concentrations than in sensory cells. On the other hand, changes in pillar cells may also occur as an indirect response to changes in nearby sensory cells. Although GM can slowly enter supporting cells through endocytosis, the rapid changes observed after an acute, 30-min GM exposure suggest that the pillar cells may indeed be responding to changes in nearby OHCs. Though it may be of interest given the potential role that the pillar cells may have in maintaining both the structural and biochemical integrities of the organ of Corti,58 the current experiments cannot distinguish between either of these possibilities. 5.ConclusionsFLIM of NAD(P)H in cochlear explants reveals significant endogenous metabolic differences both between sensory and supporting cells, as well as between IHCs and OHCs. By quantifying both fluorescence intensity and lifetime, FLIM can determine whether changes in fluorescence are the result of a simple increase in the concentration of NAD(P)H, or due to more subtle changes in the NAD(P)H microenvironment that alters its fluorescence quantum efficiency. Consistent with the findings of others, the NAD(P)H FLIM technique can further elucidate changes in both the NADH and NADPH microenvironments in cochlear sensory and supporting cells.44 In this study, we observed variations in both NAD(P)H concentration and lifetime distribution between cochlear cell types in the presence and absence of the AG antibiotic, GM. While significant endogenous differences between the same cells in high- and low-frequency regions of the cochlea were not observed, base-to-apex differences in the metabolic response of cochlear cells to GM were evident. This study lends support for a general mechanism that may contribute not only to antibiotic-induced HL, but also to age- and noise-induced HL. Since mitochondria are known to produce ROS as a normal byproduct of cellular metabolism, endogenous metabolic differences may contribute to the differential sensory cell susceptibility and to the high-to-low frequency vulnerability gradient observed across the spectrum of HL pathologies. AcknowledgmentsResearch reported in this publication was supported by an Institutional Development Award (IDeA) from the National Institute of General Medical Sciences (P20GM103471) and the National Center for Research Resources (G20RR024001) of the National Institutes of Health. MN was supported by R15GM085776. This research was also supported by the National Institute on Deafness and Other Communication Disorders (RO3DC012109), and COBRE (8P20GM103471-09) to HJS. Imaging was conducted at the Creighton University Integrated Biomedical Imaging Facility. GM coupled to Texas Red (GTTR) was a generous gift from Peter Steyger, PhD, Oregon Health and Science University, Portland, Oregon. The contents are the sole responsibility of the authors and do not necessarily represent the official views of NIGMS, NCRR, or NIH. ReferencesW. Wu, S. Sha and J. Schacht,
“Recent advances in understanding aminoglycoside ototoxicity and its prevention,”
Audiol. Neurotol., 7
(3), 171
–174
(2002). http://dx.doi.org/10.1159/000058305 1420-3030 Google Scholar
J. Xie, A. E. Talaska and J. Schacht,
“New developments in aminoglycoside therapy and ototoxicity,”
Hear. Res., 281
(1–2), 28
–37
(2011). http://dx.doi.org/10.1016/j.heares.2011.05.008 HERED3 0378-5955 Google Scholar
E. A. Radigan, N. A. Gilchrist and M. A. Miller,
“Management of aminoglycosides in the intensive care unit,”
Intensive Care Med., 25
(6), 327
–342
(2010). http://dx.doi.org/10.1177/0885066610377968 ICMED9 0342-4642 Google Scholar
G. Toubeau et al.,
“Tissue repair in rat kidney cortex after short treatment with aminoglycosides at low doses. A comparative biochemical and morphometric study,”
Lab. Invest., 54
(4), 385
–393
(1986). LAINAW 0023-6837 Google Scholar
M. D. Rizzi and K. Hirose,
“Aminoglycoside ototoxicity,”
Curr. Opin. Otolaryngol., 15
(5), 352
–357
(2007). http://dx.doi.org/10.1097/MOO.0b013e3282ef772d 1068-9508 Google Scholar
J. Prins et al.,
“Once versus thrice daily gentamicin in patients with serious infections,”
Lancet, 341
(8841), 335
–339
(1993). http://dx.doi.org/10.1016/0140-6736(93)90137-6 LANCAO 0140-6736 Google Scholar
M. Mulheran et al.,
“Occurrence and risk of cochleotoxicity in cystic fibrosis patients receiving repeated high-dose aminoglycoside therapy,”
Antimicrob. Agents Chemother., 45
(9), 2502
–2509
(2001). http://dx.doi.org/10.1128/AAC.45.9.2502-2509.2001 AACHAX 0066-4804 Google Scholar
J. Hawkins and L. Johnson,
“Histopathology of cochlear and vestibular ototoxicity in laboratory animals,”
Aminoglycoside Ototoxicity, 327
–339 Little, Brown and Company, Boston
(1981). Google Scholar
R. P. Hamernik et al.,
“Anatomical correlates of impulse noise-induced mechanical damage in the cochlea,”
Hear. Res., 13
(3), 229
–247
(1984). http://dx.doi.org/10.1016/0378-5955(84)90077-7 HERED3 0378-5955 Google Scholar
I. M. Hunter-Duvar and G. Bredberg,
“Effects of intense auditory stimulation: hearing losses and inner ear changes in the chinchilla,”
J. Acoust. Soc. Am., 55
(4), 795
–801
(1974). http://dx.doi.org/10.1121/1.1914602 JASMAN 0001-4966 Google Scholar
J. C. Saunders, S. P. Dear and M. E. Schneider,
“The anatomical consequences of acoustic injury: a review and tutorial,”
J. Acoust. Soc. Am., 78
(3), 833
–860
(1985). http://dx.doi.org/10.1121/1.392915 JASMAN 0001-4966 Google Scholar
B. Tarnowski et al.,
“Age-related changes in cochleas of Mongolian gerbils,”
Hear. Res., 54
(1), 123
–134
(1991). http://dx.doi.org/10.1016/0378-5955(91)90142-V HERED3 0378-5955 Google Scholar
E. F. Gale et al., The Molecular Basis of Antibiotic Action, John Wiley and Sons, New York
(1981). Google Scholar
D. Moazed and H. F. Noller,
“Interaction of antibiotics with functional sites in 16S ribosomal RNA,”
Nature, 327
(6121), 389
–394
(1987). http://dx.doi.org/10.1038/327389a0 NATUAS 0028-0836 Google Scholar
J. Schacht,
“Molecular mechanisms of drug-induced hearing loss,”
Hear. Res., 22
(1), 297
–304
(1986). http://dx.doi.org/10.1016/0378-5955(86)90105-X HERED3 0378-5955 Google Scholar
M. E. Warchol,
“Cellular mechanisms of aminoglycoside ototoxicity,”
Curr. Opin. Otolaryngol., 18
(5), 454
–458
(2010). http://dx.doi.org/10.1097/MOO.0b013e32833e05ec 1068-9508 Google Scholar
K. Op de Beeck, J. Schacht and G. Van Camp,
“Apoptosis in acquired and genetic hearing impairment: the programmed death of the hair cell,”
Hear. Res., 281
(1), 18
–27
(2011). http://dx.doi.org/10.1016/j.heares.2011.07.002 HERED3 0378-5955 Google Scholar
M. E. Huth, A. J. Ricci and A. G. Cheng,
“Mechanisms of aminoglycoside ototoxicity and targets of hair cell protection,”
Int. J. Otolaryngol., 2011 937861
(2011). http://dx.doi.org/10.1155/2011/937861 1687-921X Google Scholar
E. C. Böttger and J. Schacht,
“The mitochondrion: A perpetrator of acquired hearing loss,”
Hear. Res., 303 12
–19
(2013). http://dx.doi.org/10.1016/j.heares.2013.01.006 HERED3 0378-5955 Google Scholar
P. Steyger et al.,
“Uptake of gentamicin by bullfrog saccular hair cells in vitro,”
J. Assoc. Res. Otolaryngol., 4
(4), 565
–578
(2003). http://dx.doi.org/10.1007/s10162-003-4002-5 1525-3961 Google Scholar
S. N. Hobbie et al.,
“Genetic analysis of interactions with eukaryotic rRNA identify the mitoribosome as target in aminoglycoside ototoxicity,”
Proc. Natl. Acad. Sci. U. S. A., 105
(52), 20888
–20893
(2008). http://dx.doi.org/10.1073/pnas.0811258106 PNASA6 0027-8424 Google Scholar
T. Matt et al.,
“Dissociation of antibacterial activity and aminoglycoside ototoxicity in the 4-monosubstituted 2-deoxystreptamine apramycin,”
Proc. Natl. Acad. Sci. U. S. A., 109
(27), 10984
–10989
(2012). http://dx.doi.org/10.1073/pnas.1204073109 PNASA6 0027-8424 Google Scholar
S. Kalghatgi et al.,
“Bactericidal antibiotics induce mitochondrial dysfunction and oxidative damage in mammalian cells,”
Sci. Transl. Med., 5
(192), 192ra85
(2013). http://dx.doi.org/10.1126/scitranslmed.3006055 STMCBQ 1946-6234 Google Scholar
S. P. Francis et al.,
“A novel role of cytosolic protein synthesis inhibition in aminoglycoside ototoxicity,”
J. Neurosci., 33
(7), 3079
–3093
(2013). http://dx.doi.org/10.1523/JNEUROSCI.3430-12.2013 JNRSDS 0270-6474 Google Scholar
E. Shulman et al.,
“Designer aminoglycosides that selectively inhibit cytoplasmic rather than mitochondrial ribosomes show decreased ototoxicity: a strategy for the treatment of genetic diseases,”
J. Biol. Chem., 289
(4), 2318
–2330
(2014). http://dx.doi.org/10.1074/jbc.M113.533588 JBCHA3 0021-9258 Google Scholar
S. Usami et al.,
“Sensorineural hearing loss caused by mitochondrial DNA mutations: special reference to the A1555G mutation,”
J. Commun. Disord., 31
(5), 423
–435
(1998). http://dx.doi.org/10.1016/S0021-9924(98)00014-8 0021-9924 Google Scholar
K. N. Owens et al.,
“Ultrastructural analysis of aminoglycoside‐induced hair cell death in the zebrafish lateral line reveals an early mitochondrial response,”
J. Comp. Neurol., 502
(4), 522
–543
(2007). http://dx.doi.org/10.1002/(ISSN)1096-9861 JCNEAM 0021-9967 Google Scholar
D. J. Dwyer et al.,
“Antibiotics induce redox-related physiological alterations as part of their lethality,”
Proc. Natl. Acad. Sci. U. S. A., 111
(20), E2100-9
(2014). http://dx.doi.org/10.1073/pnas.1401876111 PNASA6 0027-8424 Google Scholar
B. Chance and G. R. Williams,
“Respiratory enzymes in oxidative phosphorylation. I. Kinetics of oxygen utilization,”
J. Biol. Chem., 217
(1), 383
–393
(1955). JBCHA3 0021-9258 Google Scholar
B. Chance et al.,
“Basic principles of tissue oxygen determination from mitochondrial signals,”
Oxygen Transport to Tissue, 277
–292 Springer(1973). Google Scholar
B. Chance and M. Lieberman,
“Intrinsic fluorescence emission from the cornea at low temperatures: evidence of mitochondrial signals and their differing redox states in epithelial and endothelial sides,”
Exp. Eye Res., 26
(1), 111
–117
(1978). http://dx.doi.org/10.1016/0014-4835(78)90159-8 EXERA6 0014-4835 Google Scholar
J. Vergen et al.,
“Metabolic imaging using two-photon excited NADH intensity and fluorescence lifetime imaging,”
Microsc. Microanal., 18
(04), 761
–770
(2012). http://dx.doi.org/10.1017/S1431927612000529 MIMIF7 1431-9276 Google Scholar
A. Mayevsky and G. G. Rogatsky,
“Mitochondrial function in vivo evaluated by NADH fluorescence: from animal models to human studies,”
Am. J. Physiol. Cell. Physiol., 292
(2), C615
–C640
(2007). http://dx.doi.org/10.1152/ajpcell.00249.2006 0363-6143 Google Scholar
M. G. Nichols et al., Natural Biomarkers for Cellular Metabolism: Biology, Techniques, and Applications, CRC Press(2014). Google Scholar
J. R. Lakowicz et al.,
“Fluorescence lifetime imaging of free and protein-bound NADH,”
Proc. Natl. Acad. Sci. U. S. A., 89
(4), 1271
–1275
(1992). http://dx.doi.org/10.1073/pnas.89.4.1271 PNASA6 0027-8424 Google Scholar
K. Blinova et al.,
“Distribution of mitochondrial NADH fluorescence lifetimes: steady-state kinetics of matrix NADH interactions,”
Biochemistry, 44
(7), 2585
–2594
(2005). http://dx.doi.org/10.1021/bi0485124 BICHAW 0006-2960 Google Scholar
K. Blinova et al.,
“Mitochondrial NADH fluorescence is enhanced by complex I binding,”
Biochemistry, 47
(36), 9636
–9645
(2008). http://dx.doi.org/10.1021/bi800307y BICHAW 0006-2960 Google Scholar
K. A. Kasischke et al.,
“Neural activity triggers neuronal oxidative metabolism followed by astrocytic glycolysis,”
Science, 305
(5680), 99
–103
(2004). http://dx.doi.org/10.1126/science.1096485 SCIEAS 0036-8075 Google Scholar
H. D. Vishwasrao et al.,
“Conformational dependence of intracellular NADH on metabolic state revealed by associated fluorescence anisotropy,”
J. Biol. Chem., 280
(26), 25119
–25126
(2005). http://dx.doi.org/10.1074/jbc.M502475200 JBCHA3 0021-9258 Google Scholar
M. C. Skala et al.,
“In vivo multiphoton fluorescence lifetime imaging of protein-bound and free nicotinamide adenine dinucleotide in normal and precancerous epithelia,”
J. Biomed. Opt., 12
(2), 024014
(2007). http://dx.doi.org/10.1117/1.2717503 JBOPFO 1083-3668 Google Scholar
P. P. Provenzano, K. W. Eliceiri and P. J. Keely,
“Multiphoton microscopy and fluorescence lifetime imaging microscopy (FLIM) to monitor metastasis and the tumor microenvironment,”
Clin. Exp. Metastasis, 26
(4), 357
–370
(2009). http://dx.doi.org/10.1007/s10585-008-9204-0 CEXMD2 0262-0898 Google Scholar
Q. Yu and A. A. Heikal,
“Two-photon autofluorescence dynamics imaging reveals sensitivity of intracellular NADH concentration and conformation to cell physiology at the single-cell level,”
J. Photochem. Photobiol. B, 95
(1), 46
–57
(2009). http://dx.doi.org/10.1016/j.jphotobiol.2008.12.010 JPPBEG 1011-1344 Google Scholar
L. M. Tiede et al.,
“Determination of hair cell metabolic state in isolated cochlear preparations by two-photon microscopy,”
J. Biomed. Opt., 12
(2), 021004
(2007). http://dx.doi.org/10.1117/1.2714777 JBOPFO 1083-3668 Google Scholar
T. S. Blacker et al.,
“Separating NADH and NADPH fluorescence in live cells and tissues using FLIM,”
Nat. Commun., 5 3936
(2014). http://dx.doi.org/10.1038/ncomms4936 NCAOBW 2041-1723 Google Scholar
L. Tiede et al.,
“Metabolic imaging of the organ of corti—a window on cochlea bioenergetics,”
Brain Res., 1277 37
–41
(2009). http://dx.doi.org/10.1016/j.brainres.2009.02.052 BRREAP 1385-299X Google Scholar
H. C. Jensen-Smith, R. Hallworth and M. G. Nichols,
“Gentamicin rapidly inhibits mitochondrial metabolism in high-frequency cochlear outer hair cells,”
PloS One, 7
(6), e38471
(2012). http://dx.doi.org/10.1371/journal.pone.0038471 1932-6203 Google Scholar
H. C. Ou, G. W. Harding and B. A. Bohne,
“An anatomically based frequency-place map for the mouse cochlea,”
Hear. Res., 145
(1), 123
–129
(2000). http://dx.doi.org/10.1016/S0378-5955(00)00082-4 HERED3 0378-5955 Google Scholar
C. Dai et al.,
“Uptake of fluorescent gentamicin by vertebrate sensory cells in vivo,”
Hear. Res., 213
(1), 64
–78
(2006). http://dx.doi.org/10.1016/j.heares.2005.11.011 HERED3 0378-5955 Google Scholar
J. Lee et al.,
“Different uptake of gentamicin through TRPV1 and TRPV4 channels determines cochlear hair cell vulnerability,”
Exp. Mol. Med., 45
(3), e12
(2013). http://dx.doi.org/10.1038/emm.2013.25 EMMEF3 1226-3613 Google Scholar
A. Alharazneh et al.,
“Functional hair cell mechanotransducer channels are required for aminoglycoside ototoxicity,”
PLoS One, 6
(7), e22347
(2011). http://dx.doi.org/10.1371/journal.pone.0022347 1932-6203 Google Scholar
N. Dehne et al.,
“Involvement of the mitochondrial permeability transition in gentamicin ototoxicity,”
Hear. Res., 169
(1), 47
–55
(2002). http://dx.doi.org/10.1016/S0378-5955(02)00338-6 HERED3 0378-5955 Google Scholar
J. E. Gale et al.,
“FM1-43 dye behaves as a permeant blocker of the hair-cell mechanotransducer channel,”
J. Neurosci., 21
(18), 7013
–7025
(2001). JNRSDS 0270-6474 Google Scholar
P. R. Bevington and D. K. Robinson, Data Reduction and Error Analysis for the Physical Sciences, McGraw-Hill, New York
(2002). Google Scholar
S. Sha et al.,
“Differential vulnerability of basal and apical hair cells is based on intrinsic susceptibility to free radicals,”
Hear. Res., 155
(1), 1
–8
(2001). http://dx.doi.org/10.1016/S0378-5955(01)00224-6 HERED3 0378-5955 Google Scholar
H. Jiang et al.,
“Oxidative imbalance in the aging inner ear,”
Neurobiol. Aging, 28
(10), 1605
–1612
(2007). http://dx.doi.org/10.1016/j.neurobiolaging.2006.06.025 NEAGDO 0197-4580 Google Scholar
H. Hiel et al.,
“Gentamicin uptake by cochlear hair cells precedes hearing impairment during chronic treatment,”
Int. J. Audiol., 32
(1), 78
–87
(1993). http://dx.doi.org/10.3109/00206099309072930 1499-2027 Google Scholar
J. F. Turrens,
“Mitochondrial formation of reactive oxygen species,”
J. Physiol. (Lond.), 552
(2), 335
–344
(2003). http://dx.doi.org/10.1113/jphysiol.2003.049478 JOPHAN 0021-7948 Google Scholar
R. Thalmann et al.,
“Toward an understanding of cochlear homeostasis: the impact of location and the role of OCP1 and OCP2,”
Acta Otolaryngol., 123
(2), 203
–208
(2003). http://dx.doi.org/10.1080/0036554021000028100 AOLAAJ 0001-6489 Google Scholar
BiographyLyandysha V. Zholudeva is a graduate student in the Department of Neurobiology and Anatomy at Drexel University. She received her BS degree with a major in biochemistry from Creighton University in 2014. Kristina G. Ward is a graduate student in the Physics Department at Creighton University. She received her BS degree with a major in physics from Creighton University in 2013. Michael G. Nichols is a professor and director of the graduate program in physics in the College of Arts and Sciences at Creighton University. He received his BS degree in physics from Harvey Mudd College in 1990 and a PhD degree in physics from the University of Rochester in 1996. His research interests include biophysical optics, fluorescence microscopy, single-molecule techniques, and cellular biomechanics. Heather Jensen Smith is an assistant professor in the School of Medicine at Creighton University. She received her BA degree in biopsychology and neuroscience from the University of Nebraska-Lincoln and a PhD degree in biomedical sciences from Creighton University in 2000 and 2006, respectively. Her research interests focus on the role of mitochondrial dysfunction and cell-damaging reactive oxygen species formation in mediating cochlear sensory cell damage that results in permanent hearing loss. |


